

Dollar Strength Resumes, Bitcoin Decouples
The DXY rose to 101.37 on June 23, up from 99.24 a month earlier, reclaiming the 200-day MA of 98.72 for the first time since April's 'Liberation Day' shock. Bitcoin has not participated in this macro recovery; it currently trades at $62,651, 18% below its 200-day MA of $76,466. The rebound remains an equity market story driven by U.S. corporate earnings resilience, while a stronger DXY is a headwind for BTC.
Deep Discount Zone: True Market Price vs. STH Cost Basis
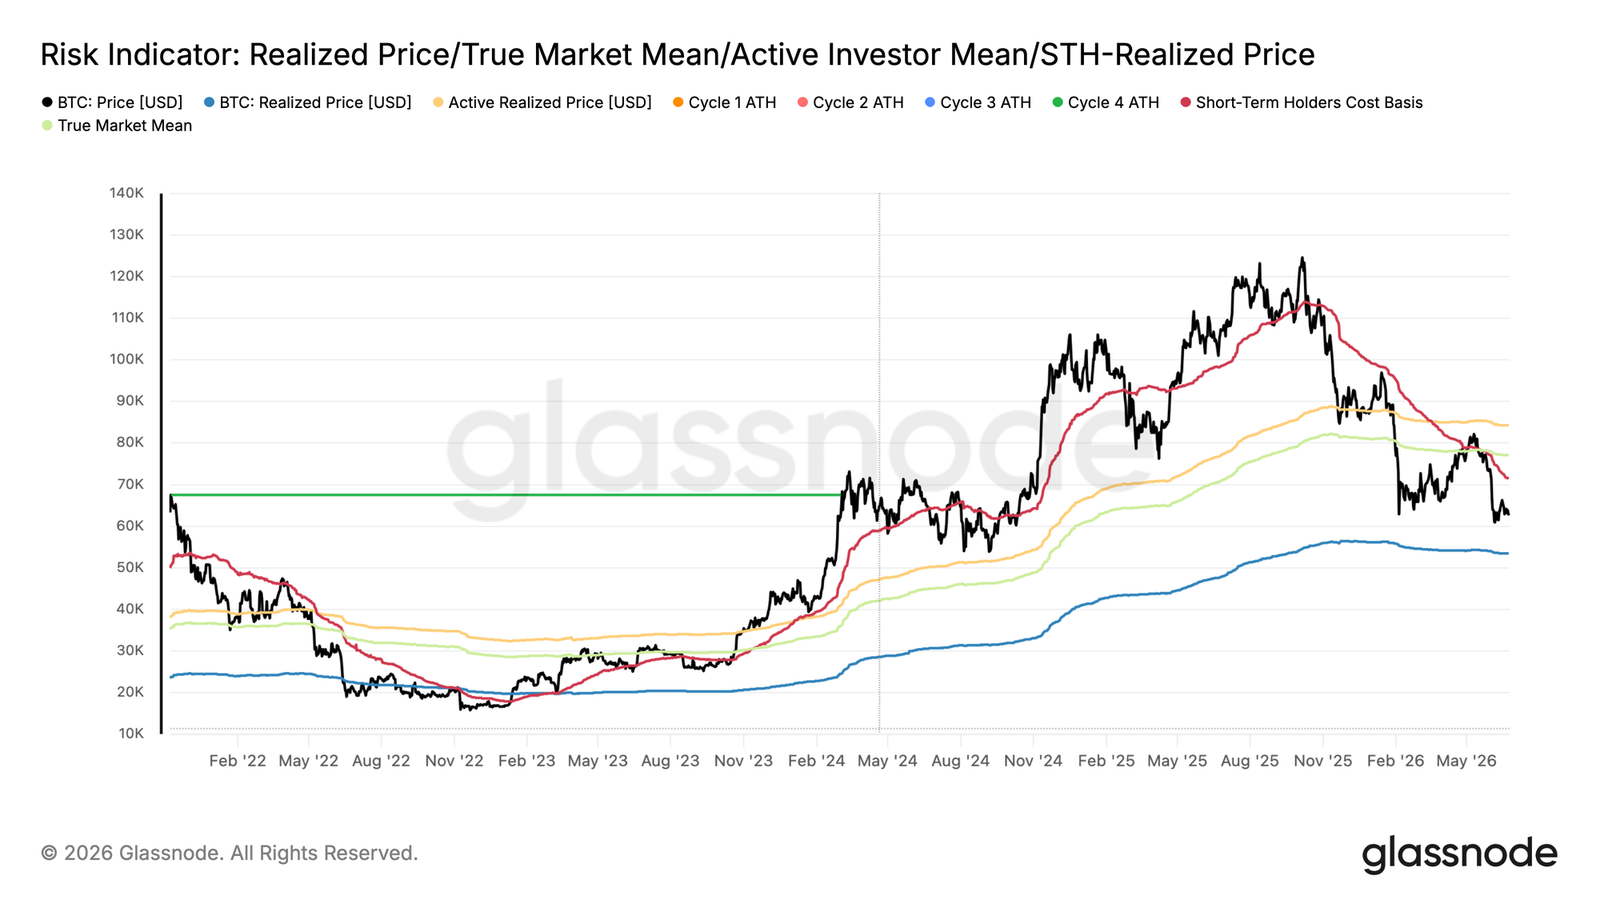
Bitcoin's spot price of $62,300 is far below the true market average price (non-miner active investor average cost basis) of $77,000, a 19% discount indicating structural bear territory. The short-term holder (STH) cost basis has declined to $71,400, reflecting new buyers accumulating heavily below the true market price. This is a constructive development for bottom formation — fresh capital is deploying at prices increasingly decoupled from recent cycle overheating. Supply accumulated in this bear phase has smaller losses relative to the cycle's hanging supply and is expected to show greater resilience to further drawdowns. If macro-driven downside materializes in coming weeks, the realized price of $53,400 serves as a reasonable lower bound for the short-to-medium-term bear range.
Net Realized Profit/Loss Confirms Loss Dominance
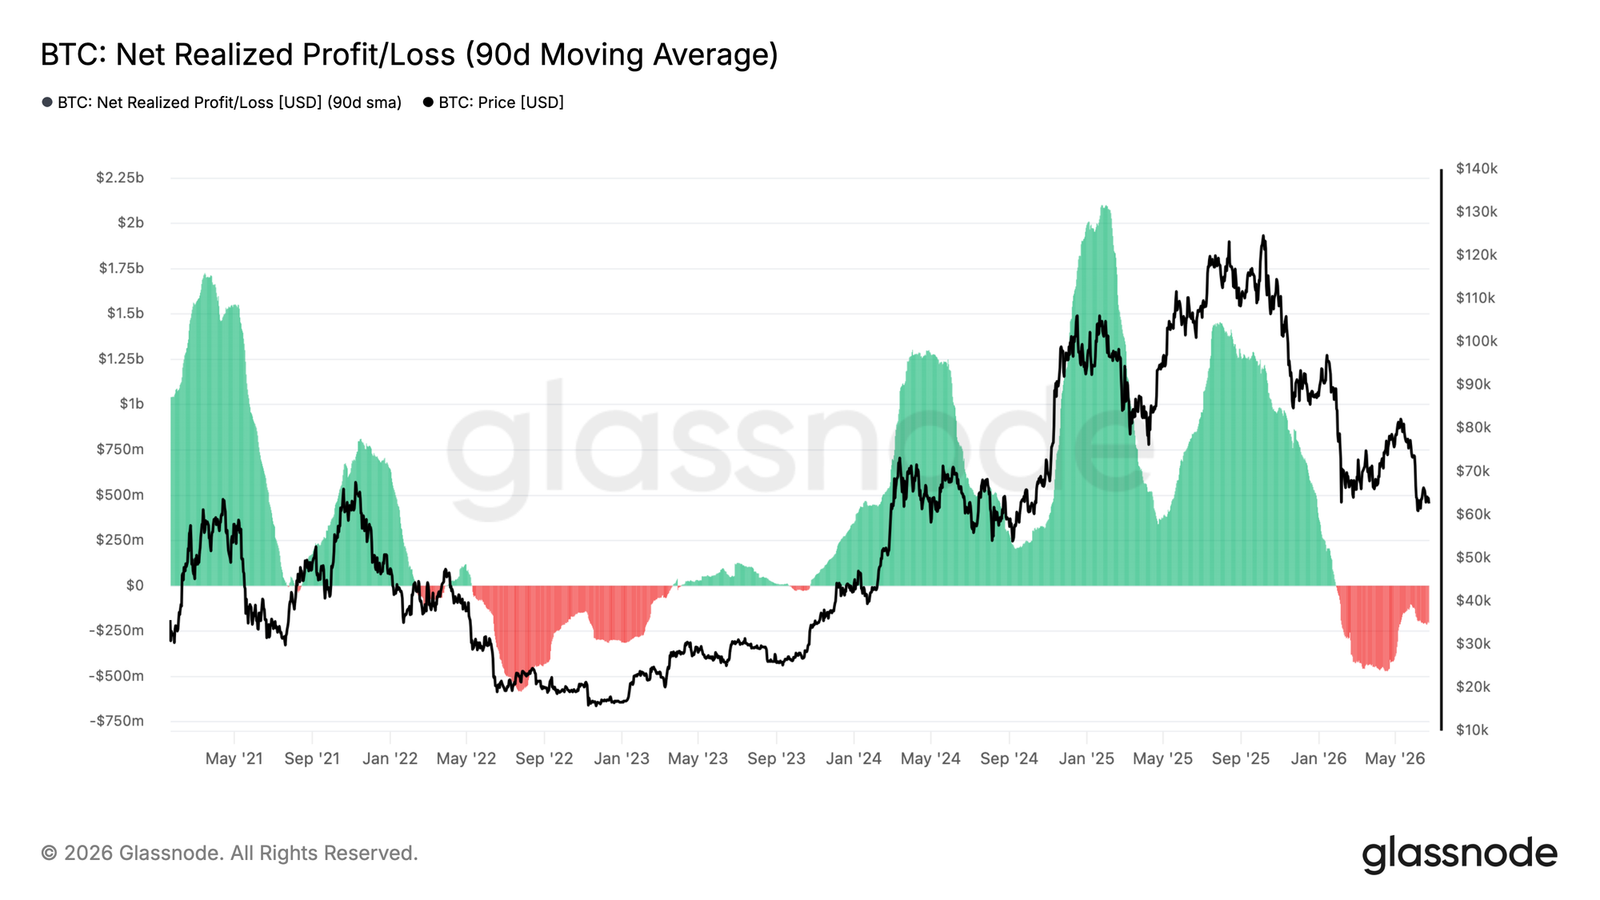
The 90-day moving average of the net realized profit/loss indicator currently sits at -$205 million per day, confirming that loss realization has become the dominant force in the broader trend, suggesting market gravity tilts toward the lower end of the current range (near the realized price). This reading reflects a deeply embedded loss-dominant environment rather than a single stress event. A recovery to neutral (near zero) would be a strong signal that seller exhaustion is forming, paving the way for pre-bull transition conditions.
Supply Overhead Caps Short-Term Moves
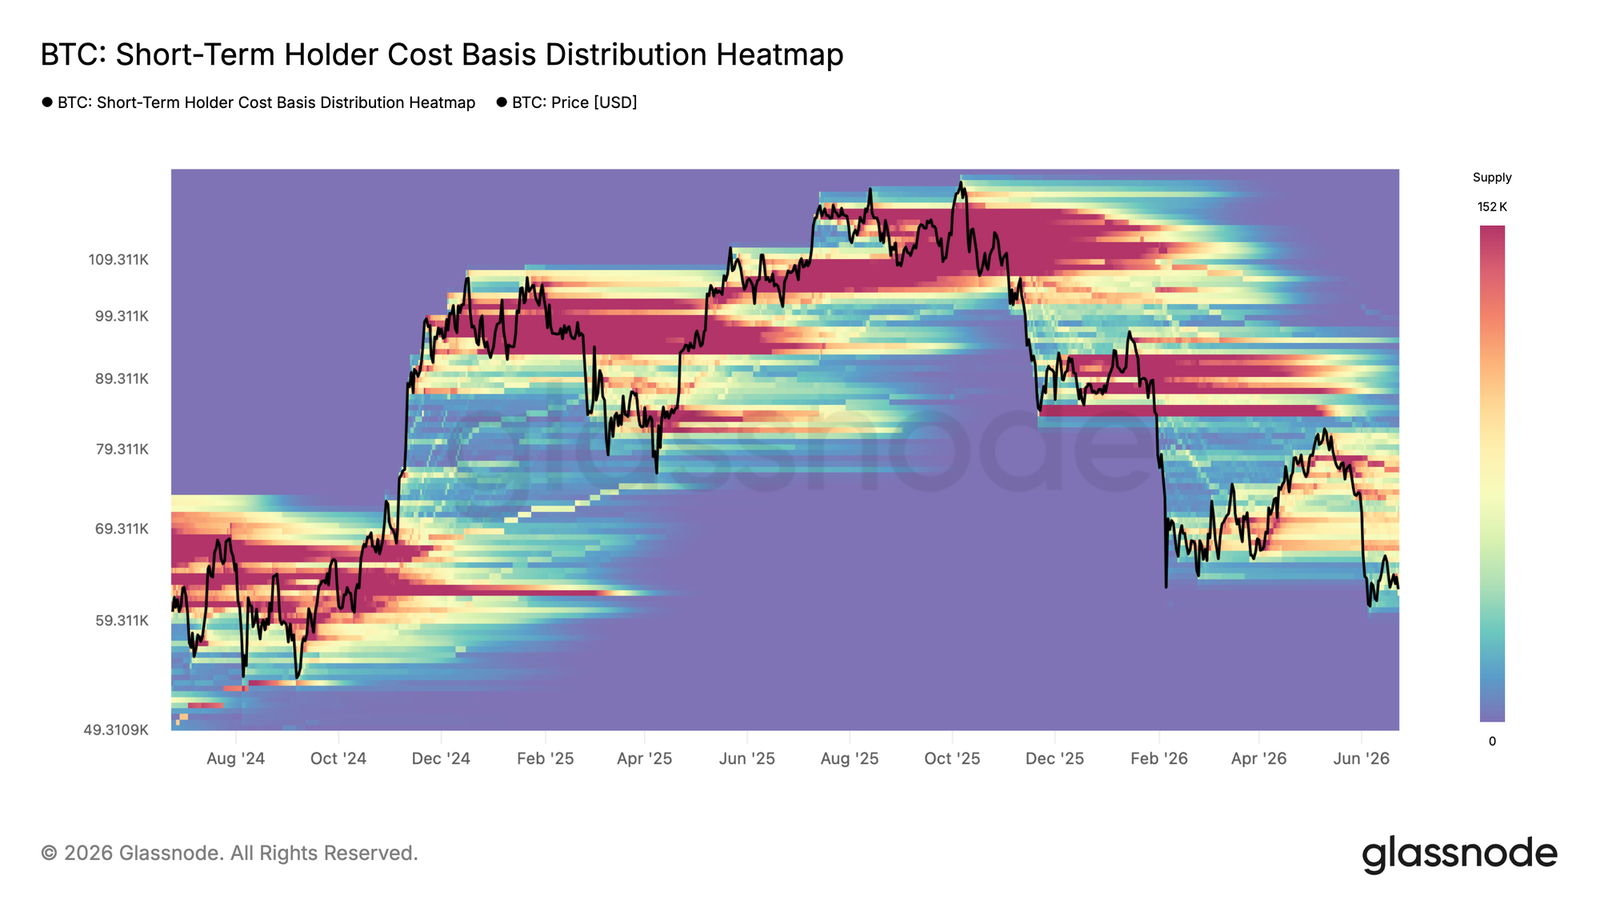
The most prominent cluster of short-term holder supply overhead lies in the $66,800–$70,700 range, representing recently accumulated tokens now underwater that are likely to generate selling pressure on any bounce attempt. This zone effectively defines the most likely ceiling for short-term consolidation or relief rallies, as holders near breakeven tend to exit. A sustained recovery above $66,800 would significantly alleviate overhead pressure and increase the probability of an extension toward the STH cost basis of $71,400. Until then, this local hanging supply remains an active anchor capping upside momentum.
ETF Outflows Persist: Institutions Remain Defensive
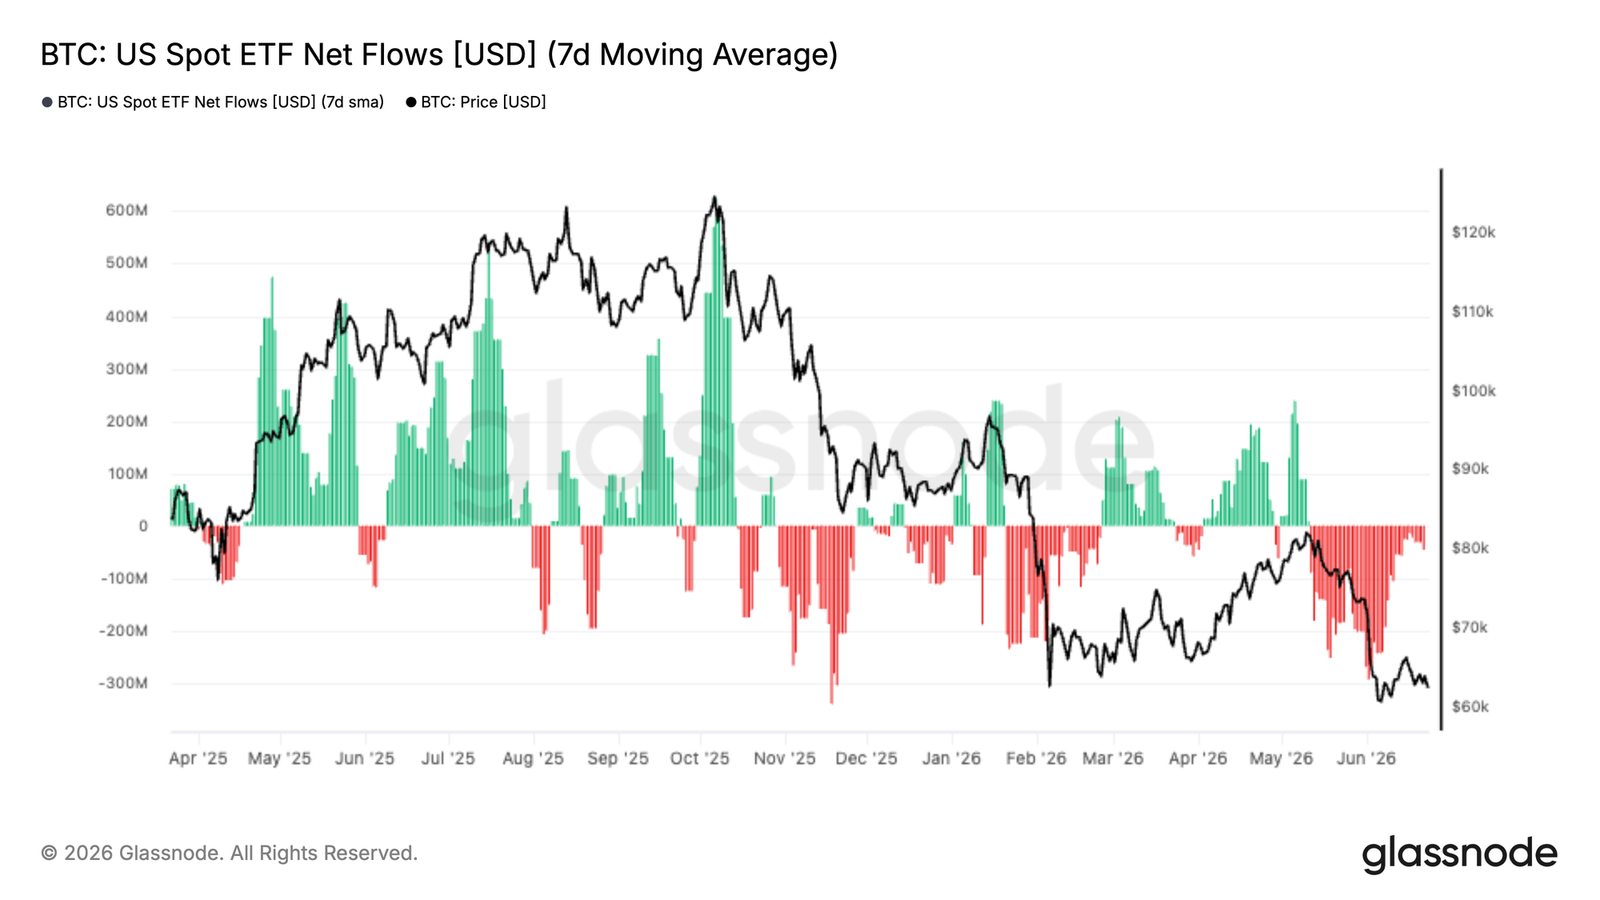
U.S. spot ETF net outflows average nearly -$300 million per day on a 7-day basis, one of the most sustained withdrawal periods since the ETF launch. Unlike previous corrections that typically attracted ETF buying as a key demand source during weakness, this redemption episode shows traditional investors are reducing exposure rather than accumulating despite BTC trading near the lower range of $60,000–$65,000. Grayscale's GBTC accounts for the largest share of redemptions, with over 16,000 BTC exiting in the past 90 days, indicating weakness driven primarily by legacy holder liquidation and portfolio rebalancing rather than a uniform retreat across the entire ETF segment.
Spot Buyers Return: Coinbase vs. Binance Divergence
While the overall spot CVD bias remains negative, recent bounces show net selling intensity is easing. The most notable development is the significant recovery in Coinbase spot CVD to positive territory, signaling buying from the platform typically associated with U.S. institutional players. Binance remains negative, suggesting overseas traders stay defensive. This behavioral divergence points to an increasingly uneven market structure: institutional investors appear to absorb supply during weakness, while speculative participants remain cautious. Although the broader spot market has not yet returned to sustained accumulation, the improvement in Coinbase demand indicates some investors already view current prices as attractive entry levels.
Futures Follow Spot: Leveraged Participants Capitulate
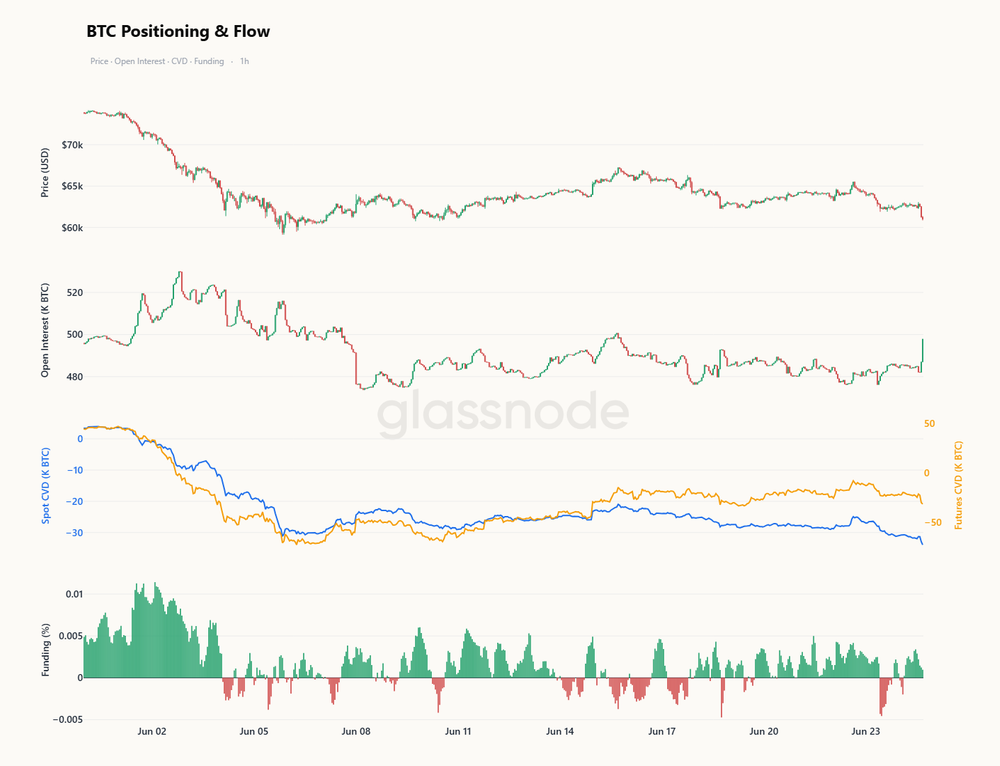
Over the past ten days, the spot CVD has fallen much faster than futures CVD, indicating that aggressive selling pressure originated in spot venues rather than from leveraged liquidations. Open interest remained subdued during the decline, and funding rates stubbornly stayed positive, showing perpetual longs were unwilling to capitulate. However, as Bitcoin retested the lows, open interest surged, futures CVD turned negative alongside spot, and leveraged participants finally joined the move. Funding rates have declined from elevated levels, easing the bullish bias that had become increasingly disconnected from price action. If open interest continues to rise while futures CVD falls and funding rates soften, it will confirm that leverage is capitulating toward the same lows spot has already sold off—a broader participation that often marks a more violent and thorough washout.
Options Market: Implied Volatility Stabilizes, Skew Rises
After the sharp repricing triggered by Bitcoin's drop to June lows, the options market has entered a calmer zone. The front end remains the most volatile: one-week ATM implied volatility briefly exceeded 42% during the latest sell-off before retreating to around 37%; the one-month tenor fell from about 40% to 38%, while longer tenors held relatively stable (three-month and six-month IV near 39% and 42% respectively). Despite BTC continuing to trade near $60K–$63K support, this stabilization suggests traders are no longer aggressively repricing risk, and much of the protective premium from the recent stress period has been removed. The volatility risk premium (implied minus realized) remains negative: one-month IV at ~38% vs. realized volatility at ~42%, a gap of -4 volatility points. Skew (put volatility minus call volatility) has risen across the curve: one-week skew from ~12% to 24%, one-month from ~14% to 23%, with three- and six-month also increasing to ~19% and 14% respectively. This indicates renewed demand for downside protection despite stable volatility levels. Gamma exposure shows two large positive gamma clusters at $60K and $64K, with BTC currently trading between them at ~$62.8K. In positive gamma zones, market maker hedging tends to suppress volatility, helping contain spot within the $60K–$64K range.
Early Signals of Bottom Formation
Bitcoin continues to trade in a market defined by caution rather than conviction. On-chain metrics show the asset at a deep discount relative to average investor cost basis, persistent loss realization indicates a firmly established bear phase, and ETF outflows alongside defensive options positioning highlight the lack of broad risk appetite from institutional and derivative participants. Beneath the surface, however, early signs of stabilization are emerging: Coinbase spot flows have turned constructive, the short-term holder cost basis has adjusted downward, and the recent weakness was primarily driven by spot sellers rather than excessive leverage. While these developments do not signal an imminent reversal, they align with the early-stage characteristics of a bottoming process. The market remains in a tug-of-war between ongoing distribution and emerging value-driven demand, and this contest will define Bitcoin's next major move.