
A simple factory example sits at the center of the argument
MarsBit published a long article by GritMeng arguing that three decades of supply-chain digitization have not removed the core contradictions inside manufacturing. The piece says global manufacturers have spent hundreds of billions of dollars on ERP, MES, APS, S&OP processes and control-tower systems, yet many companies still face the same cluster of problems: high inventory, high shortages, high cost, high volatility and high friction.
The article describes a familiar outcome. A company grows from tens of billions in revenue to hundreds of billions, procurement, production, sales and finance all hit strong KPI scores, and then the year-end numbers show something else: net margin is cut sharply and return on invested capital, or ROIC, falls from 15% into a 3%-6% range.
Its main target is the standard management prescription for departmental conflict. In the usual view, sales, production, procurement and finance fight because silos are too strong and teams lack a company-wide perspective. Bring them together more often, align the data, run S&OP harder, and the conflict should ease. GritMeng argues the opposite. In the article’s framing, better forecasts, cleaner data and denser coordination meetings do not necessarily reduce conflict. They can make scheduling fights on the shop floor worse.
Shared resources and bottlenecks create what the author calls a physical bind
The article starts from a basic premise about modern manufacturing. Companies that want lower costs and scale effects do not run as small workshops with one order tied to one dedicated material. Different products and customers share common parts, standard modules and production lines.
That scale, the author says, brings linear cost benefits but also creates a superlinear expansion in topological coupling. One side is horizontal exclusivity: the same shared material, or the same bottleneck machine, can feed multiple orders, but once one order takes it, the others cannot. The other side is vertical completeness: an order can only start when every material and resource in the bill of materials is ready, so the true start time is determined by the latest-arriving constraint:
T_complete = max(readiness time of each material/resource in the BOM) + processing cycle
In the article’s wording, horizontal sharing and vertical bottlenecks combine into a network where one move changes the whole system. To strip away excuses, the author sets up what is described as a four-part sterile lab: forecasts are 100% accurate, inventory and BOM data are 100% clean, capacity constraints are 100% complete, and rules are 100% clear, with no bad actors and no lazy actors inside the company.
The four-step chain reaction: two orders, three materials
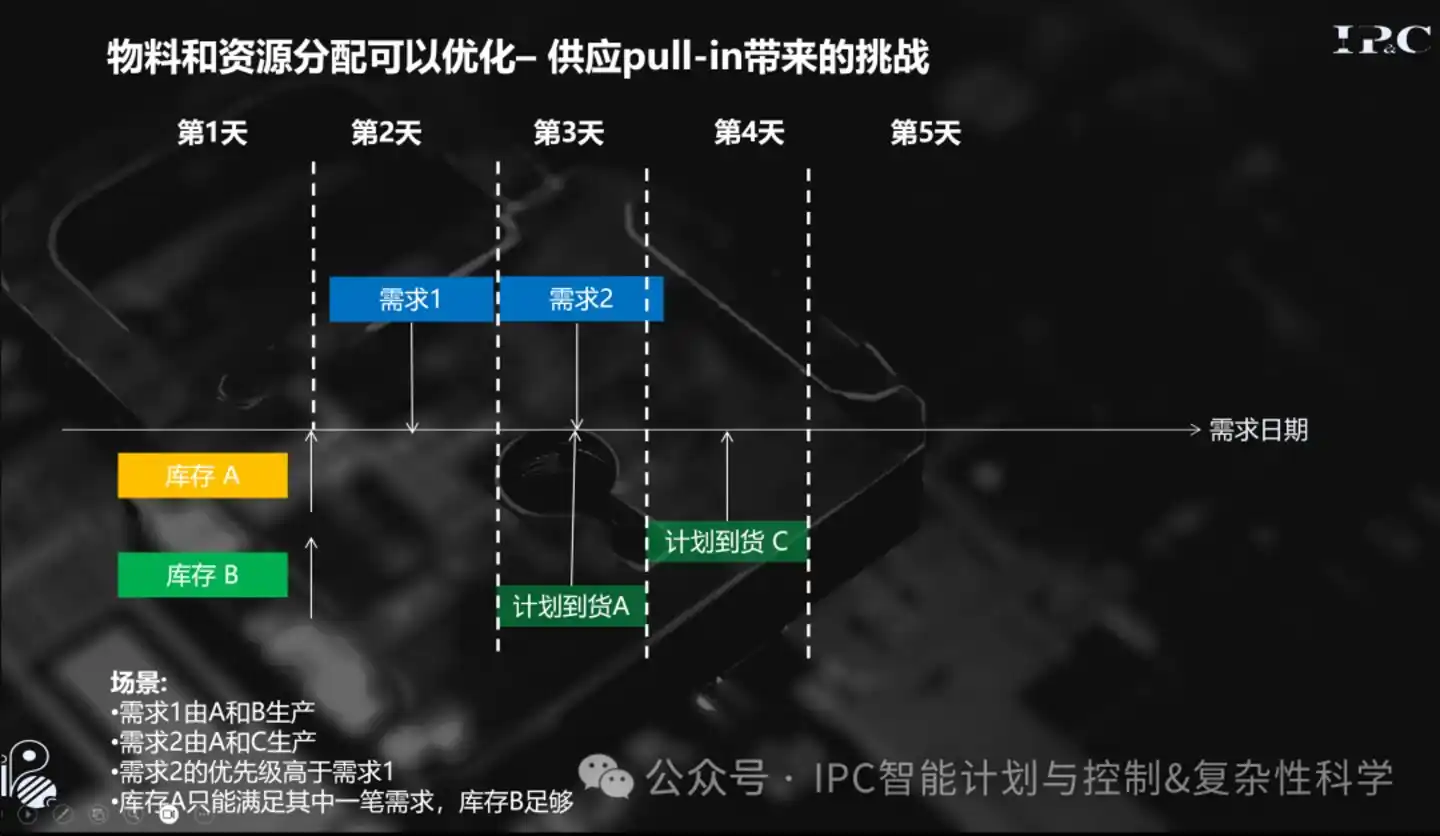
Into that perfect system, the article places two demand orders and three materials: shared material A, dedicated material B and bottleneck material C. It adds that the same logic also applies if A is interpreted as shared machine capacity, a production slot, a mold or even a funding quota, while C can stand for an upstream bottleneck process or outsourced supporting capacity. In the author’s view, materials and resources are structurally identical at the physical layer.
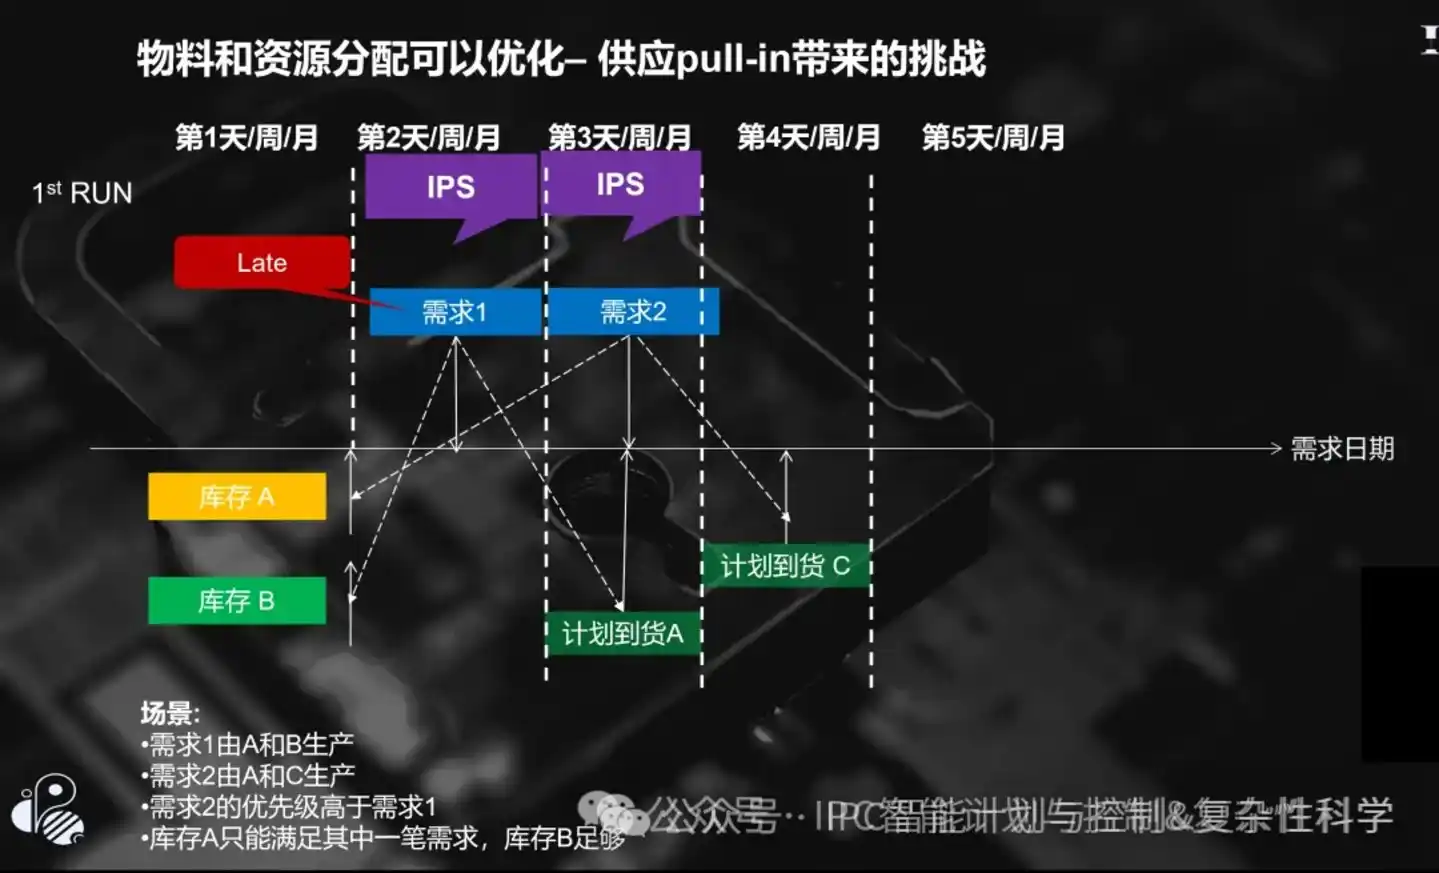
The resource setup runs from period 1 to period 5. At the start, the warehouse has only one unit of shared material A, enough for only one order, while dedicated material B is sufficient. In period 3, a planned inbound batch of A arrives. In period 4, a planned inbound batch of C arrives.
The two orders are defined as follows:
- Demand 1 is a normal order with lower priority. It requires A + B and is due in period 2. Because B is sufficient, it can be completed and delivered in period 2 as long as it gets on-hand A. Its true completion period is T_complete = 2.
- Demand 2 is a strategic high-priority order. It requires A + C and is due in period 3. But because bottleneck material C does not arrive until period 4, it cannot physically become complete before period 4. Its true completion period is T_complete = 4.
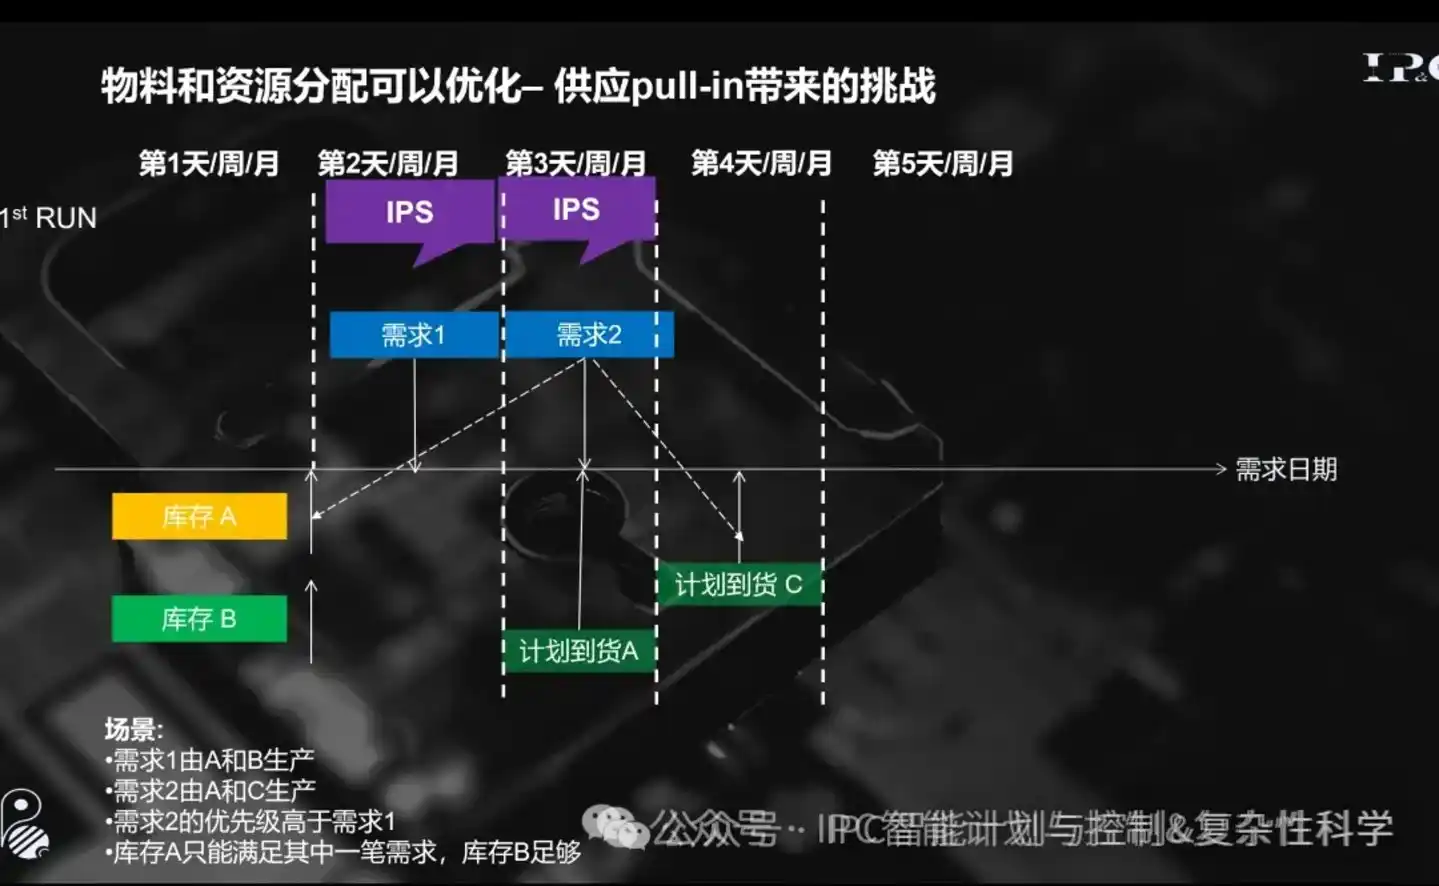
The scheduling engine then follows what the article calls the obvious rule: higher-priority demand gets resources first. From there, the author lays out a four-step reaction.
Step 1: the higher-priority order locks the early resource
The system processes Demand 2 first, grabs the only on-hand unit of A in period 1 and locks it exclusively, then matches it with the planned arrival of C in period 4. The physical result is straightforward: Demand 2 is pinned to period 4 because of C, but the unit of A that was available in period 1 sits idle for three full periods waiting for that bottleneck to clear.
Step 2: the order that could close earlier gets blocked
The system then turns to Demand 1, which is due in period 2. B is available and the line is free, but the key shared material A has already been reserved by Demand 2. Demand 1 stops immediately for lack of material.
Step 3: the earlier order becomes late
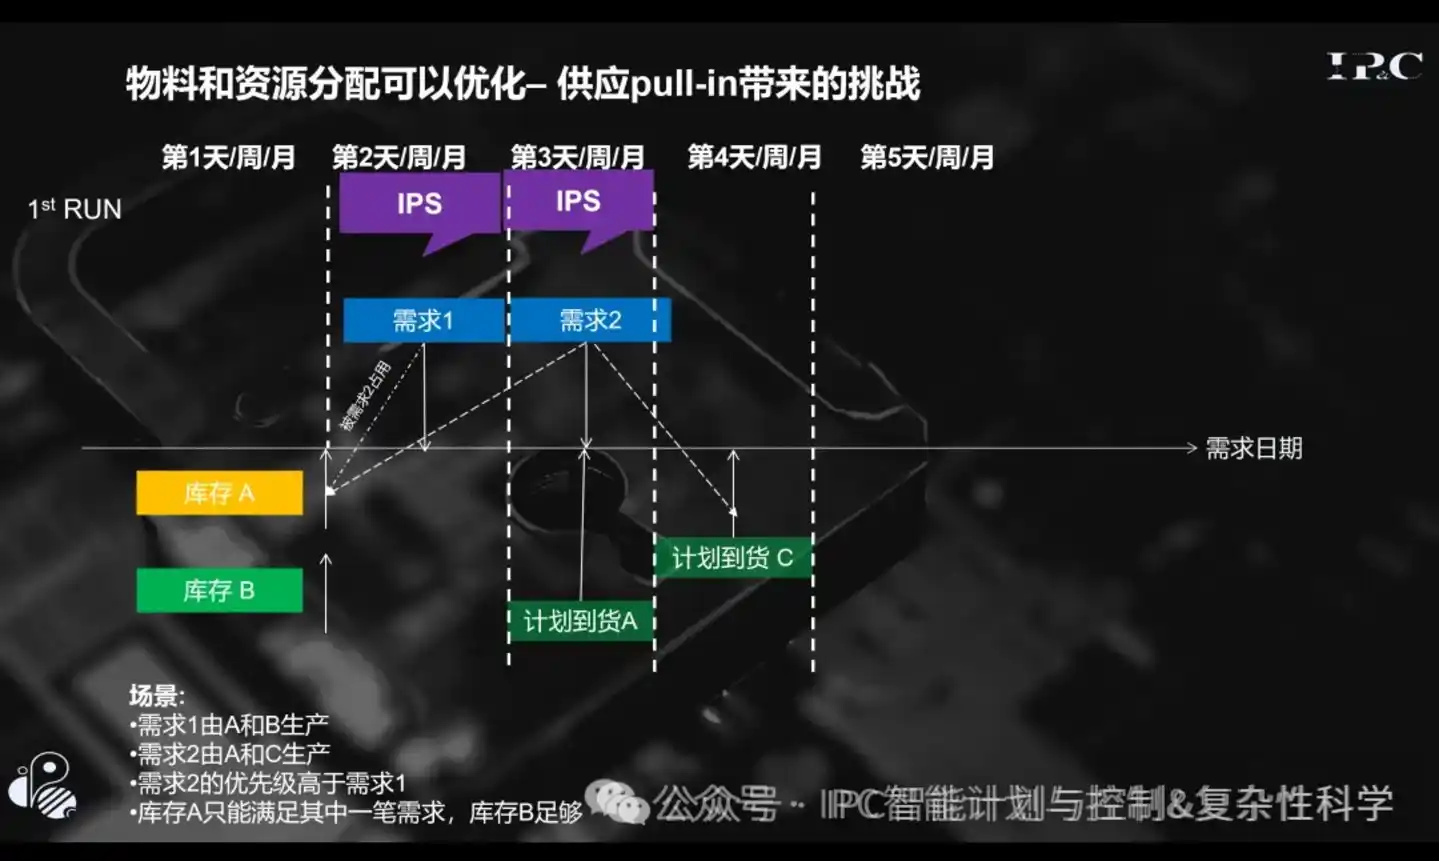
The system can only assign the planned inbound A arriving in period 3 to Demand 1. An order that could have shipped and generated cash in period 2 is pushed into period 3 and marked late.
Step 4: an X-shaped cross mismatch appears
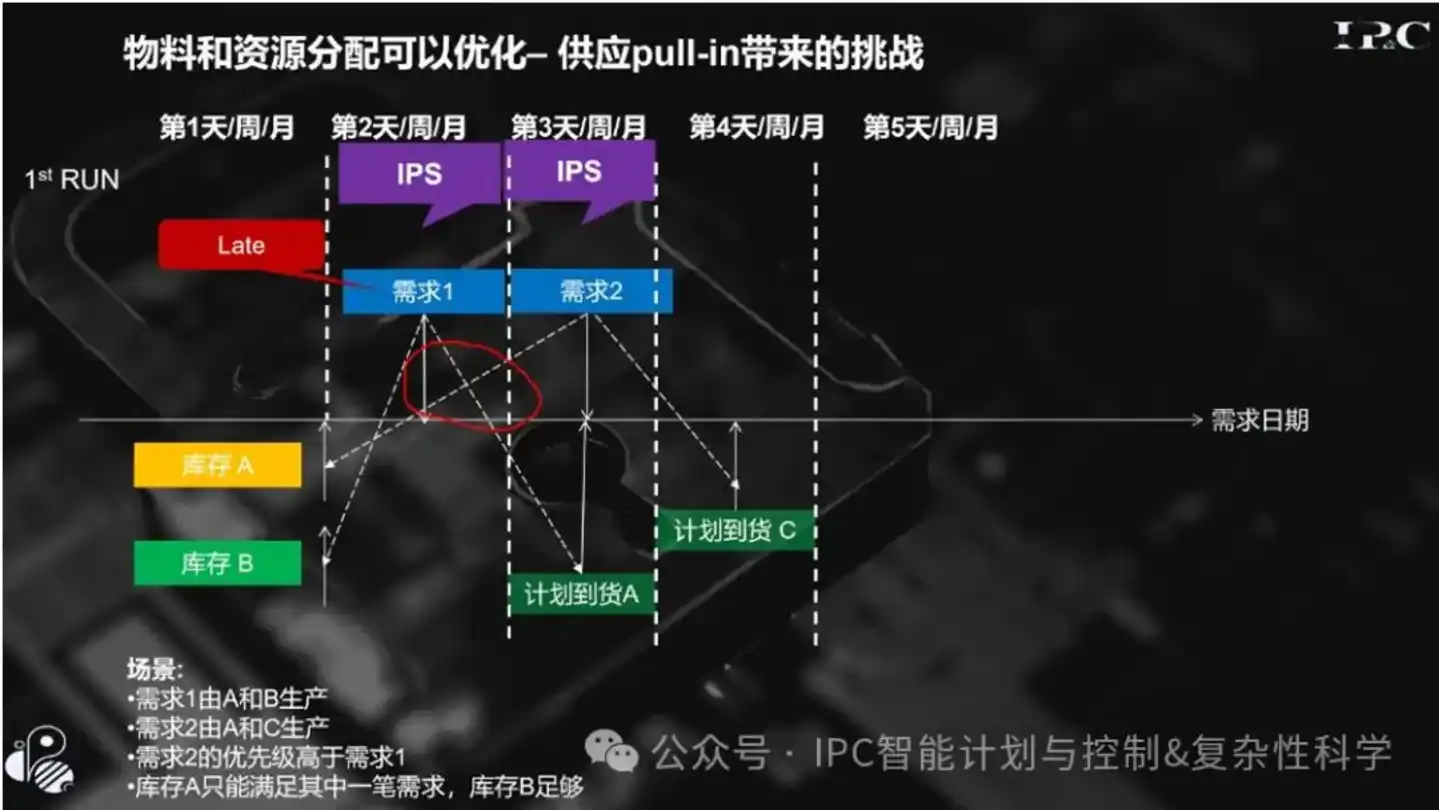
Viewed across time, the supply-demand links twist into what the article calls a rigid X-shaped cross. Demand 1 needs product in period 2 but waits for A that arrives in period 3. Demand 2 cannot start until period 4 but occupies the available A from period 1 onward.
For the author, that red-circled crossing is the key to a much larger claim about manufacturing over the past 30 years.
Five conclusions drawn from the example
1. The "five highs" are not just human inefficiency
The article says the sterile setup removes bad forecasts, dirty data and selfish departments, yet high inventory, shortages, idle capacity and late delivery still erupt at the same time. The reason, in its telling, is that the old planning logic asks only who is important, not who can close the loop earlier. It treats importance and early resource occupation as the same thing.
GritMeng labels this the "sorting-coupling law." As long as the system sits in a topologically coupled state with shared resources, any action that locks resources sequentially under a static one-way priority rule rewrites the remaining material and capacity state. That lets a high-priority order constrained by a late bottleneck seize early shared resources and block another order that could have completed earlier. The article compresses the result into one line: what should have happened early gets delayed, and what should have waited ends up blocking the road.
2. Department KPI clashes are physically coupled through shared resources
The article argues that KPI conflict is not mainly a matter of attitude or perspective. It is a physical coupling problem tied to the same material. One example in the piece is the late arrival of bottleneck material C in period 4, which it says often happens because procurement chooses a cheaper but slower batch to satisfy a cost-reduction KPI.
That single choice on C then propagates through shared material A. Because C arrives late, Demand 2 is stuck in period 4, and the on-hand A is locked in inventory for three periods. Finance and warehouse turnover metrics deteriorate. Then Demand 1, which could have shipped in period 2, stops for lack of A, and production utilization and sales on-time delivery metrics deteriorate as well. In the article’s framing, what companies have long called departmental KPI conflict is a deterministic projection of a deeper physical deadlock created by crossed supply-demand matching.
3. S&OP can intensify the conflict it is supposed to solve
When a company sees full warehouses but no shippable orders, executives usually call a coordination meeting. The article lists the familiar moves: special approval for a key customer rush order, manual elevation of one order’s priority, forced allocation of locked inventory. Once the X-shaped mismatch is understood, the author says, the danger becomes obvious. Every administrative move to protect one KPI pushes a high-priority order to seize early shared resource A, even when that order is still constrained by another bottleneck, C.
The article sketches the chain reaction this way: sales inserts a rush order, production loses material and changes setups, procurement pays up for spot supply and emergency air freight, and semi-finished goods pile up on the floor. All four departments are working hard, but their efforts point in opposing directions and cancel each other out. The author calls that vector cancellation. From there comes a broader claim: in a topologically coupled system, more accurate front-end forecasting can lock cross mismatches faster, stronger optimization power can enlarge network-wide internal friction, and more frequent S&OP meetings can sharpen KPI conflict across departments.
4. The lockup runs through strategy, tactics and operations
The article says S&OP is not just a monthly executive meeting. In practice, it first coordinates quantities and then allocates them across time and space. That process runs vertically through strategy, tactics and operations, and all three layers are physically doing the same thing: allocating shared resources.
- At the strategic layer, monthly or quarterly IBP, management may reserve bottleneck capacity and long-cycle core materials for a strategic customer one to three months ahead. The actual complete build may not happen for two months, but the resources are frozen from the current month, crowding out regular demand that could ship and collect cash sooner.
- At the tactical layer, weekly MPS or ITP, an urgent order in one product family may lock the shared chips arriving that week, then stall before final assembly because another outsourced part is missing. Other product families that use the same chip then pile up as work in process.
- At the operational layer, daily S&OE or IOP, the day’s schedule grabs workstations and complete kits. A workshop manager then finds that a high-priority order is missing an auxiliary part and privately splits orders or shifts materials to protect labor hours. The planner, constrained by what the article describes as a 4±1 information-block memory limit in the human brain, opens Excel and manually untangles the mess. Each manual move tears the traceability chain of the higher-level plan.
This, the author says, is why companies can spend tens of millions of yuan on top-level S&OP and master planning and still end up with two disconnected systems. The article quotes a control-theory rule: what cannot be observed cannot be controlled. Strategic S&OP is compared to GPS navigation, tactical planning to a gearbox, and operational execution planning to tire grip. If the bottom layer slips every day because of cross mismatch and manual patchwork, the upper layers only help the company make major mistakes with greater precision.
5. Diseconomies of scale show up as a direct hit to ROIC
The article also challenges the usual explanation for diseconomies of scale. Rather than blaming bureaucracy alone, it says the physical core is superlinear internal vector cancellation that eventually overwhelms the linear benefit of spreading fixed costs.
Using a typical discrete manufacturer with annual revenue of 10 billion yuan as an example, the article says cross mismatch can quietly destroy several hundred million to more than one billion yuan a year:
- Procurement: false shortages trigger emergency air freight and spot-buy premiums, adding 280 million to 630 million yuan annually.
- Production: micro-level material breaks create intermittent idle lines and frequent unplanned changeovers, eroding 150 million to 350 million yuan of effective capacity each year.
- Inventory: early-arriving shared parts get frozen by bottlenecks and semi-finished goods are locked from both sides, tying up 500 million to 900 million yuan of cash flow on average each year, plus 80 million to 150 million yuan in markdown provisions.
- Sales: delivery slippage, large orders blocked by one missing part and smaller orders breached because resources were occupied can cost 500 million to 1.2 billion yuan in revenue, plus tens of millions in penalties.
The article says recovering that internal waste heat could lift ROIC from 3%-6% back above 15%.
The proposed fix: separate importance from execution timing
In the solution section, the article says the root problem is the cross mismatch created by two orders and three materials, so meetings cannot untie it. The answer, in the author’s terms, is dimensional separation: split "who matters more" from "who should go first" at the algorithmic layer.
Micro level: soft allocation and spatiotemporal SWAP
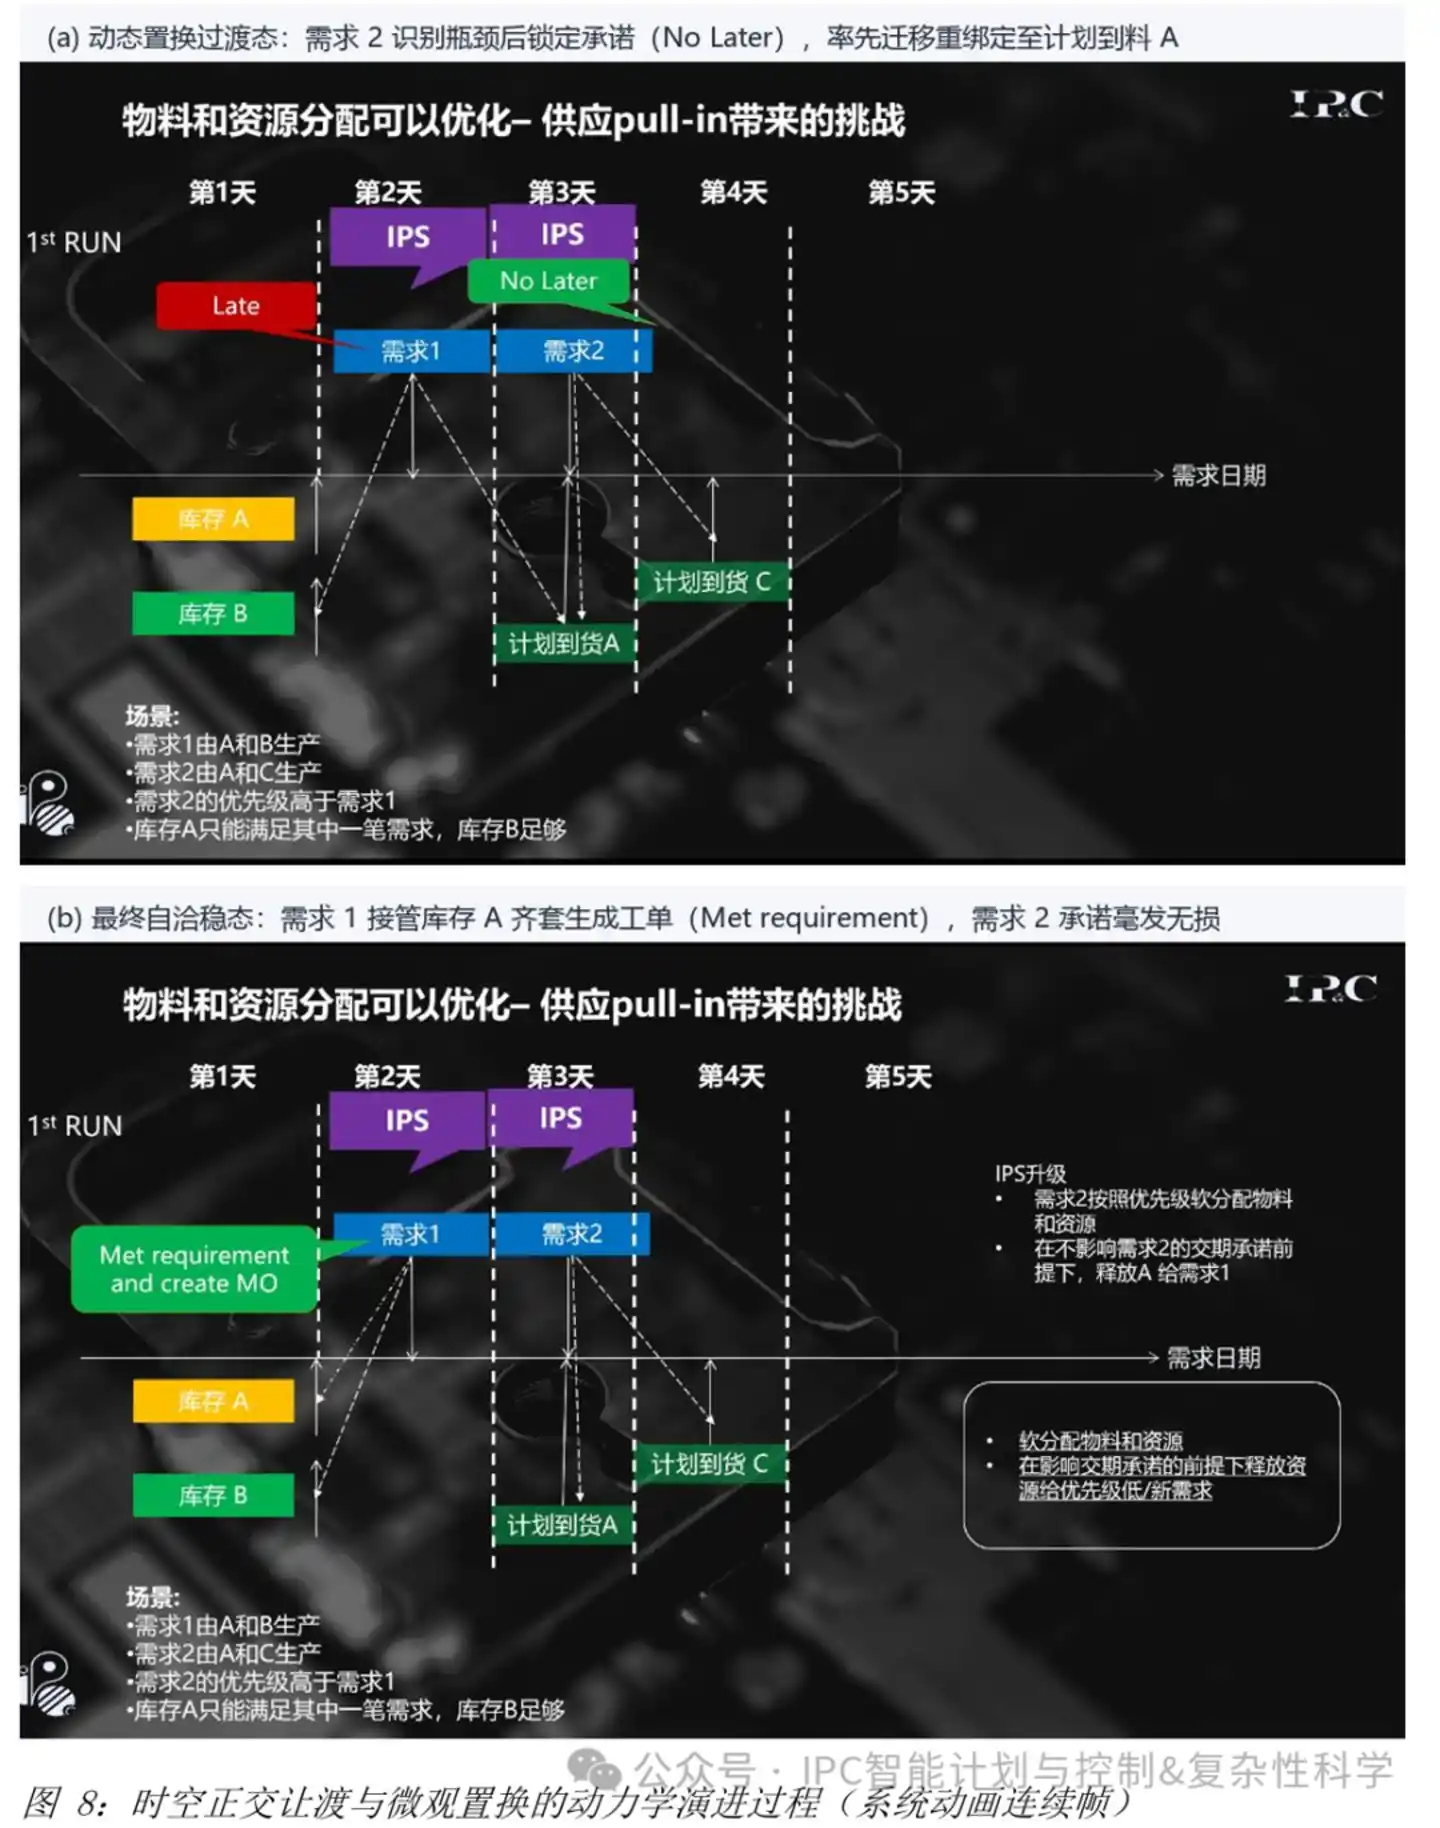
The article returns to the two-order example. Once the algorithm penetrates the BOM, it can see that high-priority Demand 2 must wait until period 4 for bottleneck material C, while the planned inbound A in period 3 is still early enough for assembly in period 4. Under a strict promise that Demand 2 will not be pushed later — the article uses the term No Later — the system can release Demand 2’s hard lock on the on-hand A in period 1 and remap it to the inbound A in period 3. The period-1 A is then dynamically released to Demand 1, which can close the loop in period 2. The article describes that move as "Met requirement and create MO."
The claimed result is immediate. Demand 1 ships on time in period 2. Demand 2 also ships on time in period 4. The line runs at full load, utilization reaches 100%, procurement needs no emergency buys, and the warehouse carries no dead stock. In the article’s telling, the KPI conflict across four departments disappears without a single bargaining meeting.
Macro level: a binary orthogonal governance architecture
The article then scales the problem up. In a real factory, demand can run from hundreds of orders to tens of thousands, materials from tens of thousands to millions, and multi-level BOMs connect what look like isolated cases into one network. The author argues that if traditional optimization solvers such as Gurobi or CPLEX, or large models, are used for full matching search, the state space explodes at factorial complexity, O(N!). After hours of computation, memory can still overflow, and one inserted order on the shop floor can make the result obsolete.
To address that, the article presents what it calls an industrial-grade binary orthogonal governance architecture:
- Extensive material flow: because material quantities are additive, the system first calculates the true completion time of each demand based on its bottleneck, then pulls materials orthogonally along that timeline so early inventory naturally flows to demands that can close earlier. It also cuts the serial day-by-day chain in traditional MRP and converts it into lock-free parallel computation over cumulative water-level intervals. The article says that reduces complexity from O(N!) to O(N) and removes more than 95% of cross mismatch.
- Discrete capacity states: machine time is not additive. After material flow is straightened out, the engine only handles the small number of exposed machine bottleneck residuals through microsecond-level local SWAP operations inside an isolated sandbox, with complexity converging to O(N log N).
- Bottom-up three-layer integration, or One Plan: instead of planning top-down, the system first fixes the real-time meshing of materials and capacity at the operational execution layer, IOP/S&OE, and writes back residuals. It then connects upward to the rigid allotment constraints of the tactical layer, ITP/MPS, and the global allocation plan of the strategic layer, IBP. The article says strategy, tactics and operations then converge in milliseconds inside one in-memory data model and one engine.
The evidence and benchmark figures cited in the piece
The article says this is not just a mathematical exercise and points to two sets of figures.
The first is an 18-year industrial closed-loop case. According to the author, the mechanism ran inside Lenovo’s global Integrated Planning System, or IPS, which the author says he designed as chief architect. The system covered six self-owned global bases and three ODM manufacturing networks including LCFC. The article says the mechanism operated stably for 18 years and delivered an autonomous decision rate outside the human loop of more than 95%, a 48-hour delivery-response rate above 98%, 95% of demand not late, 82% of demand not early, a 1.9x improvement in inventory turns, and the release of tens of billions of yuan in operating cash flow.
The second is a laptop-scale stress test. After leaving Lenovo, the author says he rebuilt the logic from the theoretical axioms in "Value Chain Physics" into a computational foundation based on Data-Oriented Design, or DOD, and 496 algebraic primitive operators, creating a first-generation IPC engine for intelligent planning and control. The article says the system has a portfolio of 20 core national invention patents, with nine disclosed and five already granted.
On an ordinary personal laptop, the article says, the IPC engine handled a multinational-scale planning network with 2 million material types, 500,000 discrete demand orders, a 20-level deep BOM and 230 million expanded planned orders. It completed global convergent solving from IBP, ITP and IP&O to IOP in 296 seconds, less than five minutes.
The article’s closing claim
The piece ends by arguing that data middle platforms, control towers and large visual dashboards do not by themselves solve supply-chain planning. A cleaner windshield does not drive the car, the author writes, and a sharper rear-view mirror only shows the accident in higher resolution if there is no decision-making brain capable of real-time orthogonal action.
Its final point is blunt. Supply-chain management is not mainly about drafting plans or negotiating KPI compromises in meetings. It is about continuously removing vector cancellation across strategy, tactics and execution in physical time and space, then turning that recovered waste into ROIC and free cash flow. As long as factories still rely on shared resources, the article says, the sorting-coupling law remains active. If a company does not solve cross mismatch at the physical layer, cross mismatch will eventually solve the company’s profit statement for it.