
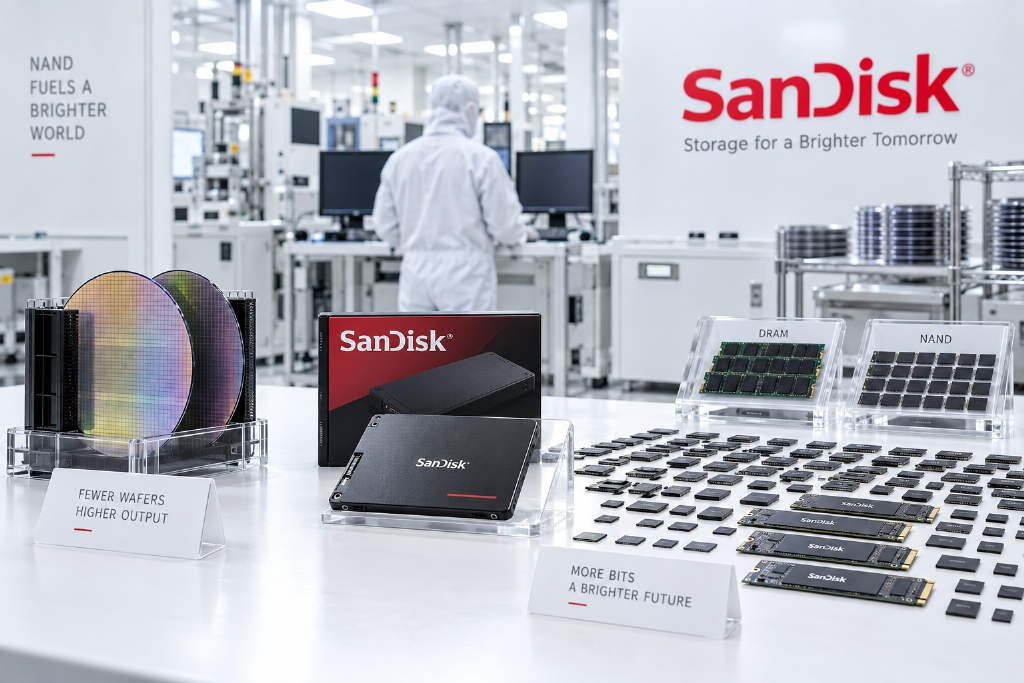
Dolphin Research said in a new long-form note that SanDisk, after shedding the burden of its legacy hard-disk business, is now fully focused on the NAND flash market and is positioned to benefit from the current industry recovery. The report follows an earlier piece on AI inference and SanDisk’s possible turnaround, and centers on three questions: what kind of industry NAND was before the AI wave, why NAND supply repeatedly falls into a cycle where cuts fail to reduce output, and why DRAM and NAND, despite both being foundational memory technologies, end up with very different cycle dynamics.
SanDisk shipped far more bits, but pricing erased the gain
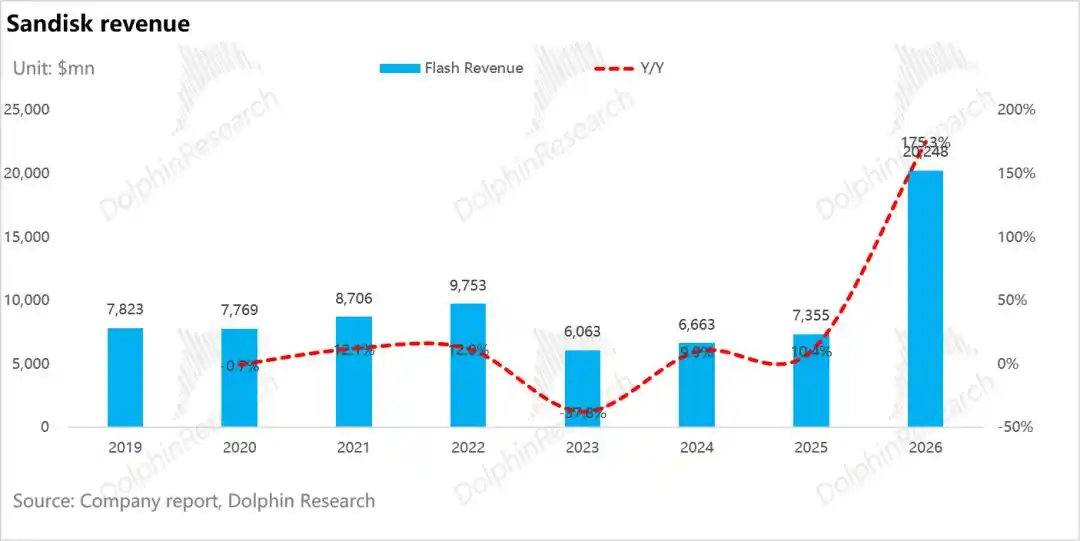
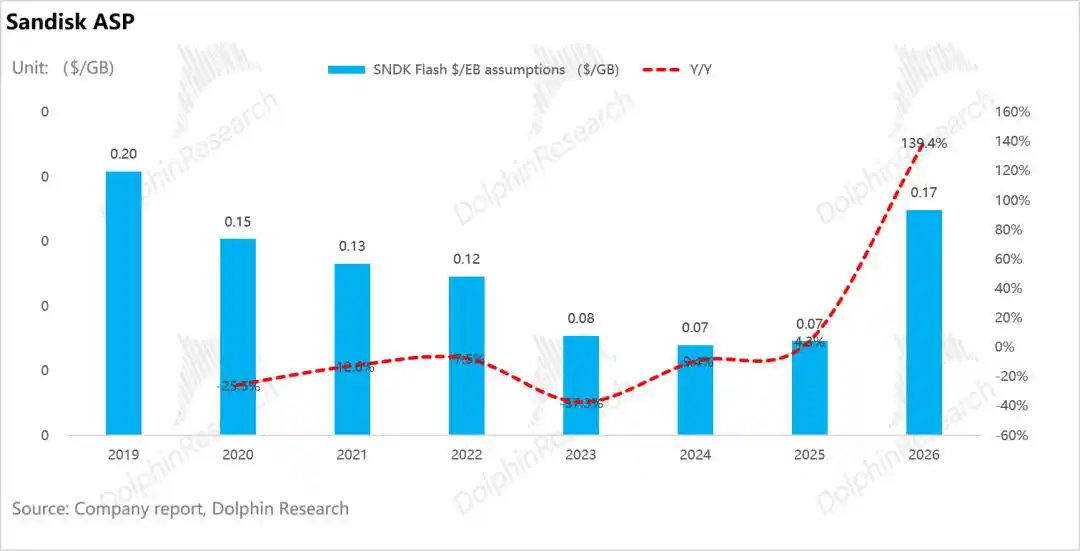
The report says SanDisk’s flash business from 2019 to 2025 shows an unusual manufacturing pattern when volume and price are separated. Bit shipments rose from 38 EB to 101 EB, up 166% over six years. ASP per GB, however, fell from $0.206 to $0.073, a 65% drop. As a result, flash revenue did not expand with shipments and instead slipped from $7.82 billion to $7.36 billion, down 6%.
That, in Dolphin Research’s view, captures the harsh economics of NAND. Cost declines created by technology progress do not stay with manufacturers for long. They are largely passed through to downstream buyers, which means producing more does not reliably translate into producing more revenue.
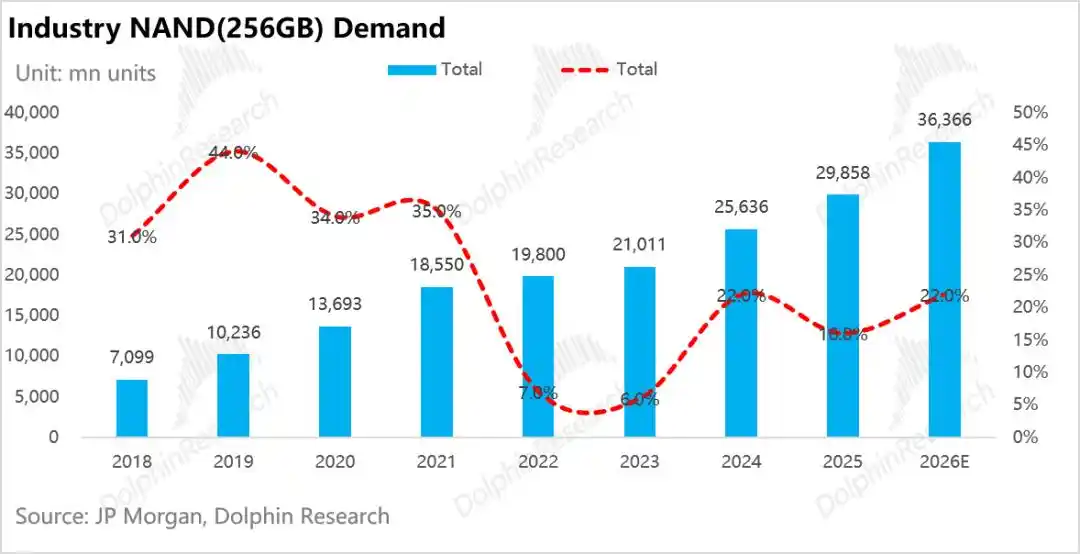
Demand was strong through 2021, then slowed sharply in 2022 and 2023
According to the report, downstream NAND demand grew at more than 30% a year from 2018 to 2021, with annual growth ranging from 34% to 46%. Three forces drove that stretch.
- Smartphone adoption and capacity upgrades pushed handset NAND bit demand to a 34% annual average growth rate from 2018 to 2021.
- PCs moved from HDDs to SSDs, with SSD penetration rising from about 50% to above 90%. Client SSD bit demand grew by more than 34% for three straight years from 2019 to 2021.
- Enterprise SSD deployments expanded as cloud companies accelerated SSD adoption in servers.
That changed in 2022 and 2023, when demand growth dropped to just 6% to 8%.
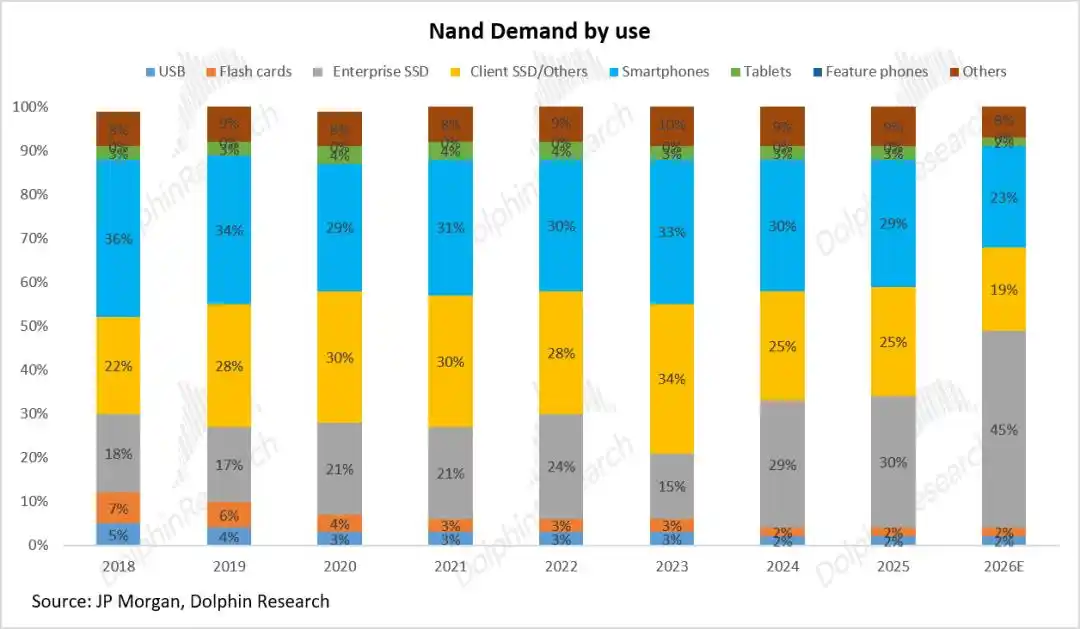
The first drag came from smartphones. The report says handsets were the largest single end market in 2023, accounting for about 33% of bit demand. Inflation, higher interest rates, and replacement demand pulled forward during the pandemic hit the segment hard. Smartphone bit growth fell from 46% in 2021 to 2% in 2022.
The second drag came from PCs. After work-from-home demand pulled purchases forward in 2020 and 2021, global PC shipments fell 12% in 2022 and another 10% in 2023.
The third drag came from enterprise SSDs. Standard server investment peaked in 2021 and then entered a digestion phase. Enterprise SSD bit demand growth slowed from 34% to 20% in 2022 and turned to -33% in 2023. The report says AI servers had not yet created enough incremental demand that year to offset the decline.
The fourth factor was inventory. As all three major end markets destocked at the same time, supplier inventory rose from 6 weeks to 16 weeks. Dolphin Research says falling-price expectations reinforced the downturn: customers delayed purchases because they expected lower prices ahead, shifted to just-in-time ordering, and shrinking orders then pushed prices down further.
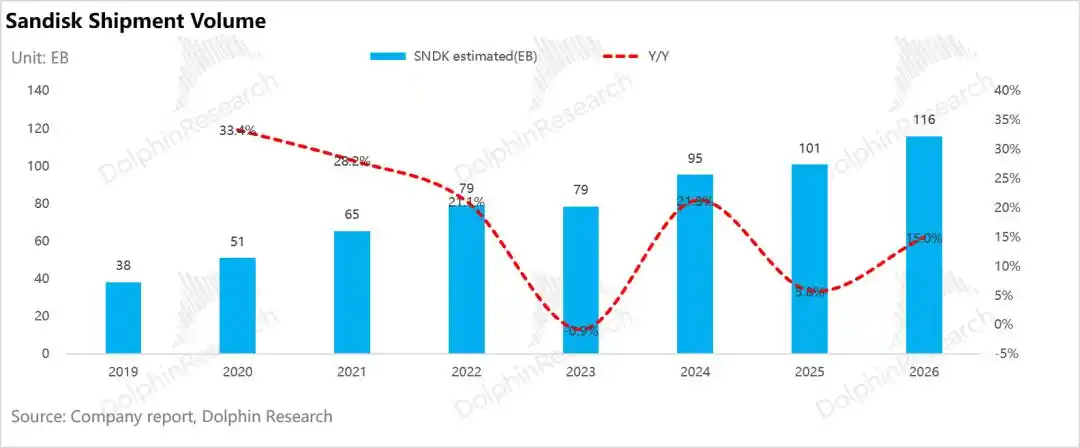
SanDisk’s 2023 performance was used as an example. Shipments were roughly flat, but ASP per GB and revenue both fell 37.8% year over year. Across the industry, revenue fell about 37% and ASP dropped 42% in the same year. The report’s conclusion is direct: the revenue decline was driven entirely by price, not by volume.
That sets NAND apart from traditional cyclical industries such as steel, chemicals, and shipping. In those sectors, downturns usually mean weaker demand, lower volumes, and lower prices at the same time, with production cuts helping stabilize pricing. In NAND, even in the worst year, output shipments did not really shrink while prices collapsed on their own.
Supply cuts were deep, but bit output still rose
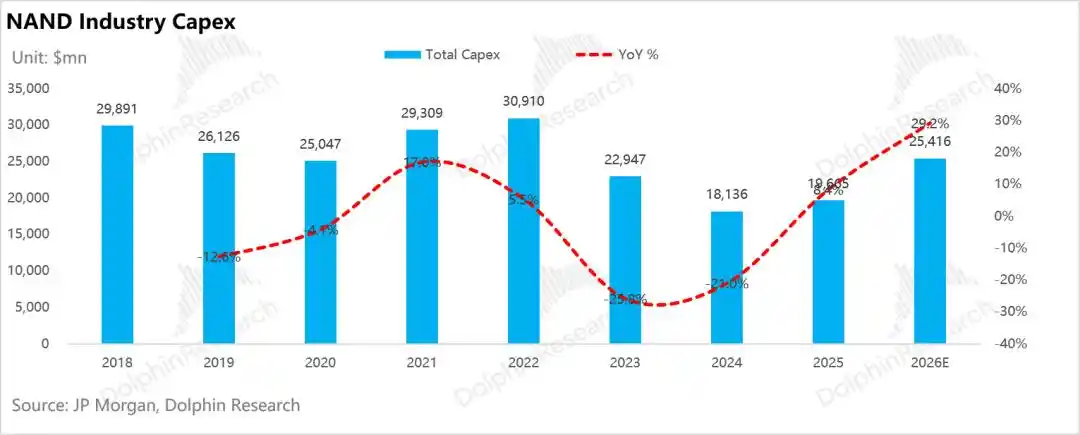
Dolphin Research says the industry did make aggressive supply-side adjustments. Capital spending fell from a peak of $30.9 billion in 2022 to a trough of $18.1 billion in 2024, a cumulative decline of 41% over two years.
NAND wafer starts also dropped sharply. From a peak of 1.78 million wafers per month in 2022, the figure fell to 1.27 million wafers per month in 2023, down 28.8% year over year. Citing SanDisk, the report says industry utilization at one point fell to about 70%, leaving roughly 500,000 wafers per month idle.
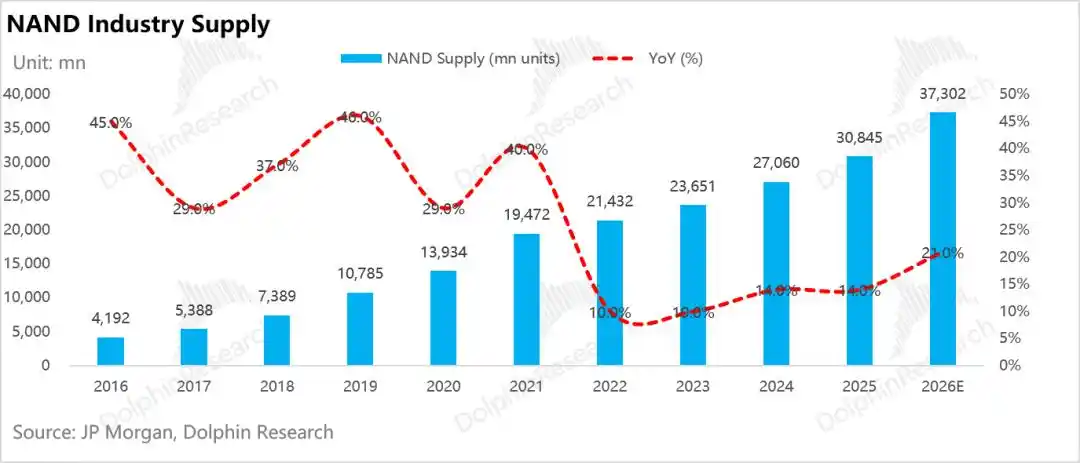
Even so, supply did not contract in absolute bit terms. The report says wafer starts fell about 29% in 2023, yet bit supply still grew about 10%. From 2016 to 2026, NAND bit supply never posted a negative annual growth rate, including in 2023 when industry revenue fell 37% and the sector as a whole was unprofitable.
The reason, it argues, is that node migration keeps lifting output per wafer. The gap between lower wafer starts and higher bit output, nearly 40 percentage points in opposite directions, came entirely from efficiency gains at newer nodes. In other words, NAND technology iteration itself keeps creating more supply.
Based on SanDisk’s disclosures, the five nodes from BiCS5 to BiCS11 delivered an average generational increase of 54% in bit output per wafer, equal to about 27% on a compounded annual basis. That is well above the industry’s long-term demand growth in the mid-to-high teens. Manufacturers can cut wafer starts, but they cannot cut the efficiency gains embedded in each wafer. That part of supply growth happens automatically.
What drives bit output per wafer
The report breaks bit output per wafer into four variables: storage-hole density, number of layers, storage-array area ratio, and bits per cell. It argues that logic scaling and architecture scaling are mostly one-off gains, while the durable engines of output growth are vertical stacking and lateral shrink.
Logic scaling from TLC to QLC is a step change, not a lasting engine
NAND stores information through threshold-voltage encoding. Moving from SLC to MLC, TLC, and then QLC raises capacity without increasing cell count or area, simply by storing more bits in each cell.
But the trade-offs are clear. QLC must distinguish 16 threshold levels, versus 8 for TLC. That cuts noise tolerance in half, slows writes, and reduces endurance to roughly one-third of TLC. The next step, PLC, would be weaker still, and SanDisk has not provided a timetable for it.
The report also says this lever cannot fully support long-term industry growth. SanDisk positions TLC for high-performance compute-oriented eSSDs, carrying data in KV cache that is not accessed at the highest frequency, while QLC is aimed at high-capacity storage-oriented eSSDs for data used less often.
SanDisk estimates AI data center flash TAM will reach 1.2 ZB by 2030, equivalent to total global shipments in 2026. Of that, 66% would still be TLC and 34% QLC. Even in that scenario, about two-thirds of bit demand would remain in TLC five years from now.
CBA offers limited density upside, but meaningful performance gains
The report spends considerable time on CBA, or CMOS bonded on Array, where logic and memory arrays are directly bonded through copper-to-copper connections. From a density perspective, Dolphin Research says CBA is basically a one-time recovery of space previously occupied by peripheral logic.
A NAND die contains both the storage array and peripheral CMOS logic that does not store data. The architecture trend has been to remove that inefficient area step by step: first placing logic beside the array, then underneath it, and later separating logic and array onto different wafers before bonding them together.
There is, however, a hard ceiling to the space recovery. If logic originally took 20% of the area and the array 80%, moving logic out entirely would raise array occupancy to 100%, which means a 25% density gain and no more room to recover after that. The report notes that a similar architecture at YMTC once delivered about a 25% area reduction, equivalent to roughly 33% higher density.
For SanDisk, though, the bigger value of CBA is performance rather than density. Once logic and memory are built separately, the CMOS logic can use a more advanced process node, which improves I/O speed and lowers power consumption.
The report says that compared with a BiCS8 2Tb QLC part of the same specification, BiCS9 achieved 150% higher write bandwidth and 75% higher read bandwidth simply by moving the logic to a more advanced process. Write and read energy efficiency improved 85% and 40%, respectively, with very little incremental capital spending. Dolphin Research also says the hybrid bonding and multi-wafer stacking behind CBA form the process base for HBF, with the first-generation HBF array built on SanDisk’s first CBA node, BiCS8.
Vertical scaling still works, but the economic ceiling is getting closer
3D vertical stacking remains the most direct path to higher capacity, and manufacturers continue to treat layer count as a core strategy. The report says there is no single hard physical ceiling, but hidden costs and capital requirements are rising quickly because of four constraints.
- As layer counts rise, etch and deposition steps multiply. With fixed equipment, processing time per wafer gets longer and monthly wafer capacity falls. Moving from 176 layers to above 300 layers can raise capacity per die by 50% to 60%, but actual bit output does not increase by that much because the process takes longer.
- Because of aspect-ratio limits in channel etching, a single formation step can stack only about 120 to 150 layers. Beyond that, manufacturers need multi-deck structures and must repeat etch, contact, and fill steps.
- At around 300 layers, traditional tungsten wiring faces sharply higher resistance and leakage, forcing a shift to molybdenum. The report says that nearly doubles deposition and etch equipment investment per 10,000 wafers of monthly capacity.
- Beyond 500 layers, oxide materials become more prone to deformation. Further stacking would require wafer bonding more like HBM, sharply increasing complexity.
That is why the report says any move beyond 500 layers will depend on bonding capability, an area where Kioxia and SanDisk have accumulated experience since mass-producing BiCS8.
Lateral scaling is where SanDisk and Kioxia stand out
Dolphin Research argues that lateral scaling, shrinking storage-hole diameter and tightening block spacing, is the most differentiated engine in NAND. Samsung and SK hynix have leaned more on adding layers, while Kioxia and SanDisk have focused on packing cells more tightly in the planar dimension and optimizing the arrangement of different functional blocks.
The result, according to the report, is that Kioxia and SanDisk achieved the industry’s highest density at 229 GB/cm² with only 218 layers, the fewest in the field. Density contribution per layer was 29% higher than the next-best competitor. Die size was also the smallest at 55.9 mm², 16% smaller than Samsung’s, allowing about 19% more dies to be cut from the same wafer. Fewer layers did not mean weaker density or weaker performance.
The difference between the two strategies shows up in capital intensity. Samsung and SK hynix use more process steps and more equipment to lead on layer count. Kioxia and SanDisk reach higher density with fewer layers and therefore consume fewer steps and fewer tools. The report says that in 2025, the industry average capital spending required for each incremental PB of output was 2.66 times that of the SanDisk-Kioxia joint venture system. From 2021 to 2025, the pair generated 29% of industry bit output with only 13% of industry capital investment.
DRAM and NAND expand supply under very different rules
The report then turns to DRAM and says the two memory markets follow different supply logics at the most basic level. This is not mainly a matter of strategy. It comes from physical structure, and it feeds directly into differences in capital intensity and cyclicality.
There are only two ways to expand supply: improve process technology so each wafer carries more bits, or increase wafer starts by building clean rooms and adding equipment. The first path is much less capital-intensive than the second.
How much node migration can deliver depends on how much more density can still be extracted, and there are only two directions: stack upward or shrink laterally. NAND can do both. DDR memory is left with only the lateral path because each cell contains not just a transistor but also a deep trench capacitor, which prevents the kind of low-cost multi-layer penetration that NAND uses.
That sets the ceiling for migration gains. The report says DDR density improves by only about 10% per generation, and the move from 1b to 1c is already below 10%. NAND still delivers 50% to 60% per generation. As a result, DDR can raise bit output per wafer by only about 5% to 10% a year through migration, not enough to cover demand. The gap has to be filled with new clean rooms. NAND is the opposite: migration alone can meet or even exceed demand growth.
Why DRAM cannot stack the way NAND does
NAND’s 3D model works through batch formation and serial sharing
Dolphin Research says NAND cells are conductive transistors. Hundreds of them can be connected in series along the same vertical channel and share one bit line. To read one layer, the non-target layers are given pass voltage so they behave like wires, allowing current to reach the target cell.
Manufacturing follows the same logic. 3D NAND is built more like a single batch process: hundreds of oxide and nitride layers are deposited in alternation, then a high-aspect-ratio etch cuts through the full stack in one step, and channel material is filled in. Hundreds of cells are formed at once. The report describes NAND cells as something that are not individually built but created through crossing structures. One channel hole through 300 layers creates 300 cells at the same time.
That matters because the extra cost from adding layers comes mainly from deposition, which is repetitive and relatively cheap. The expensive lithography and etch steps do not increase in proportion to layer count.
DRAM is constrained by two-dimensional scaling, and HBM widens the gap
DRAM is different. Each cell uses a one-transistor, one-capacitor structure, or 1T1C. The capacitor blocks direct current, so DRAM cannot replicate NAND’s serial structure. The report compares it to a wall that current cannot pass through.
DRAM also serves as CPU working memory and must access arbitrary addresses with latency measured in tens of nanoseconds. It cannot spread overhead across large page or block transfers the way NAND can. That means it cannot share bit lines vertically. Every added layer would need its own routing from the bottom.
As lateral shrink slows, HBM has made the capacity gap even larger. The report says HBM is designed to pack more capacity and bandwidth into limited package area, but its stacking model is fundamentally different from NAND’s. NAND is like building 300 to 400 floors on one shared foundation. HBM is like stacking separate houses, each with its own foundation, one on top of another. Every layer must be built, drilled, and aligned separately, which raises both cost and wafer consumption.
The report lists three ways HBM amplifies wafer demand:
- Larger dies. TSVs and complex I/O circuits require keep-out zones, reducing usable memory area and making die size much larger than standard DDR at the same capacity.
- More dies per stack. A single HBM package usually stacks 8 to 16 dies.
- Lower composite yield. Even if individual die yields are high, cutting and bonding losses reduce overall yield after stacking.
Taken together, the report says producing the same number of bits in HBM consumes about two to three times as much wafer capacity as standard DDR.
That helps explain why DRAM and NAND are seeing almost opposite investment patterns from 2024 to 2026. HBM’s share of global DRAM wafer capacity is expected to rise from 7% in 2023 to 23% in 2026. Absolute HBM capacity is projected to increase from 100,000 wafers per month to 470,000 wafers per month over the same period, more than tripling in three years.
HBM is also much less efficient in wafer terms than standard DRAM. One wafer can produce about 1,500 to 1,800 DDR dies, but only about 500 to 600 HBM dies, according to the report. Once 8 to 16 layers per stack and yield losses are included, effective bit output efficiency falls further. Every increase in HBM penetration effectively squeezes standard DRAM capacity.
That is why DRAM capital spending keeps climbing. The report says DRAM capex rises from $30.8 billion in 2023 to an estimated $99.8 billion in 2026, with annual growth of 68%. Global DRAM capacity, after falling 13% in 2023, expands from 1.4 million wafers per month to an estimated 2.02 million wafers per month in 2026, 25% above the 2022 peak.
NAND looks very different. Although NAND capex recovers from a 2024 trough of $19.7 billion, rising 21% in 2025 and 29% in 2026, the 2026 figure of $25.4 billion is still about 18% below the 2022 peak. In 2026, the report says, DRAM industry capex is about $99.8 billion while NAND capex is only about $25.4 billion, leaving DRAM close to four times larger.
On a capital-intensity basis, the gap is also clear. DRAM capex-to-revenue is projected at 16% in 2026, versus 7% for NAND. The report says that is consistent with SanDisk’s own long-term guidance for capex in the low-to-mid single digits as a share of revenue.
Same memory family, different business outcomes
The report closes by arguing that the physical differences between DRAM and NAND ultimately create different business destinies.
First, the direction of the cycle is asymmetric. NAND suffers more severe downturns because migration automatically adds supply. Even when capex is cut sharply, bit output per wafer keeps rising as layer counts increase, and the 3D transition once created a one-time jump that pushed supply growth well above demand. DRAM downturns are milder by comparison because migration gains are slowing and remain below demand. Since expansion depends heavily on new clean rooms, cutting capex can tighten supply more quickly in physical terms.
Second, the foundation of pricing power is different. DRAM, especially HBM, is tight because of real physical capacity limits and high manufacturing complexity. That gives suppliers stronger pricing power. TSV and advanced bonding also create product differentiation, pushing the three major producers to allocate more capacity to HBM and making standard DDR tighter as a result.
NAND, by contrast, depends much more on industry discipline. The report says SanDisk has deliberately targeted industry bit growth at around 15%, rather than the more aggressive 30% plus seen in the past. That implies a large amount of technical capacity still exists inside the industry and could be released without major new capex. If that discipline weakens, or if Chinese manufacturers accelerate expansion, oversupply could return quickly.
Third, cash flow and capital returns diverge. Dolphin Research says NAND is turning into more of a cash-generating business. DRAM producers must keep recycling operating cash flow into heavy capital investment, with a new advanced fab now costing more than $20 billion. NAND capex, by contrast, is directed mainly toward node upgrades on existing lines rather than outright capacity expansion.
Using SanDisk as the example again, the report says the company’s long-term guidance points to capex in the low-to-mid single digits as a share of revenue, adjusted free cash flow margin of about 50%, and 100% of excess cash returned to shareholders through buybacks. It also notes that SK hynix announced a KRW 40 trillion buyback in August 2026, showing that DRAM makers are also increasing shareholder returns. Even so, the report says DRAM’s structurally higher capital intensity means its cash generation in a supercycle still cannot match a lighter-asset NAND model.
What the report says to watch next
Dolphin Research ends by saying the next phase for NAND depends on two variables. One is whether other producers maintain the current supply discipline or choose to expand NAND output again. The other is how durable AI-driven NAND demand proves to be.
The report says its next installment will examine whether other manufacturers are truly staying restrained on NAND expansion, how downstream demand may be reshaped structurally, how long the current price rally can last, and whether SanDisk still has upside at current valuation levels after its turnaround.
The article was originally published via the WeChat account Haitun Touyan, with authorship credited to Dolphin Jun.