

Crypto perpetual futures do not close, but a paper discussed by MarsBit argues that they still behave as if they have recurring opening bells. Researchers Chan Kim, a policy researcher in South Korea, and Peter Reinhard Hansen of the University of North Carolina examined tick-level Binance data from Jan. 1, 2021, through Oct. 31, 2024, covering 1,400 full uninterrupted trading days across six perpetual contracts: Bitcoin, Ether, XRP, Solana, Dogecoin and Cardano.
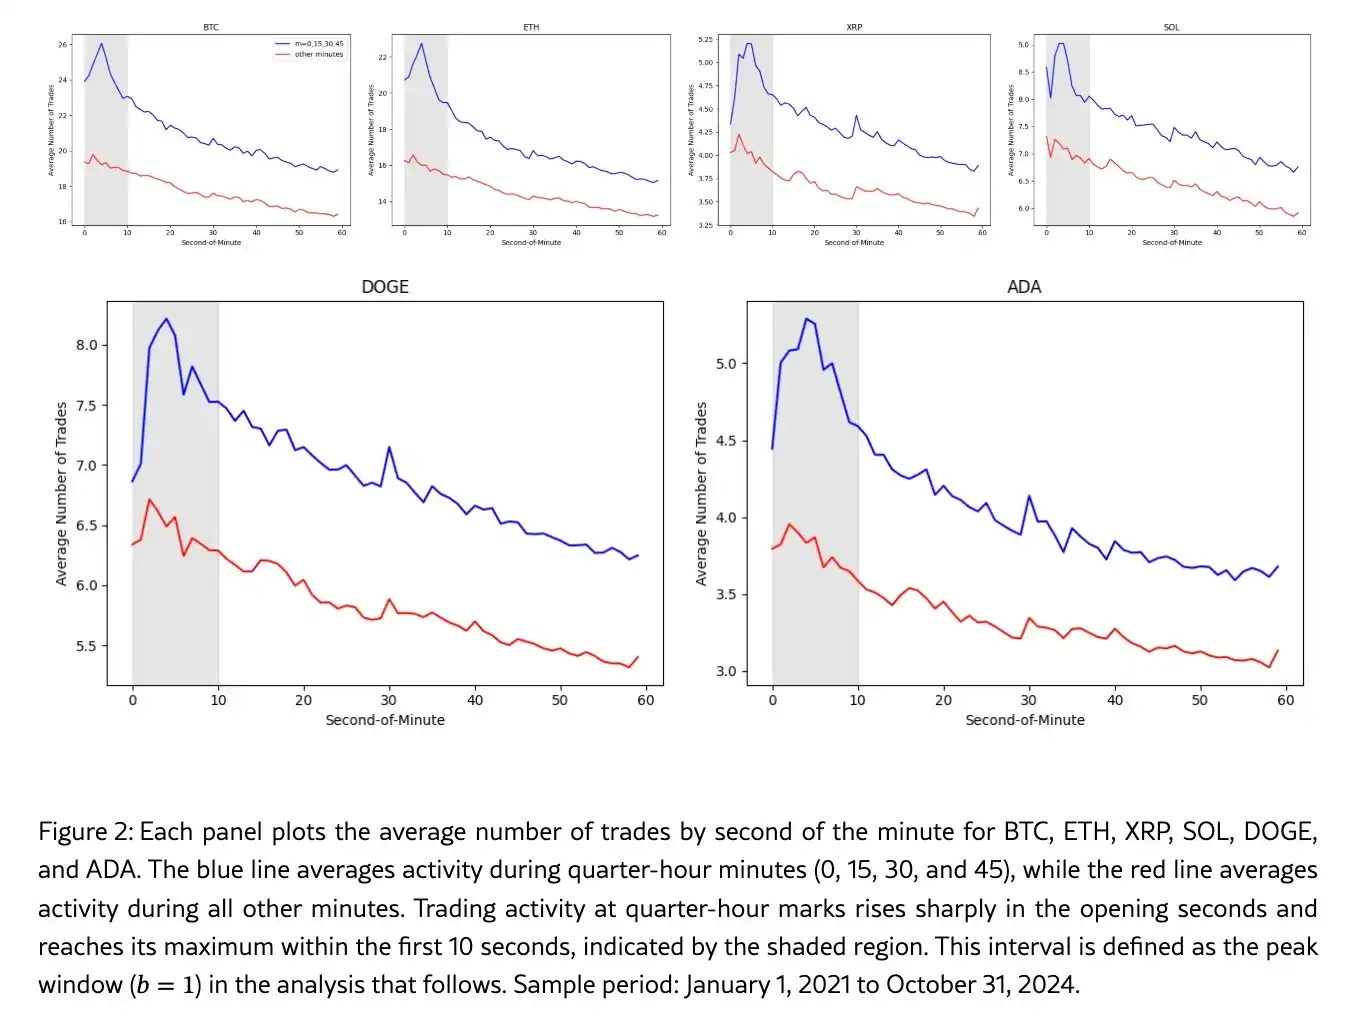
The paper describes a sharp shift when the clock rolls from UTC 14:59:59 to 15:00:00. In the final second before the boundary, Bitcoin perpetuals trade continuously like any other electronic market. Once the new interval starts, order flow jumps, positions turn over faster and price swings widen during the next 10 seconds, even without a fresh headline driving the move.
Recurring bursts at 0, 15, 30 and 45 minutes
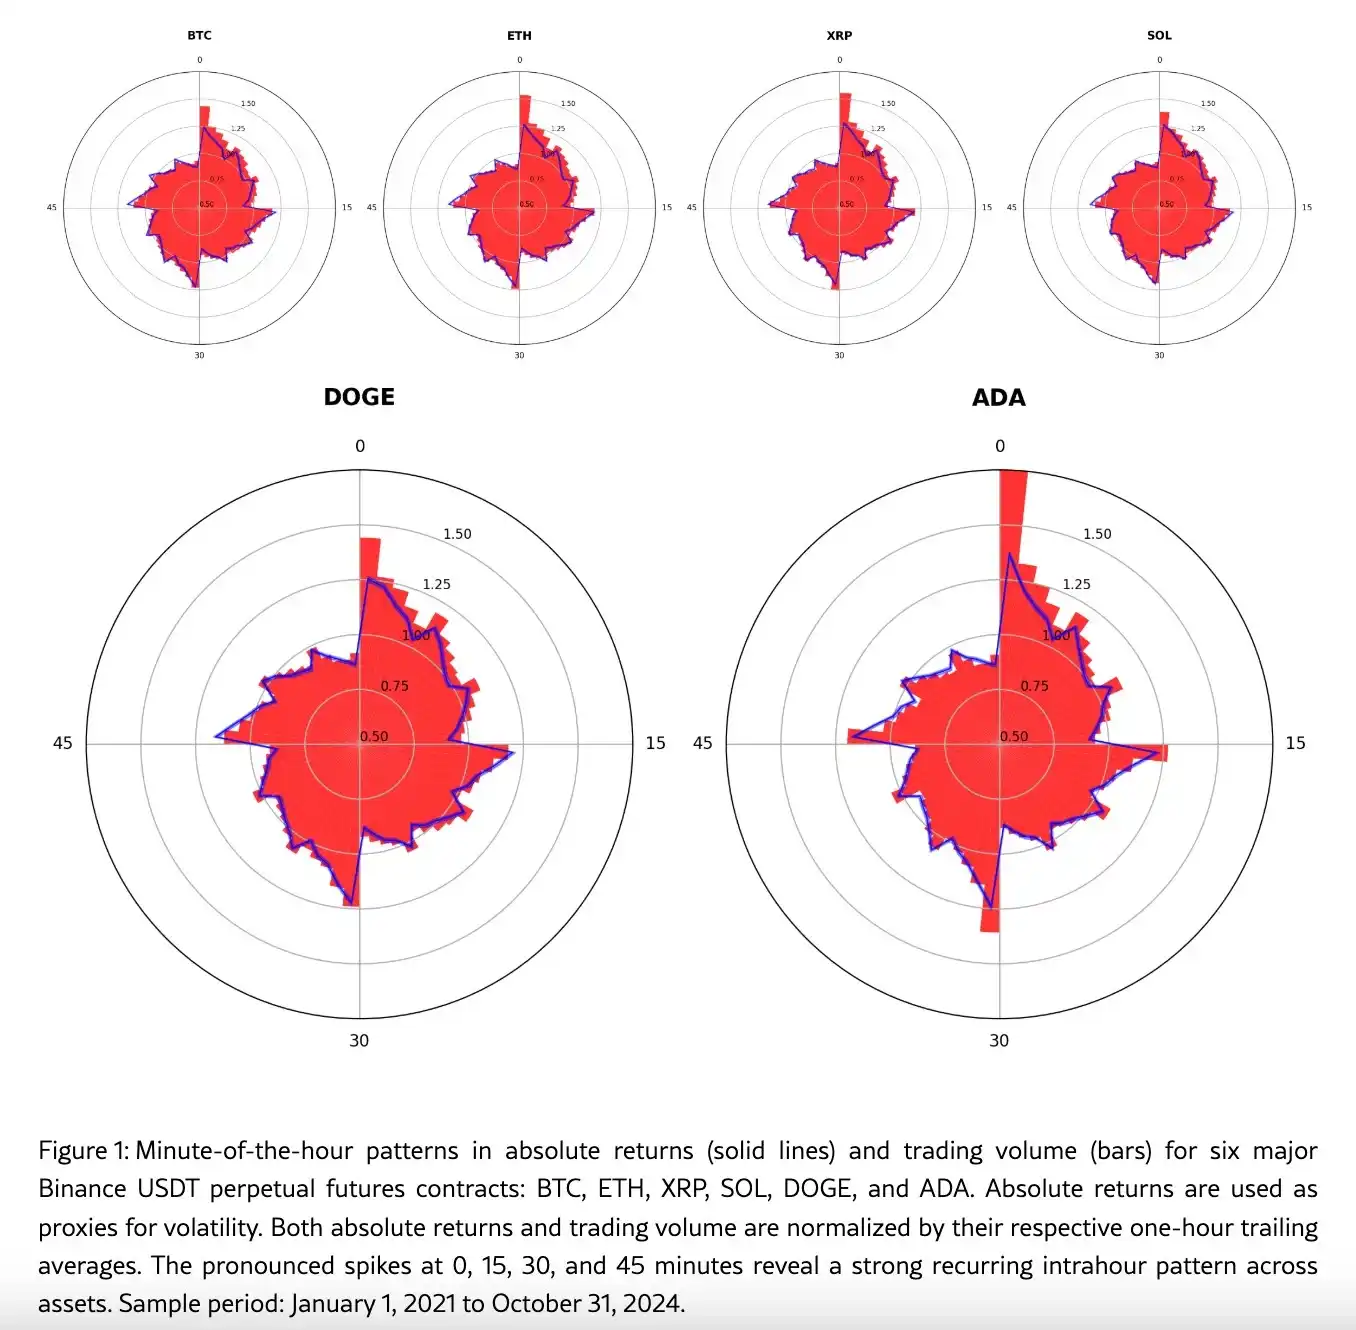
According to the paper, the same pulse appears every hour at minute 15, 30 and 45. Smaller versions show up at five-minute boundaries and at the start of each minute, while the top of the hour produces the strongest burst. In that sense, software carves a continuous crypto market into a large number of miniature trading sessions.
The study focuses on perpetual futures, which let traders bet on price moves with leverage. Unlike traditional futures, perpetuals do not expire as long as margin remains sufficient. Long and short holders exchange funding payments so contract prices stay close to spot indexes. When the perpetual price trades above the spot index, longs pay shorts; when it trades below, shorts pay longs.
Because perpetuals account for a large share of global crypto trading, the paper says these short pulses matter beyond derivatives alone. Perpetual prices help guide cross-exchange arbitrage, hedging and market making, so volatility that appears in futures can spill into spot trading for Bitcoin and other assets.
Most of the action is packed into 10 seconds
The researchers say the pattern becomes obvious when an hour is plotted on a circular chart. Peaks form at minute 0, 15, 30 and 45, and both trading volume and price movement take on a star-like distribution. Most of the jump is concentrated in the first 10 seconds after each interval begins.
Across the six contracts, trade count in that 10-second window was 26% above ordinary periods, dollar-denominated volume rose 32% and absolute price movement increased 26%. The paper uses absolute returns to measure two-way movement, so the effect covers both upside and downside swings.
The pattern holds across assets with very different trading scales. During the sample period, Bitcoin averaged 1.54 million trades a day and $14.58 billion in contract volume. Cardano averaged roughly 290,000 trades a day and $544 million in volume. Even so, the two showed highly similar trading rhythms. The paper treats that cross-token consistency as one of its central findings, arguing that the effect comes from market-wide trading mechanisms rather than a feature unique to one coin.
Shared candlestick intervals turn time marks into market structure
The paper links the effect to common timing conventions across trading software and automated systems. Most platforms convert continuous price feeds into standard candlestick intervals such as one minute, five minutes and 15 minutes. A 15-minute candle compresses the open, close, high and low of that period. That format helps human traders read the market and gives systematic strategies a standardized data block.
When each candle closes, technical indicators are recalculated and automated strategies refresh their orders from the newly completed bar. Order-splitting algorithms can send the remainder of an execution schedule at the boundary. Market makers can reprice quotes based on expected flows. Faster quantitative systems may position ahead of that shift.
The paper’s argument is straightforward: once enough programs share the same clock, the timing convention stops being a display tool and becomes part of the market itself. Traditional exchanges get a burst of orders at the opening bell because traders queue during the market’s closure. Crypto does not close, yet standardized candle intervals and software defaults appear to recreate that effect every 15 minutes.
Order-size patterns point to heavier automated participation
Binance trade records show the asset, size and price of each fill, but they do not identify whether an order came from a human trader, a market maker, a liquidation engine or another automated system. Kim and Hansen therefore looked for indirect clues in order size.
The paper says human traders tend to prefer round sizes and prices, such as 0.1 BTC or roughly $10,000 notional. Quantitative systems usually size orders from variables such as volatility, available capital, current exposure or the target of an order-splitting program, so the final numbers often look irregular from a human point of view.
The researchers measured how often order values ended in zeros and found that the share of round-number orders dropped noticeably in the first few seconds of the pulse. To reduce distortions from minimum order sizes on the exchange, they limited the sample to large enough trades, so very small orders would not be misclassified as non-human activity.
The drop became larger at more important time marks. It was small at ordinary minute starts, larger at five-minute boundaries, larger again at 15-minute boundaries and strongest at the top of the hour. For Bitcoin orders meeting the paper’s double-zero condition, the share of round-number orders deviated by 0.04 standard deviations from normal at a regular minute open, and by 0.20 at the top of the hour, a fivefold increase.
The paper does not equate that standard-deviation figure with the share of machine orders. It says only that when activity jumps, the market becomes less likely to submit round-number orders, which is consistent with greater automated participation.
The authors also note that order-size evidence alone cannot identify the source of every trade. Large institutional execution, forced liquidations and funding-rate arbitrage can also produce irregular sizes. For that reason, the paper treats the order-size pattern as indirect support rather than direct proof.
The effect remains after funding windows are removed
The authors ran a set of controls to test whether other periodic events were driving the pattern. During the sample period, Binance settled funding at UTC 0:00, 8:00 and 16:00. After removing those windows, the 15-minute pulse remained significant. Even after excluding all top-of-the-hour observations, the patterns at minute 15, 30 and 45 were still present.
The researchers also ran a separate analysis on Bybit data and reported highly similar results. They conclude that the behavior reflects a broad form of electronic coordination. Traders can in theory choose any time interval, but exchange data feeds, chart settings and widely used technical indicators pull many systems toward the same boundaries. The most watched moments — the top of the hour and the quarter-hour marks — end up attracting the most concentrated flows.
A predictable signal, but too small to beat fees
After documenting the periodic pulse, the research team tested whether market data from before a 15-minute boundary could predict the direction of the next 10-second move. Their rolling forecast model used prior 15-minute returns together with standard price-and-volume indicators, relying only on information available at the time and evaluating results out of sample.
Across the six contracts, the backtests produced 56.6% directional accuracy. The average out-of-sample R-squared was 3.4%, which means the model explained only a small part of the variation in those 10-second returns. The area under the curve score was 0.60, where 0.5 represents random guessing and 1.0 represents perfect prediction.
In a noisy market measured in 10-second increments, the paper says those numbers still show a repeatable signal. But the edge was too small to turn into a simple profitable strategy. If a trader followed the model at every 15-minute boundary, the average gross return per trade before fees was only 0.51 basis points, or 0.0051%. On a $10,000 position, that works out to roughly $0.51 in gross profit.
During the sample period, Binance’s stated base taker fee was 5 basis points and the maker fee was 2 basis points. A $10,000 taker order would cost about $5 to open, with another fee due on the exit. The model’s average gross profit was less than one-tenth of the opening taker fee alone.
The paper says that gap is one of the main lessons from the dataset. Statistical predictability and practically capturable profit are not the same thing. A pattern can survive repeated testing and still fail to cover basic trading costs. That helps explain why recognizable short-term structures can exist in highly automated markets without offering easy arbitrage.
Possible implications for execution and longer-horizon signals
The authors say market makers and large institutions could still use the findings to refine execution. Liquidity providers posting two-sided quotes might widen spreads during the 10-second burst window and cut displayed size when one-way flow looks likely. Institutions executing large split orders could avoid crowded time marks to reduce slippage created by their own activity.
The paper also says the first 10 seconds of a 15-minute window may contain information for longer horizons. If aggressive buy volume exceeds aggressive sell volume during that quarter-hour boundary, that order imbalance often continues to push prices higher over the next four to 12 hours. If selling dominates, medium-term prices tend to face pressure.
Order imbalance here means the difference between aggressive buy and aggressive sell volume relative to total volume in that window, a way to gauge which side is applying stronger pressure. The paper says the four-hour horizon picks up much of the earlier signal from quarter-hour fund flows, while traditional price-and-volume indicators become more explanatory at eight-hour and 12-hour horizons. That fits the idea that quantitative systems use the 15-minute mark as a shared signal boundary.
The authors still urge caution with that longer-horizon result. The return windows at four, eight and 12 hours overlap, so the same large move can appear repeatedly in several groups of observations. Although the paper used a block bootstrap method suited to non-independent data, the aggregated trade record still cannot show whether orders contained private information, whether multiple orders reacted to the same public news, or whether the move simply reflected market makers absorbing a large one-way trade.
The broader point is simple. Crypto removed the closing bell and runs all day. At the same time, APIs, candle intervals and automated strategies have built countless miniature opening moments back into the market. Every 15 minutes, thousands of independent programs arrive at the same time boundary, and for a few seconds a nonstop market behaves as if a crowd is trying to pass through a single door.