
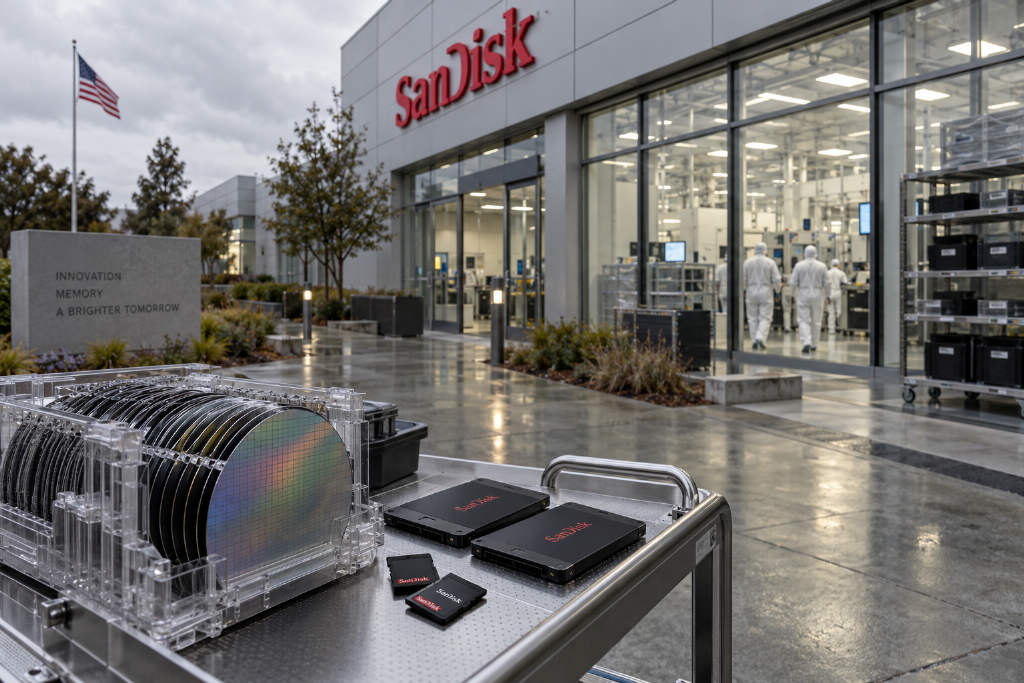
Dolphin Research author Dolphin Jun said in a new note on the NAND market and SanDisk that the key questions are how long the current pricing surge can last and whether SanDisk still has room to rise from current valuation levels after its recovery.

The piece extends the author’s earlier argument that AI inference is changing the role of NAND. Under the shift from training to inference and the rise of long-context workloads, NAND is no longer treated as a peripheral data warehouse. It is moving into the compute path itself, with SSDs described in the report as a kind of “token battery” for storage compute.
A rare pricing cycle for memory
Dolphin Jun describes the current move as a once-in-decades “super cycle” for storage. Since July 2025, spot prices for DDR4 8Gb have climbed 7x to 8x, from about $4.5 to about $35. Spot pricing for 256Gb TLC NAND also jumped sharply, from about $2.5 to about $14, or roughly 5x to 6x the starting level.
Against that backdrop, the author estimates SanDisk’s blended ASP for fiscal 2026, which ended in June 2026, at about $0.17/GB, up about 139% year over year. That still lagged the spot move by a wide margin, mainly because price increases were muted in the first half of the fiscal year, SanDisk had a relatively high share of long-term contracts, and the data-center mix did not rise to 25% and 33% until FY26Q3 and FY26Q4.
On a quarterly basis, FY26Q4 ASP is estimated at about $0.31/GB, up about 340% from a year earlier and nearly in line with spot pricing of about $0.33 to $0.34/GB in the same period.
SanDisk’s FY26Q4 revenue is estimated at about $9 billion, up 372% year over year. According to the note, almost all of that increase came from pricing, as bit shipments rose only about 7% to 29EB.
By segment, data center was the fastest-growing business. FY26Q4 revenue there reached about $3 billion, up about 13x from a year earlier, and its share of total revenue rose from 11% to 33%. In AI use cases, the main driver was performance TLC eSSD used for KV cache, high-performance computing, and other inference workloads. On the capacity side, UltraQLC high-capacity eSSD products starting at 128TB were being qualified by multiple hyperscale customers and began shipping and recognizing revenue in FY26Q4, covering April to June 2026. A 256TB version is expected in the second half of 2027.
Gross margin, meanwhile, rose from a low of 22.5% in FY25Q3, covering January to March 2025, to 84.6% in FY26Q4. The report says the jump was driven almost entirely by higher pricing.
Supply: more bits from technology migration than from new fabs
To judge how long the upcycle can continue, Dolphin Jun starts with supply. The argument is that even with AI demand breaking out, NAND producers have stayed disciplined on capital spending after the last deep loss cycle.
The note says memory makers are increasing capex, but most of the money is going to DRAM and HBM. By 2028, DRAM/HBM capex is projected at $162.7 billion, implying a three-year compound annual growth rate of 39%. NAND spending, by contrast, is expected to reach only $38 billion by 2028, with a three-year CAGR of 25%, and its share of global memory capex is projected to fall from 25% in 2025 to 19%.

Dolphin Jun says overseas manufacturers have changed their expansion strategy. In 2026 and 2027, clean-room constraints limit large-scale new capacity builds, so capex is going mainly into upgrades of existing lines. The core path is higher 3D stacking, moving toward 200+ and 300+ layers, along with more bits per cell and architectural optimization to raise bit output per wafer.
New wafer fabs are expected to come online in a more concentrated way starting in 2028, but even then most of the new capacity is still set to favor DRAM and HBM. Large-scale NAND capacity additions are not expected until after 2029. Compared with building a new fab, improving wafer density costs less and moves faster. Large equipment swaps usually take three to six months, with a temporary dip in output, versus two to three years for a new fab.
Most near-term additions come from China
On wafer starts, the report estimates global NAND monthly capacity at about 1.26 million wafers in 2025, rising only to 1.5 million by 2028, a three-year CAGR of about 6%. Of the additional 240,000 wafers, YMTC contributes about 150,000, lifting its share from 12% to 20%. Samsung’s physical capacity is projected to show zero growth, with its share slipping from 31% to 26%.
The timing and geography of new lines are staggered. From the second half of 2026 through 2028, the main new supply comes from YMTC Fab 3 and SK hynix Dalian Fab 2. Overseas, there are almost no major new fabs entering production, with only limited output from Micron’s Singapore fab at the end of 2028. The note calls 2027 to 2028 the period of weakest supply elasticity for overseas producers, with bit growth heavily dependent on layer migration.
From 2029 onward, large projects including Samsung P5, the Kioxia-SanDisk Kitakami North fab, and SK hynix M17 are expected to come online in a concentrated wave. That could lift supply growth materially, and the report says project progress and long-term agreement signings will need close tracking.
Company-by-company expansion paths
For YMTC, Dolphin Jun expects capacity to rise from an estimated 200,000 wafers per month in 2026 to 300,000 in 2028. Fab 1 and Fab 2 are already running at full utilization at about 200,000 wafers per month combined. The key increment is Fab 3, designed for 100,000 wafers per month, which is expected to start production at the end of 2026 and reach 50,000 wafers per month in 2027. Its Xtacking 4.0 architecture can support 1Tb TLC and 2Tb QLC products for both enterprise and consumer demand. Fab 3 will move directly to 294-layer products, with enterprise SSD targeted to account for 60% of output. The note also says land for Fab 4 and Fab 5 has been approved, each with a designed capacity of 100,000 wafers per month, leaving room for upside to 2028 supply if construction starts early.
On technology, YMTC has already mass-produced 232-layer products, while 294-layer Xtacking 4.0 entered mass production in 2025 and 300+ layer products are under development. The report says copper-to-copper wafer bonding is becoming the common route once the industry moves into 400+ layers. Samsung is using W2W bonding for its next-generation V-NAND at around 430 layers, with V10 already in mass production at 400 layers. Kioxia and SanDisk use CBA in both their eighth- and tenth-generation products. SK hynix has also confirmed wafer bonding for V10, with mass production planned at Cheongju M15 before the end of 2026. As the first company to pioneer this route, YMTC is described as having a first-mover edge.
For Samsung, the note says nearly all NAND capex is going into technology migration. Monthly capacity stays around 395,000 wafers, and some 2026 output has already moved above 286 layers. After work resumes at Pyeongtaek P5, DRAM gets priority. NAND output there is not expected before 2029 at the earliest, and the pace will depend on LTA negotiations.
SK hynix gets its near-term increment from the Dalian Fab 2 expansion, adding 50,000 wafers per month and expected to enter mass production in the first half of 2027. Longer term, the company is waiting for the new M17 fab in Cheongju, a $13.5 billion project scheduled to start construction in 2027 and expected to contribute little meaningful output before the end of 2028.

Kioxia and SanDisk are projected to lift capacity only from about 390,000 wafers to 440,000 over the next three years, but the report says they have the largest room for technology migration. In 2026, about 80% of output is still expected to sit at 192 layers or below. Their Kitakami North fab, with investment of more than $6.3 billion, is not expected to start production until after 2029.
Micron is treated as the only overseas incremental variable in 2028. Its total capacity is projected to rise from 100,000 wafers to 120,000. The new Singapore fab, using a process above 500 layers, is scheduled to start production at the end of 2028 and contribute only about 20,000 wafers per month that year.
Most supply growth comes from higher output per wafer
Dolphin Jun estimates average global NAND output per wafer at about 65TB in 2025. As the industry moves beyond 300 layers, with Kioxia/SanDisk BiCS10 at 332 layers and SK hynix pushing 321 layers, output per wafer is expected to rise to about 104TB by 2028, a three-year CAGR of about 17%.
On that basis, the report estimates NAND supply at about 1,228EB in 2026, 1,525EB in 2027, and 1,868EB in 2028, for a CAGR of about 24%. Roughly 73% of the incremental supply comes from higher output per wafer, while only 27% comes from more wafer capacity. The report sums that up as “trading technology for capacity.”
Migration room differs sharply by producer. Kioxia and SanDisk are moving from 218-layer BiCS8 to 332-layer BiCS10. BiCS10 was sampled in July 2026 and is expected to enter mass production in the middle to second half of 2027, with bit density 59% higher than the eighth generation. Samsung is moving from 286-layer V9 to around 400-layer V10 and is expected to go beyond 600 layers starting in 2027. YMTC Fab 3 is bringing in 294-layer products and phasing out 128-layer output, which means much higher output per wafer than older lines.
The report also flags risks on both sides. Upside risk to supply comes from earlier-than-expected YMTC capacity and faster migration at Kioxia and SanDisk, where about 80% of bits are still below 192 layers. Downside risk to supply comes from demand: if pSLC or SLC products for AI inference staging enter large-scale production in 2027 and 2028, they consume three times the capacity of ordinary SSDs and would tighten industry supply materially.
Demand: AI takes over from smartphones and PCs
On the demand side, Dolphin Jun says the extreme supply-demand mismatch gives NAND a chance to use deposits, prepayments, and long-term agreements to smooth cyclicality, instead of relying on the old model of short orders, locked volume without locked pricing, and low penalties for breach.
Still, the report says this is more a super cycle than a fundamental change in industry structure or competitive barriers. Using SanDisk’s NBM agreement as an example, the note says financial guarantees cover only about 18% of minimum revenue, with the rest still highly dependent on customer credit. If spot prices fall sharply, renegotiation risk remains.
That leaves the core valuation question tied to how long the mismatch lasts. Supply growth is relatively visible. Demand elasticity is the bigger variable.
Data centers become the largest end market in 2026
The report calls 2026 a structural turning point. Data-center demand is estimated at about 670EB, taking total NAND demand above the 50% mark for the first time and overtaking smartphones and PCs as the largest downstream market. Over the past decade, NAND demand was driven mainly by replacement cycles in phones and PCs. Going forward, the report says AI capex will be the main force shaping industry supply and demand.

Dolphin Jun breaks AI server NAND demand into three scenarios: high-write staging for temporary data, KV cache spilling from HBM to NAND during inference, and data lakes for multimodal data. The bottom-up formula used in the note is: total AI NAND demand = (ASIC + GPU + CPU racks + China CSP + QLC data lakes) × (1 + CSP inventory buffer).
The method starts with TSMC CoWoS capacity to estimate shipments of different AI chips, converts that into tray counts based on four chips per compute tray, and then multiplies by eSSD capacity per tray. Storage configurations vary widely by vendor, depending on chip architecture, onboard HBM or DRAM, and whether compute and storage are separated.
NVIDIA: Rubin-era storage cabinets become the biggest increment
For NVIDIA, the report says the memory hierarchy is the deepest. Using Vera Rubin NVL72 as an example, a single rack includes 20.7TB of HBM, calculated as 72 Rubin chips times 288GB, and 54TB of LPDDR5X, calculated as 36 Vera CPUs. That absorbs much of the KV cache pressure in memory before it reaches storage.
As a result, NVIDIA’s approach is to keep only base SSD inside the compute tray and move large-scale storage into a separate layer, ICMS for inference context storage. The report splits NVIDIA’s NAND demand into four layers.
The first is the in-box base configuration. Both Blackwell and Rubin use 18TB per tray as the standard setup, mainly for loading training data and saving checkpoints.
The second is the extra storage attached to Blackwell. The note says 18TB is not enough for multi-tenant inference and similar workloads, so customers often add about 46TB, bringing a tray to 64TB. That is treated as a transitional setup. In the Rubin era, this demand shifts to CMS storage cabinets and is expected to shrink sharply once Rubin becomes the main platform in 2027.
The third is STX CMS context storage in the Rubin era, which the report calls the biggest structural increment in 2027. As long-context inference spreads, HBM and DRAM can no longer hold the full KV cache. NVIDIA’s answer is ICMS, a dedicated storage cabinet built from large numbers of SSDs and shared across the compute cluster. Every four NVL72 systems share one CMS cabinet. Each cabinet has eight trays, and each tray carries 600TB. That works out to about 16.7TB of extra NAND per Rubin GPU, roughly four times Blackwell’s actual configuration. By 2027, the report says this layer will account for more than 70% of NVIDIA’s NAND demand.
The fourth layer is the standalone Vera CPU rack, aimed at agent workloads that need CPU cores. The note says each Vera CPU is configured with 8TB of NAND storage.
ASICs, AMD, China CSPs, and QLC data lakes
For in-house ASICs at cloud providers, the report says SSD configurations diverge sharply. Google TPU includes HBM, with TPU v7 carrying 192GB per chip, and uses only 16TB per tray. AWS Trainium includes 144GB to 288GB of HBM, with Trainium3 at 144GB and Trainium4 at 288GB, and uses 32TB per tray. Meta’s early MTIA v2 is described as the only no-HBM design, with just 128GB of LPDDR5 per chip and about 512GB of memory for the whole tray. Because memory is thin and recommendation systems need TB-scale embedding tables, SSD has to act as an extension of memory, pushing the tray configuration to 64TB, four times Google’s level.

AMD trays are uniformly modeled at 64TB across generations. For Chinese cloud service providers, Dolphin Jun estimates demand from capex at 50EB in 2025, 120EB in 2026, and 180EB in 2027. QLC data lakes are assumed, based on SanDisk’s own framing, to account for 25% of total NAND demand. On top of that, cloud providers are assumed to carry about 10% extra inventory during a rising-price cycle, so the total is multiplied by 1.1 starting in 2026.
Putting the major players together, the report estimates global AI NAND demand at about 462EB in 2026, 686EB in 2027, and 891EB in 2028, implying a three-year CAGR of 75%. The 2026 jump is attributed mainly to QLC data lakes, volume growth and restocking by Chinese cloud providers, and higher in-rack storage. In 2027, the baton passes to NVIDIA, with Rubin’s STX CMS context storage cabinets becoming the main engine of its NAND demand and, together with QLC data lakes, one of the two biggest sources of global demand growth.
Non-AI demand stays mixed
Outside AI, enterprise SSD demand remains relatively solid. The report expects non-AI enterprise SSD demand to grow 32.5% in 2026 and 24.0% in 2027, helped by general server refresh cycles and by AI inference deployment at North American cloud providers lifting both volume and pricing for general-purpose servers. Growth then falls back to around 3% in 2028.
Consumer demand is under heavier pressure. Dolphin Jun expects consumer and other NAND demand to fall 4.0% in 2026. PCs are hit most directly, with client SSD demand down about 8% in 2026 before rebounding about 7% in 2027 from a low base. Smartphone NAND demand is projected to decline about 5% to 6% in both 2026 and 2027, stabilizing only in 2028.
As those trends diverge, data center demand, meaning AI plus enterprise, is expected to account for 51% of total NAND demand in 2026 for the first time and rise to 63% by 2028. The report says this cycle is likely to split: AI and enterprise products stay tight under long-term agreements, while consumer pricing may peak earlier.
In total, global NAND demand is projected to rise from 992EB in 2025 to 1,830EB in 2028, a CAGR of about 23%, well above the roughly 13% pace seen from 2021 to 2025. Almost all of that growth comes from AI. AI NAND demand rises from 166EB to 891EB, a three-year CAGR of 75%, contributing 87% of incremental demand, while non-AI demand grows at only 4%. Structurally, data centers contribute more than half of demand in 2026, and by 2028 servers, AI plus traditional, are expected to account for about 60% of total demand, with AI servers alone rising from 17% in 2025 to 49%.
2028 is the likely turning point
Combining both sides of the market, Dolphin Jun estimates a NAND bit shortage of about 6% in 2026 and about 4% in 2027.
The report says 2028 is likely to be the dividing line. Supply growth becomes more certain as new capacity, especially from YMTC, starts to ramp. If demand does not find another major leg up, such as continued high growth in CSP capex or a breakout in edge AI, the market will probably move into oversupply and the NAND price cycle will end.
On that basis, the note expects the current super cycle to last through the end of 2027. From 2028, the supply-demand gap should ease, and after overseas capacity comes online in a concentrated way from 2029, prices are expected to fall more clearly.
SanDisk model: ASP peaks in FY28, then declines
The SanDisk forecast is built on the company’s June fiscal year-end, so FY27 runs from July 2026 to June 2027.

ASP: peak in FY28, with contracts supporting the floor
Management has guided to mild quarter-by-quarter ASP increases in FY27 and revenue growth of 15% to 19% in FY28 through FY30, in line with bit shipment growth. Dolphin Jun says that implies a very optimistic assumption: flat pricing for three years and a cycle fully ironed out by long-term agreements.
The report takes a more cautious view. It expects pricing to peak in FY28 and then fall materially in FY29 and FY30. FY27 ASP is projected at $0.37/GB, up 113% year over year. With FY26Q4 ASP at $0.31/GB and spot already around $0.44/GB, the market still shows about a 4% shortage in 2027, but contract price ceilings should limit the upside, leaving a mild quarter-by-quarter rise.
FY28 ASP is projected at $0.38/GB, up just 2% year over year, with the peak occurring during FY28, or the second half of 2027 through the first half of 2028. As YMTC Fab 3 ramps and the market loosens, pricing is expected to start falling in the second half of FY28.
FY29 and FY30 are modeled as cyclical down years. ASP is projected to fall 20% and 40% year over year, respectively, dropping to $0.18/GB, back to the 2026 level. The reason given is a shift to oversupply as Samsung P5, the Kioxia-SanDisk Kitakami North fab, and SK hynix M17 all begin adding capacity from 2029.
Even then, FY30 ASP would still be about 2.5x FY25’s $0.07/GB. The report gives two supports for that floor: the NBM pricing floor, with minimum contract revenue of $93.9 billion and another $16.5 billion in guarantees, and the rising share of data-center demand, projected at 63% of total NAND demand by 2028, which lifts the mix toward higher-value customers.
Bit shipments: driven by process migration
At its investor day, management cut FY27 sellable bit growth from the mid-to-high teens to the mid-teens, or about 15%, because inventory needs to be reserved for the NBM agreement. Dolphin Jun says bit growth still depends on process migration rather than new wafer starts.
The report projects SanDisk bit shipments rising from 116EB in FY26 to 218EB in FY30, a CAGR of about 17%, mainly through migration from BiCS8 to BiCS10. BiCS10 is expected to enter mass production in the middle to second half of 2027, while the Kitakami North fab does not start production until after 2029. The NBM agreement is expected to cover about half of FY27 shipments and about two-thirds of FY28 shipments, giving relatively high visibility on volume.
Gross margin: hard to hold at extreme highs
Management has guided to non-GAAP gross margin of about 80% in FY28 through FY30, assuming ASP stays broadly stable. The report says margins could fall quickly if pricing turns down.
Historically, NAND has moved from shortage to oversupply multiple times, and sustaining 80% gross margin through a full cycle has been very rare. Even with NBM support, financial guarantees cover only about 18% of minimum revenue, with the rest still dependent on customer credit. If spot prices collapse, renegotiation risk remains.

Dolphin Jun therefore assumes unit cost stays around $0.051/GB from FY27 through FY30, excluding any cost-down from BiCS10, to cover depreciation on new lines, yield ramp, and higher raw-material prices. On that basis, gross margin peaks in FY28 at 86.6% and then declines year by year with ASP, reaching 72% in FY30.
Profit and valuation: the debate is whether the cycle can really be smoothed
On expenses, management has guided to OpEx at about 5% of revenue in FY28 through FY30 and non-GAAP operating margin at about 75%. Dolphin Jun expects operating margin to peak at 82% in FY28 and fall to 65% in FY30, with a three-year average still around 75%.
Using a tax rate of about 15%, the report projects SanDisk net profit peaking in FY28 at about $41.6 billion and falling to about $21.6 billion in FY30, only 43% of the roughly $50.8 billion implied by management’s guidance.
Under management’s framework, starting from FY27E, revenue grows about 17% a year, pricing does not fall, operating margin stays around 75%, and net profit rises from about $34.4 billion in FY27 to about $50.8 billion in FY30. Dolphin Jun says that is effectively a model in which the cycle is ironed out: long-term agreements hold up contracted pricing, and AI demand absorbs the new supply arriving after 2029 so that non-contracted pricing also avoids a decline.
For valuation, the report calls SanDisk a classic cyclical growth stock with highly volatile earnings. Instead of relying on a simple peak EPS times low multiple approach, Dolphin Jun uses cross-cycle net profit times a mid-cycle multiple as the core method, with discounted cash flow as a cross-check. Cross-cycle net profit is taken as the nine-year average from FY22 through FY30, at about $15.9 billion, covering the previous trough, the AI super cycle, and the later price decline period.
Bottom line
Dolphin Jun’s conclusion is that SanDisk is now trading in a reasonable range and already reflects expectations under a neutral scenario, leaving limited short-term margin of safety.
The key question for further upside, according to the report, is not current operating strength by itself. It is whether the market is willing to believe, and later verify, that pricing does not break down after 2028.
The note adds that a more detailed valuation analysis has been published in the Longbridge App under the same title in the “Updates - Deep Dive” section.
The article was originally published on the WeChat public account Dolphin Research under the byline Dolphin Jun and republished by MarsBit.