

MarsBit has published a detailed timeline of South Korea’s recent deleveraging cycle, arguing that the selloff was not a simple valuation reset in semiconductor stocks but a chain reaction built on concentrated positioning, leveraged ETF mechanics, margin financing, foreign rebalancing, and a later shift in regulation and rates. The article, written by qinbafrank, says the Korean market was the first clear starting point for this wave of deleveraging. While U.S. equities began their own deleveraging phase on July 1, the June 23 plunge in Korea had already opened the sequence.
Before June 23: the setup for a stampede was already in place
The article says the market structure formed between May 27 and June 22 is essential to understanding what came later.
Retail capital was pushed into two chip names through 2x single-stock products
On May 27, South Korea launched 2x leveraged and inverse ETFs tied to Samsung Electronics and SK Hynix. By June 19, retail investors had recorded cumulative net purchases of about KRW 8.2 trillion in long leveraged ETFs, including roughly KRW 4.6 trillion linked to SK Hynix and about KRW 3.7 trillion tied to Samsung Electronics. Net buying in inverse ETFs over the same period was only around KRW 0.3 trillion.
The article says the money did not simply come in from cash on the sidelines. It rotated out of broader semiconductor ETFs and KOSPI index ETFs into single-stock leveraged products. By June 19, assets in SK Hynix leveraged ETFs had reached KRW 9.15 trillion, while Samsung-related products stood at KRW 5.22 trillion.
That shift changed the market in three ways. Investors moved from diversified sector exposure into concentrated exposure to two stocks. Ordinary stock volatility was magnified by 2x leverage. And as ETF assets grew, the size of the daily rebalancing trade grew with them.
The Korea Capital Market Institute estimated that assets in SK Hynix-related leveraged ETFs increased by about KRW 4.31 trillion between June 10 and June 19. Of that amount, around KRW 3.6 trillion did not come from new subscriptions but from net asset value expansion driven by the underlying stock price. In other words, rising prices were creating larger future rebalancing needs even without fresh investor inflows.
Samsung and SK Hynix had become close to half of the KOSPI
The combined market-cap weight of Samsung Electronics and SK Hynix in the KOSPI rose from 34% at the end of 2025 to 49% on May 26, then reached 52% by July 15.
The article describes this as a form of structural index leverage rather than traditional borrowing leverage. If those two stocks fell 10% while the rest of the index stayed flat, KOSPI could still lose about 5%.
By July 15, the combined market value of 16 single-stock leveraged or inverse products had expanded from KRW 4.4 trillion at launch on May 27 to KRW 11.9 trillion. Daily turnover increased from KRW 10.4 trillion to KRW 13 trillion.
The June 22 regulatory message altered confidence
On June 22, the head of South Korea’s Financial Supervisory Service publicly said approvals for the products had been "too rushed" and that officials were studying measures to stabilize the market.
Regulators also said the original approval of domestic single-stock leveraged products had two policy aims: to bring demand for offshore products under domestic supervision and to draw South Korean retail funds back from U.S. and Hong Kong markets in order to ease pressure on the won. The article says the currency impact turned out to be limited.
By the end of May, retail leverage investment of various kinds in South Korea had reached about KRW 60 trillion.
In the article’s reading, the significance of that June 22 message was not that trading would be banned at once. It was that several assumptions changed at the same time: expectations of policy support for product expansion were broken, the growth room for broker and asset-manager products was questioned, foreign investors began to worry that regulation could change market liquidity, and the market started to take the feedback risk of 2x ETFs seriously.
The path of the selloff
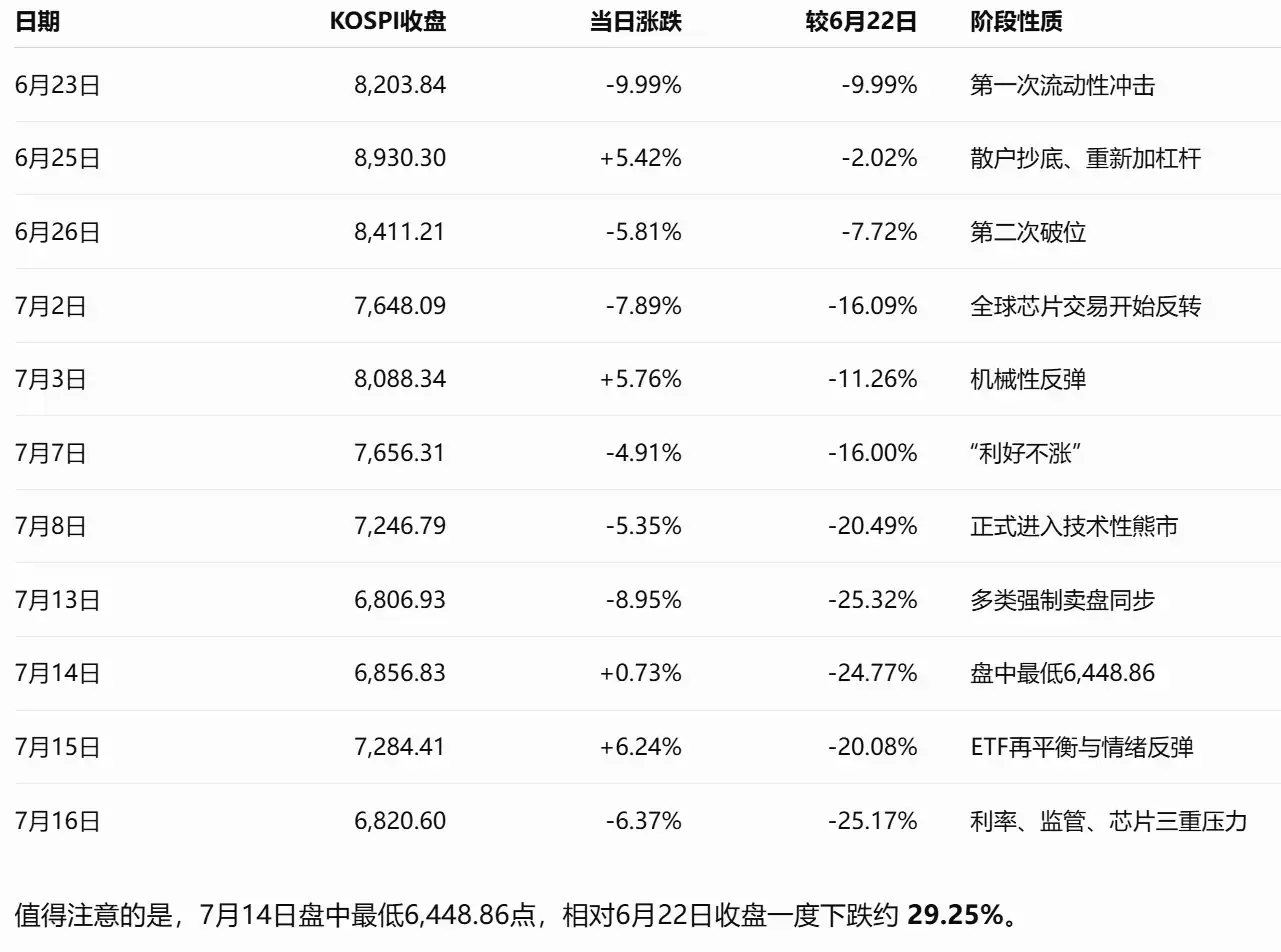
The article uses the June 22 close of 9,114.55 as the baseline for relative declines and breaks the process into a series of stages.
Stage one: June 23 — prices collapsed first, debt did not
On June 23, KOSPI fell 9.99% in one session. Samsung Electronics and SK Hynix each dropped more than 12%, and the market triggered a 20-minute broad trading halt.
The article lists several immediate triggers: the regulator’s sharp warning on leveraged ETFs a day earlier, concentrated foreign selling in the two chip leaders, a parallel pullback in global technology shares, and profit-taking by institutions after a prolonged rally.
Because Samsung and SK Hynix made up more than half of the KOSPI, selling in those two stocks quickly became an index-level problem.
The more important point, the article says, was what happened beneath the headline move. Forced liquidations rose from about KRW 19.9 billion the previous day to KRW 42.427 billion. Unsettled receivables increased by KRW 181.6 billion to KRW 1.4792 trillion. Margin financing balances remained around KRW 38 trillion.
That meant the first crash day did not produce broad debt repayment. Some investors were still using short-term credit to average down into the decline. The article calls this price deleveraging rather than balance-sheet deleveraging: prices fell fast, ETF net asset values and collateral values dropped, but retail investors did not withdraw. Existing leverage stayed in the system, and fresh leverage was still being added. At that stage, the market largely treated the decline as a technical overshoot caused by regulatory remarks rather than a trend reversal.
Stage two: June 24–25 — forced selling and renewed leverage happened together
KOSPI rebounded 3.26% on June 24 and 5.42% on June 25. By the close on June 25, the index was only about 2% below the June 22 high.
Under the rebound, though, two opposite processes were running at once. On one side was forced liquidation. Public data showed roughly KRW 110.793 billion in forced sales on June 24, largely tied to short-term margin accounts that had failed to meet funding demands in time. On the other side was new borrowing. Margin financing balances rose by about KRW 539.2 billion that same day to a record KRW 38.6328 trillion.
In practical terms, old accounts were being liquidated while new or surviving accounts were borrowing more money to buy the dip. That is why June 24, not the day before the crash, marked the peak in total market margin debt.
The article then explains why 2x long ETFs amplified the rebound. These products must reset their exposure every day to restore 2x target leverage. If an ETF starts with NAV of A and holds stock or derivative exposure of 2A, then after a 10% drop in the underlying, NAV falls to about 0.8A and the old exposure becomes about 1.8A. The new target exposure is 1.6A, so the ETF has to sell about 0.2A. In a rising market, the reverse happens and it must buy more.
The Korea Capital Market Institute estimated that the rebalancing volume of single-stock 2x ETFs is roughly proportional to prior-day AUM multiplied by the stock’s daily move, and that the same directional adjustment appears in both spot and futures markets. According to the article, the June 24–25 rebound was driven at the same time by retail dip-buying, short covering, upward ETF rebalancing, and hedge adjustments by brokers and market makers. It was not a healthy rebound after deleveraging had finished. It looked more like leverage being rebuilt in the middle of a deleveraging process.
Stage three: June 26–30 — foreign investors pulled back and households took the other side
KOSPI fell 5.81% on June 26. On June 29, the index closed down just 0.20%, but intraday swings were large and the VKOSPI volatility index rose to a record 97.99, up from 28.85 at the end of 2025.
The article says the key shift in this period was not any single session but a change in who was holding the risk. In the first half of 2026, foreign investors recorded net outflows of about $70.8 billion from the South Korean equity market. In June alone, net outflows were roughly $12.63 billion.
Those sales came from several types of institutions: mutual funds sold about $7.5 billion, pension funds sold about $4.35 billion, and hedge funds sold about $1.87 billion.
The article says the moves were not simply a broad call against Korea. Korean and Taiwanese chip shares had already risen sharply, and the weights of Samsung Electronics, SK Hynix, and TSMC in global funds had expanded rapidly. Passive and active funds both needed to control concentration in a single country, a single sector, and a single stock. Some money was also tied to currency hedging and benchmark rebalancing, while long-term institutions were taking profits.
Retail investors became the marginal buyer. South Korean individual investors posted cumulative net purchases of about KRW 42.4 trillion in KOSPI stocks during June.
The result, the article says, was a clear transfer of risk. Foreign investors, pension funds, and mutual funds reduced exposure, while Korean households took those positions through cash purchases, margin financing, and leveraged ETFs. That supported the index in the short term, but it also moved risk from global institutional balance sheets to household balance sheets, leaving the remaining ownership base less able to absorb margin calls and price swings.
Stage four: July 1–3 — the global semiconductor trade reversed and ETFs began to systematically sell low and buy high
KOSPI lost 2.04% on July 1 and then dropped another 7.89% on July 2. On July 2, SK Hynix fell 14.6%, Samsung Electronics lost 9.1%, Kioxia in Japan dropped more than 13.5%, and U.S. semiconductor stocks had also sold off sharply the previous night.
The market had moved beyond the view that semiconductor earnings were simply strong in the present. According to the article, investors started asking whether reports that Meta was selling compute capacity pointed to future oversupply, whether U.S. cloud companies could maintain aggressive AI capital spending, whether the data-center buildout was approaching a slower marginal pace, whether the hundreds of billions of dollars in new capacity planned by Samsung and SK Hynix could create excess supply later, how long memory-price gains could last, and whether the speed and duration of earnings growth had already been fully priced in.
The article separates the industry trigger from the market amplifier. The industry trigger was profit-taking across global semiconductor names, doubts about the durability of AI capex, the possibility that memory-price growth was peaking, and the impact of planned new capacity on future supply and demand. What pushed the decline close to 8%, however, was market structure: foreigners sold heavy-weight chip names, 2x ETFs were forced to cut exposure as the underlying stocks fell, futures and spot market makers sold in the same direction to hedge, falling index levels weakened collateral ratios in margin accounts, and risk models, stop-loss rules, and systematic strategies reduced positions again.
KOSPI then bounced 5.76% on July 3. The article says that move can be explained by the same mechanisms running in reverse: retail dip-buying, short covering, and ETFs re-adding exposure. The result was a market where declines forced ETF selling and rebounds forced ETF buying, meaning volatility was amplified in both directions rather than dampened.
The Korea Capital Market Institute also stressed that ETFs were not the sole cause. Volatility in U.S. and Japanese memory stocks rose sharply during the same period, and uncertainty around the Middle East, inflation, and global interest rates mattered as well. In the institute’s framing, ETFs were an amplifier, not the only source of the move.
Stage five: July 6–8 — positive news stopped lifting prices
The article marks July 7 as the second major turning point in market psychology. Samsung Electronics released preliminary guidance showing that second-quarter operating profit could rise by about 19 times year over year, yet the stock still fell 6.9% that day and was down more than 10% at one point intraday. SK Hynix fell 6.1%.
That, in the article’s view, showed the market had entered a phase where good news no longer pushed prices higher. The issue was not weak earnings. It was that expectations had already become too high, and investors were beginning to treat current profits as a possible cyclical peak. Good news was being used to sell into strength rather than to chase the rally further.
Foreign investors were net sellers of about KRW 2.9 trillion that day, while individual investors were net buyers of about KRW 3.2 trillion. The article highlights another warning sign: margin financing balances on the KOSPI were still around KRW 29.7 trillion, only slightly below the late-June peak of about KRW 29.8 trillion. So the index had fallen about 16% from the high, yet KOSPI margin debt had barely declined.
The weakness was not limited to semiconductors. LG Energy Solution projected a 77% decline in second-quarter operating profit as electric-vehicle demand weakened, and its shares dropped 6.4%. Hanwha Ocean fell 22.7% after Canada selected a German option for a submarine project. The article says market stress was broadening from semiconductor product structure into slower battery earnings, uncertainty in defense and shipbuilding orders, lower risk budgets for high-valuation growth shares, and more aggressive repricing of stock-specific negative news.
On July 8, KOSPI fell another 5.35%, taking the drop from the June 22 high to more than 20% and pushing the market into bear territory. The Philadelphia Semiconductor Index had previously declined 4.7%, and investors were still focused on the durability of AI investment, slowing growth in memory prices, and the risk that earnings had peaked. South Korea’s finance minister also began publicly saying that the government would closely monitor risks tied to single-stock leveraged ETFs.
The article notes one detail that complicates a simple foreign-selling narrative. After 13 straight sessions of foreign net selling, overseas investors turned into small net buyers of about KRW 33.59 billion on July 8, while the won strengthened because of dollar conversion demand linked to SK Hynix’s U.S. fundraising. The piece says this is why the move cannot be reduced to a single chain of foreign outflows, won depreciation, and falling stocks. Cross-border financing, currency hedging, and equity rebalancing can all happen at the same time, and equity and FX signals can diverge in the short run.
Stage six: July 9–10 — forced liquidations rose further and leverage channels widened into the U.S. and Hong Kong
KOSPI rose 0.62% on July 9, but publicly reported forced liquidations reached about KRW 142.197 billion, the fourth-highest on record for the available series.
Across 2026, there had been six sessions with forced liquidations above KRW 100 billion, and five of them came after the May 27 launch of single-stock leveraged ETFs. Total market margin financing remained around KRW 36.63 trillion on July 9, including about KRW 28.84 trillion on the KOSPI and KRW 7.80 trillion on the KOSDAQ.
The article says this shows a clear lag in liquidation pressure. Stocks fall first. Investors then receive margin calls. If they fail to post additional funds in time, brokers execute forced sales over the following sessions. For that reason, the author argues that the five-day average and the following few days matter more than the forced-selling number on the crash day itself.
On July 10, SK Hynix American depositary receipts began trading on Nasdaq in a fundraising worth about $26.5 billion. At least 10 fund managers filed applications for single-stock leveraged or inverse ETFs built around the SK Hynix ADR issuance.
That opened new leverage transmission channels for the same stock across time zones: the Seoul-listed ordinary shares, 2x leveraged products in Hong Kong, the U.S.-listed ADR, U.S. single-stock leveraged ETFs, Korean spot and futures markets, and cross-market hedging by market makers. The article adds an important caveat: there is no public exchange data that can precisely prove how each cross-market arbitrage flow affected Seoul share prices. But from a structural standpoint, the author says the new listing and product pipeline increase overnight price discovery, ADR-versus-local-share spread trading, market-maker hedging, overseas daily rebalancing, and next-day gap risk when Seoul opens.
Stage seven: July 13–15 — multiple types of selling hit at once, then a mechanical rebound followed
July 13 is described as the clearest waterfall deleveraging day of the entire move. KOSPI fell 8.95% to 6,806.93. SK Hynix dropped 15.37%, Samsung Electronics lost about 10%, foreign investors sold a net KRW 1.7261 trillion, institutions sold a net KRW 2.1964 trillion, and individual investors bought a net KRW 3.8809 trillion against the decline.
The article attributes that session to several factors moving together: profit-taking after the SK Hynix ADR listing, foreign reallocation between the ADR and Seoul shares, continued doubts over the durability of AI spending by U.S. technology companies, a growing debate over whether the memory cycle had peaked, renewed tension between the United States and Iran, and higher oil prices and inflation expectations that pushed global rate expectations in a more hawkish direction.
At the same time, a Hong Kong-listed 2x leveraged ETF tied to SK Hynix fell more than 30% that day. Its same-direction deleveraging added to the pressure on SK Hynix shares and the KOSPI. The article sums up the session this way: active risk reduction by foreign and institutional investors, passive exposure cuts by leveraged ETFs, margin calls in financed accounts, broker liquidations, and systematic stop-loss selling combined into waterfall-style selling.
Retail investors were still net buyers of nearly KRW 3.9 trillion, so the article says this looked closer to a surrender in price and liquidity than a complete surrender by households.
On July 14, KOSPI fell as low as 6,448.86 intraday, putting the maximum drop from the June 22 close at about 29.25%, before closing up 0.73%. By then, retail investors had already recorded net purchases of about KRW 13.2 trillion in KOSPI stocks during July, after buying KRW 42.4 trillion in June. KOSPI margin financing balances stood around KRW 28 trillion, down only about 6% from the June 24 peak of KRW 29.8 trillion.
That meant the index had nearly fallen 30% at the intraday low, but margin debt on the KOSPI had declined only around 6%.
KOSPI then surged 6.24% on July 15. SK Hynix gained nearly 13%, Samsung Electronics rose nearly 8%, and semiconductor equipment maker Hanmi Semiconductor at one point climbed about 25%.
The article says the rebound was driven by softer-than-expected U.S. inflation data, a rebound in U.S. technology shares, renewed analyst arguments for a structural shortage in AI memory, and a market view that part of the recent selling had come from ETF position unwinds rather than from a collapse in semiconductor fundamentals.
Some industry views cited in the article held that current DRAM supply can meet only about 75% to 80% of demand and that the gap could widen further in 2027. Another group of investors, however, remained worried about slower capex from U.S. cloud companies, new supply additions, and slower future growth in memory prices. The article’s conclusion is that the July 15 rebound reflected two things at once: the return of a bullish fundamental narrative and renewed buying by 2x ETFs, short covering, and systematic strategies. It was a mechanical releveraging bounce inside a deleveraging process, not proof that the final bottom had been set.
Stage eight: July 16 — regulation, interest rates, and semiconductors all added pressure
On July 16, KOSPI fell 6.37% to 6,820.60. Samsung Electronics lost 8.77% and SK Hynix dropped 11.53%. Foreign investors sold a net KRW 1.9288 trillion, institutions sold a net KRW 3.0537 trillion, and individual investors bought a net KRW 4.7816 trillion.
Sector performance showed a clear split. Electrical and electronics fell 9.43%, manufacturing lost 7.51%, machinery and equipment dropped 4.70%, and construction fell 3.30%. On the other side, telecom rose 3.39%, food and tobacco gained 2.12%, paper and wood rose 2.00%, and textiles and apparel added 1.01%.
The article says this was not a market-wide indiscriminate liquidity collapse. Capital was rotating out of semiconductors, equipment names, and high-beta growth sectors into more defensive groups.
On the same day, the Bank of Korea raised its benchmark interest rate from 2.50% to 2.75%, an increase of 0.25 percentage points. The central bank cited strong export and investment growth, semiconductor-led economic momentum, June CPI at 3.2%, core inflation at 2.5%, and continuing exchange-rate and financial-stability risks.
According to the article, the rate increase was not aimed specifically at the stock market, but it still affected leverage through three channels: it raised the opportunity cost of margin funding and other borrowing, increased the discount rate used in equity valuation, and reduced the ability and willingness of retail investors to keep borrowing money to buy dips.
Also on July 16, South Korea’s Financial Services Commission announced a package of restrictions for single-stock leveraged products, confirming a formal policy turn.
Main points of the regulatory package
Measures taking effect immediately
- A suspension on new listings of single-stock leveraged, inverse, and related products.
- A ban on advertising and promotional marketing by brokers and asset managers.
Measures to be phased in during August
- The LP price-deviation management standard will be tightened from 3% to 2%.
- LPs and asset managers found severely negligent will face limits on new product business.
- Investor education requirements will rise from two hours to three hours.
- Risk disclosures on losses, long holding periods, and price deviations will be strengthened.
- Around August 5, the minimum base deposit will be raised from KRW 10 million to KRW 30 million.
- Around August 19, stocks and other substitute assets will no longer count toward that base deposit, and KRW 30 million in cash will be required.
Measure planned for November
- The minimum trading unit for domestic single-stock leveraged products will rise from one unit to a provisional 20 units.
The article says the package has two layers of impact. Over the longer term, it lowers demand for new leverage, raises entry barriers, reduces marketing-driven inflows, improves ETF price deviations, and limits unlimited product expansion. In the short term, it may also push investors who cannot meet the new cash threshold to reduce positions early and strengthen the market’s sense that regulators are no longer backing a leverage-driven rally.
For that reason, the article treats July 16 as the point where deleveraging stopped being mainly a market-driven process and became institutionalized through regulation and tighter monetary policy.
The article’s bottom line
From June 22 to July 16, KOSPI fell from 9,114.55 to 6,820.60, a cumulative drop of 25.17%. Total market margin financing declined from a peak of about KRW 38.63 trillion on June 24 to roughly KRW 34.37 trillion, down about 11%.
That means the price decline was roughly 2.3 times the drop in margin debt. The article’s conclusion is that the first and fastest phase of deleveraging happened in prices and in leveraged products, while debt on investor balance sheets came down much more slowly.
Its broader judgment is that this was not just a semiconductor valuation pullback. It was a negative feedback loop formed by foreign rebalancing, retail dip-buying through margin accounts, daily rebalancing in single-stock leveraged ETFs, forced liquidations, changing industry expectations, a shift in regulation, and tighter monetary policy.
The author argues that leveraged ETFs were not the original spark, but they were a major amplifier. Margin financing was not the direct cause of every down day, yet it determined whether a decline could turn into a chain of forced liquidations.
The piece also refers to what it calls compressed deleveraging: multiple layers of leverage expressing the same view at once. When prices rise, all of those expressions add delta together. When the market turns, they all cut delta together, producing a highly symmetrical pattern of consensus reinforcement on the way up and crowded unwinds on the way down. In that setup, liquidity can look abundant on the surface while remaining extremely fragile underneath. Once prices stop rising, delayed disconfirmation arrives all at once.
The final argument in the article is that this was not fundamentally about a severe liquidity shortage or a major collapse in fundamentals. It was closer to an expectations reversal. Once marginal buying disappeared, prices that had been supported by sentiment premiums were squeezed lower, and leveraged capital was then forced to cut positions, creating the stampede.