

Payment activity is rising, but the money is not made in just one layer
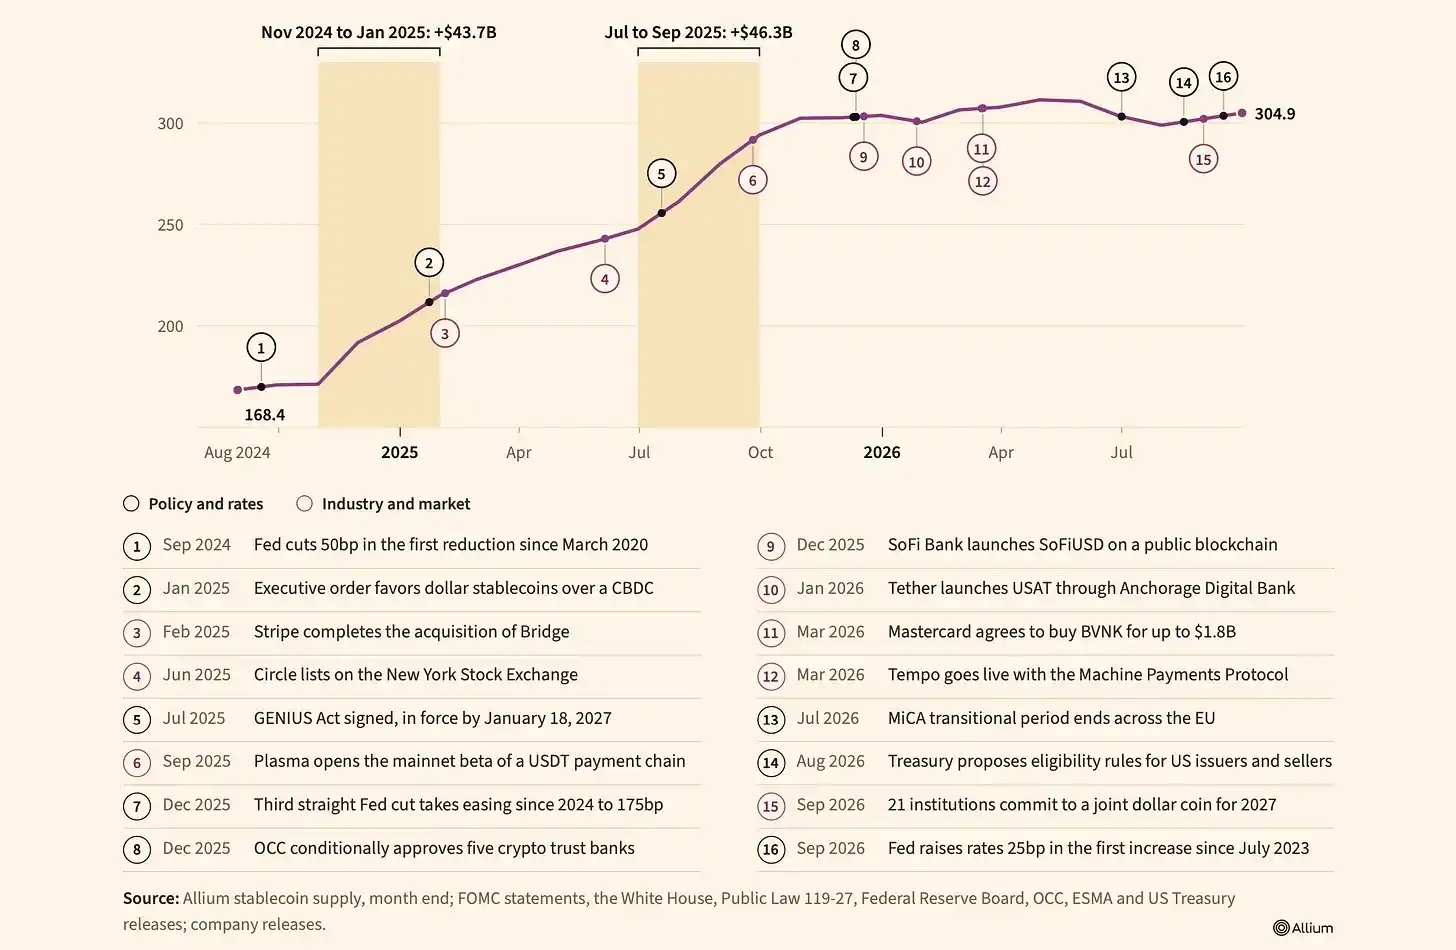
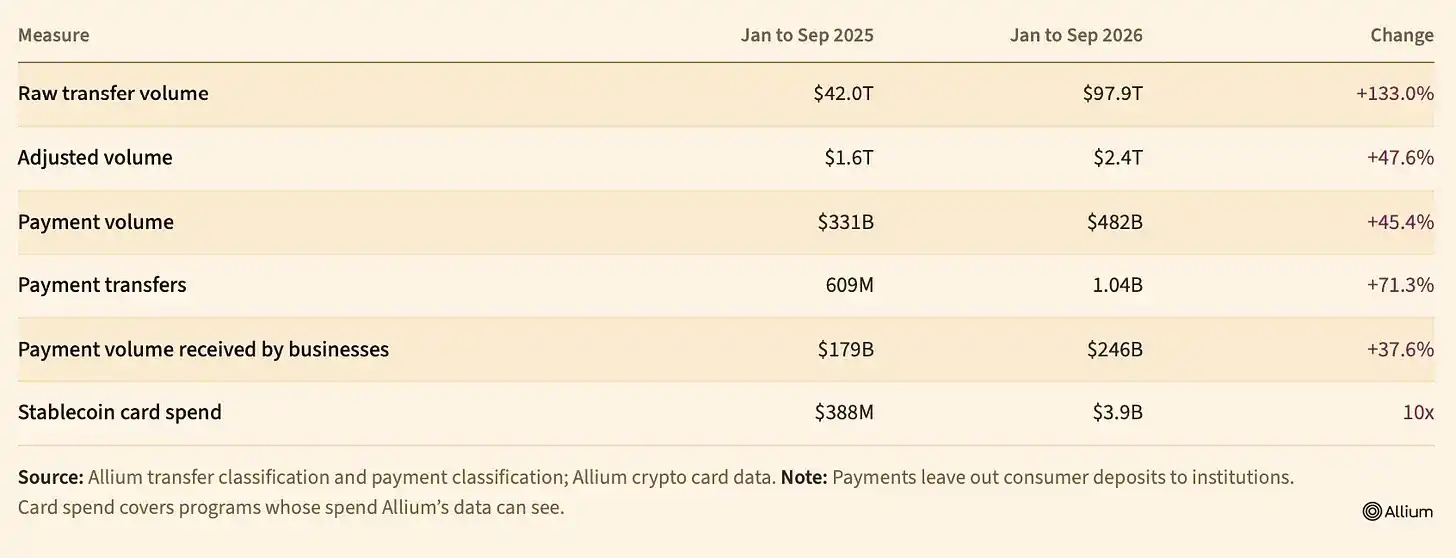
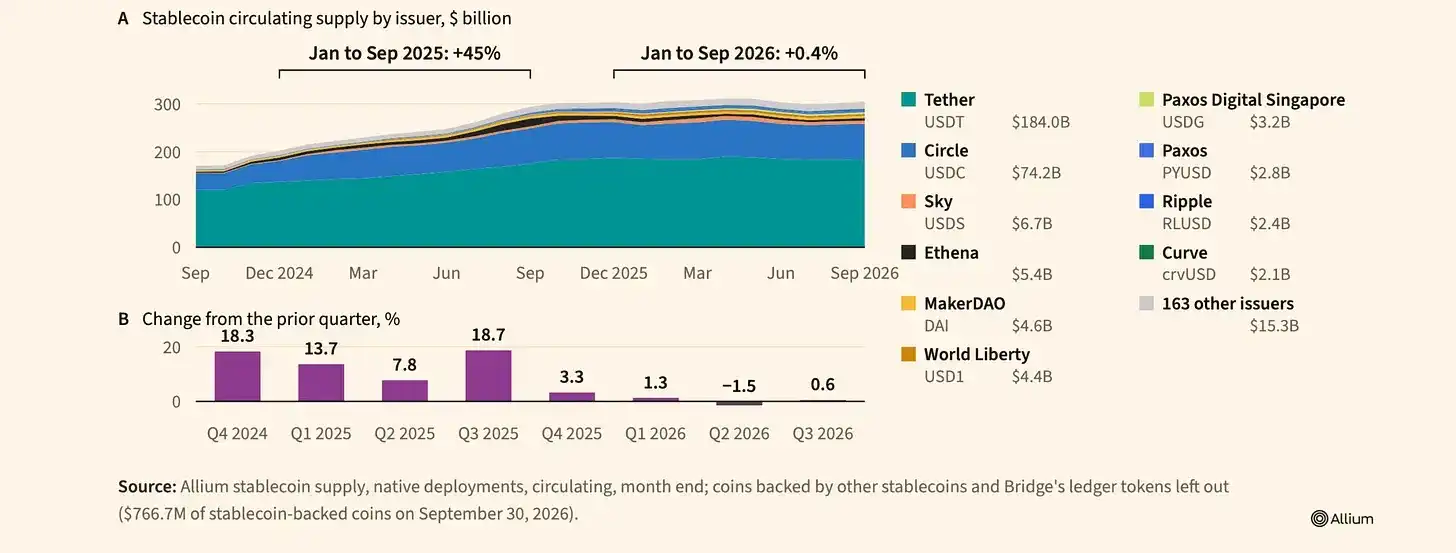
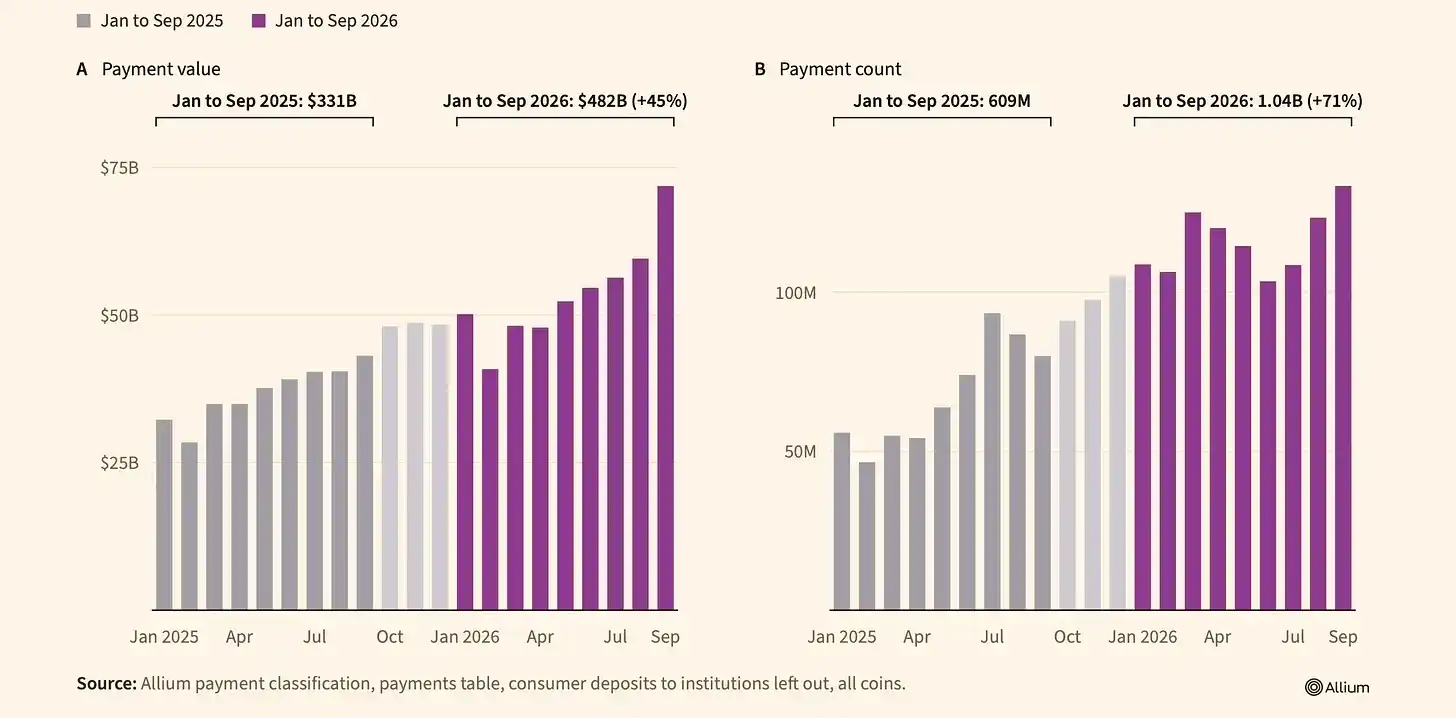
Stablecoin circulation stood at $304.9 billion at the end of September 2026, only 0.4% above the level seen in December. Over the same first nine months of the year, however, Allium classified $482 billion in stablecoin transfers as payments, up 45.4% from the same period in 2025.
The central question for investors is not simply how large the stablecoin market can become. It is who gets paid when digital dollars move. A user might receive wages in stablecoins, keep the balance inside a payroll app, then spend it through a card. The issuer earns on reserve assets. The app owns the customer relationship. A payment provider handles conversion and settlement. Several companies can touch the same transaction while operating under very different economic models.
The report says headline growth figures can mislead. Allium’s $482 billion payment estimate is derived from wallet classification and transaction behavior, not from verified invoices or merchant acceptance records. Its methodology removes a large amount of automated activity, but it cannot determine the commercial purpose of every transfer. That distinction matters when companies use volume to support valuations or claim a growing share of global payments.
Economics explain more than transfer counts. Issuers earn as a function of reserve balances and prevailing rates. Distributors negotiate for a share of that reserve income. Payment processors charge for moving funds, converting currencies and connecting customers to banking infrastructure. The same dollar can produce revenue at multiple layers, which makes the industry-wide profit pool easy to overstate. The report also argues that the most valuable part of a payment may not be the onchain transfer at all, but local banking access, reliable FX, reconciliation, compliance and failed-payment handling.
$97.9 trillion in raw transfers does not describe a $97.9 trillion payments market
Blockchains can record token movements reliably, but they rarely provide evidence of the commercial obligation behind those movements. A supplier payment and a market maker inventory rebalance can look identical at the event level. Smart-contract automation can multiply records, while net settlement can compress several purchases into one transfer.
Allium reported $97.9 trillion in raw stablecoin transfer volume for the first nine months of 2026. Of that, $59.3 trillion was classified as infrastructure activity and $36.2 trillion as exchange activity, leaving about $2.4 trillion in adjusted activity. It then classified $482 billion as payments, roughly one-fifth of the adjusted total and less than 0.5% of raw volume. The report is explicit that this figure is a modeled payment estimate under Allium’s covered assets, entities and classification rules, not an independent count of settled commercial obligations.
Those filters are a meaningful improvement over raw transfer volume, but their precision is unknown. Allium combines proprietary labels, wallet classification and behavioral rules, with the first matching rule determining the result. A transfer between two identified businesses could be an invoice payment, a treasury rebalance or a movement between affiliated entities. The report notes that Allium has not published an amount-weighted error study sufficient to estimate false positives and false negatives in the $482 billion payment series.
A Bank for International Settlements working paper makes the problem more concrete. Researchers examined 593 million stablecoin transfer events across 141 million Ethereum transactions and found that nearly 60% of events were nested inside complex multi-action transactions. The sample covered three dollar stablecoins on Ethereum in 2025. It shows the risk of counting events as standalone payments, but it does not provide an adjustment factor for Allium’s broader dataset.
Historical comparisons carry another complication. On Sept. 18, 2026, Visa updated the classification method on its onchain analytics dashboard, expanding the labeled-address sample from about 15 million to 600 million and adding routing heuristics. That allowed more automated activity to be identified and excluded. Because Visa’s dashboard uses Allium inputs, agreement between the two series cannot be treated as independent validation. Growth rates need to be compared under the same version of labels and exclusion rules.
Two issuers still dominate, even as the field gets more crowded
As of the end of September, Allium attributed $184 billion in circulating supply to Tether and $74.2 billion to Circle. Together they accounted for about 84.7% of the $304.9 billion total. Tether’s balance fell by $3.1 billion in the first nine months of 2026, while Circle’s declined by about $864 million. Smaller issuers offset those declines. The number of issuers with more than $1 billion in circulation rose from 11 to 15, so the market became more crowded without a major drop in concentration.
Beneath a flat headline total, expanding issuers added $11.4 billion, almost exactly offsetting $10.2 billion of declines elsewhere. USDG, RLUSD, USD1 and newer products picked up balances, in part at the expense of established tokens. Issuer-level data alone cannot show how much of that movement reflects new customer demand and how much comes from treasury migration, incentive programs or a switch from one dollar token to another. Billions in new issuance can amount to little more than a relabeling of an existing dollar position.
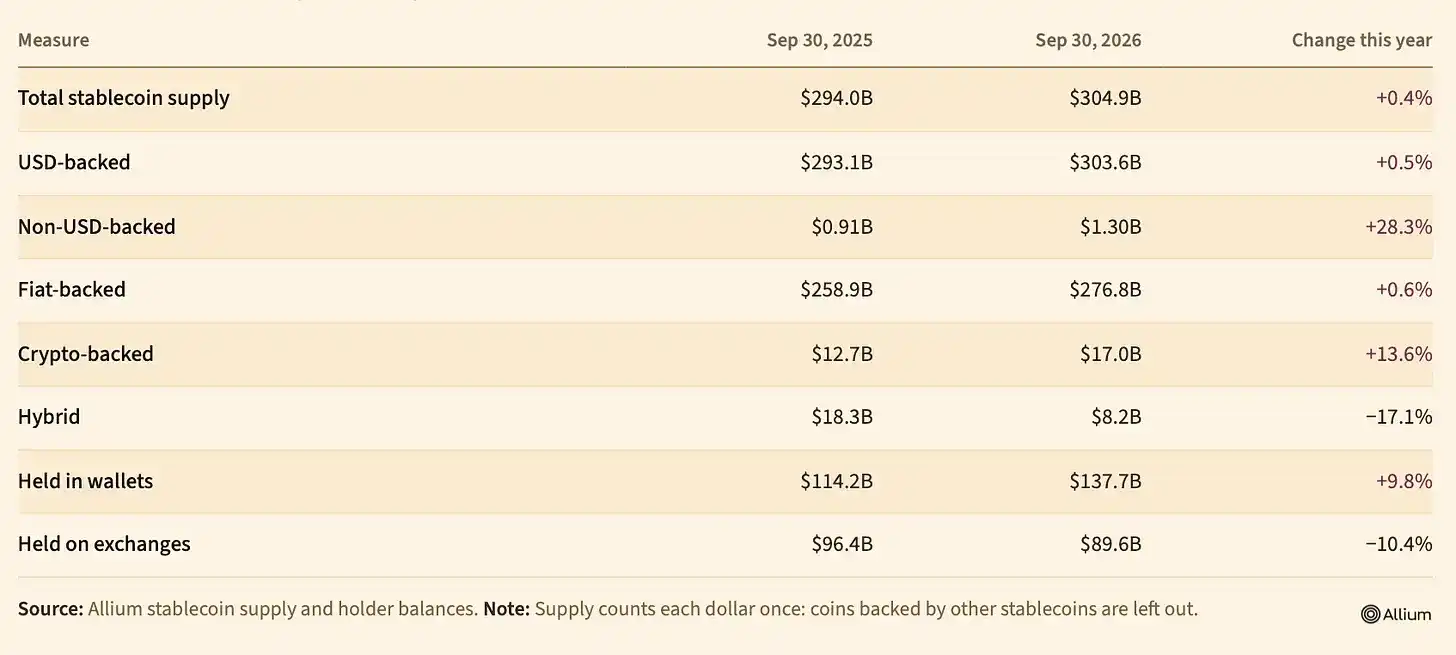
The report also warns against double counting branded tokens that hold existing stablecoins as reserves. Counting both the wrapper and the underlying token would create artificial market growth. Allium excludes those structures from its supply headline, but the report gives two different September figures for the exclusion: $766.7 million in the issuer section and $872 million in the branded-token section. Because the published report does not reconcile the difference, the analysis uses the reported total and does not add branded supply again.
Flat balances matter. A digital dollar can sit as collateral on an exchange, reflect household savings preferences or support an interest-bearing reserve portfolio. Issuer revenue depends more directly on the level and persistence of those balances than on how many transfers occur in a given week. A customer choosing to hold a token for six months is economically very different from a partner stocking inventory for a short marketing campaign.
Tether’s lead has a payments angle as well. Under Allium’s classification, USDT accounted for $406 billion of payment volume from January through September, or 84.2% of the total. That is even more concentrated than the issuer supply market. It points to the combined force of liquidity, established counterparties and user habit. It does not reveal Tether’s share of payment-processing fees, because the issuer, the network and the company converting stablecoins into local currency may be different entities.
Reserve income starts with the issuer, but distributors can take a large share
For a conventional reserve-backed stablecoin, profitability begins with average qualifying reserves and their realized yield. From there, the issuer pays distributors and other service providers, then covers operating costs. End-of-period supply is only an imperfect proxy for earnings, especially when rates or partner structures change. A one-percentage-point drop in reserve yield can matter more than several quarters of moderate payment growth.
Circle’s disclosures make that split unusually visible. In the second quarter of 2026, the company reported $667.7 million in reserve income and $33.6 million in other revenue, for total revenue of $701.3 million. It spent $412.5 million on distribution, transaction and other costs. The remaining $288.8 million represented a 41.2% revenue-less-distribution-and-transaction-cost margin before operating expenses, not net income. About $324.6 million of the quarter’s distribution expense was tied to Coinbase alone. The implication is straightforward: an issuer can manage a large reserve book while a substantial share of the resulting income flows to the company that brought in the balances.
That arrangement is economically rational. Distributors that bring customers and durable balances have bargaining power. For an issuer, paying for that access may be cheaper than building consumer wallets, payment platforms and regulatory relationships across multiple markets. But distributors can also switch suppliers or internalize issuance themselves. The issuer’s moat therefore depends on the cost and friction of replacing it, its liquidity network, its security reputation and the brand of the token itself.
The report offers a simplified sensitivity example. If $1 billion in average reserves earns a realized 3% return, it generates $30 million a year before costs. If the issuer keeps half of that reserve income after revenue sharing, it retains $15 million before its own expenses. A one-percentage-point drop in realized yield would reduce that retained amount by $5 million, assuming balances and the split stay unchanged. Raising the partner share by 10 percentage points at the original yield would cut retained income by another $3 million. The report says these are arithmetic illustrations, not estimates of any company’s contractual margin.
Tether’s disclosures look different. The company reported about $1.5 billion in net operating profit for the second quarter of 2026, while its BDO-attested reserve materials showed a $4.11 billion reserve buffer. In August, Tether said KPMG had issued an unqualified opinion on Tether International’s 2025 financial statements. The report distinguishes that annual audit from quarterly reserve attestations and says the signed opinion itself was not independently inspected. It also notes that the blanket claim that Tether has never undergone a financial-statement audit is now outdated. Even so, Tether’s figures and attestation scope are not directly comparable with Circle’s public quarterly filings.
Distribution contracts decide who keeps the spread
Much of the current competition happens inside familiar software. Wallets choose default dollar balances. Exchanges direct liquidity. Treasury platforms connect specific tokens to payment flows. Those decisions shape which reserves get funded and where customer habits form.
Global Dollar Network describes partner rewards tied to USDG minting, custody and acceptance. Open USD shows a different structure. Open Standard created the product, Bridge is the issuer and Stripe integrated OUSD into its payments and financial infrastructure. Eligible Open Standard partners can receive rewards linked to their OUSD activity. Stripe is one of Open Standard’s founding companies, not the sole owner of the arrangement. These structures show how distribution access can claim part of reserve income, but public descriptions do not establish realized margins or partner retention.
Branding adds another accounting problem. A partner can present a dollar product under its own name while another entity issues the underlying liability, manages reserves and handles redemption. The visible product name says little about contractual roles. Supply analysis has to look through the wrapper to the backing asset. Profit analysis has to follow the agreements that allocate investment income, rewards and service fees.
Vertical integration may improve an operator’s position, but ownership alone does not guarantee attractive margins. Mastercard said in August 2026 that it had completed its acquisition of stablecoin infrastructure provider BVNK. The announcement confirms a completed transaction, not realized cost advantages, integration outcomes or a new revenue run rate. Stripe’s ownership of Bridge gives it the ability to combine issuance infrastructure with products used by merchants and developers. Whether those combinations can hold pricing depends on service reliability and the value they add to customer workflows.
Enterprise payments are a large estimate with limited verification
Allium classified $134 billion of payment volume in the first nine months of 2026 as business-to-business transfers. Consumer-to-business transfers totaled $112 billion, business-to-consumer $63 billion and consumer-to-consumer $173 billion. Adding the three categories that involve at least one business yields $309 billion, about 64% of reported payment volume. A narrower measure looks at what enterprise-labeled wallets actually received: B2B plus C2B equals $246 billion, or about 51%. But Allium’s enterprise labels also include institutions, so neither figure proves an equal amount of trade invoicing.
Allium also tagged transfers by purpose: $111.8 billion for procurement, $116 billion for business operations, $29.3 billion for disbursements, $172.5 billion for peer-to-peer activity and $52.3 billion with no purpose label. Those figures are useful for understanding transaction patterns. They are not enough to determine what share of the model corresponds to completed commercial obligations without verified invoices, payroll files and payment receipts.
The report argues that the most promising payment use cases are likely to appear where existing financial infrastructure is expensive or hard to use. An importer may need to pay suppliers in dollars when local banks cannot provide FX in time. A multinational may want subsidiaries to rebalance cash outside local banking hours. A platform may need to pay contractors across several markets. Those needs vary by corridor, payment size, recipient requirements and local licensing. Stablecoins may solve one part of the task while leaving other frictions in place.
The more meaningful commercial benchmark is repeat usage by the same verified businesses after incentives and promotional pricing end. A supplier-payments product should be judged by matched invoices, funded customers, completed settlements, repeat months and contribution after compliance and payment costs. A treasury platform can be valuable even with fewer transactions if it reduces idle balances and operational delay. Counting addresses or transfers obscures both kinds of economic return.
Cheap onchain execution does not mean cheap end-to-end payments
Low network fees are a real technical achievement. Allium’s September comparison showed that seven of the eight listed networks had transfer fees below $0.01, while Ethereum was higher at $0.1352. Those figures represent network execution costs under the study’s chosen methodology. They do not include local-currency conversion, bank charges, prefunding, sanctions screening, fraud, failed payments or customer support. Tron was not included in that chart because its resource and fee model is not directly comparable.
Businesses buying payment services care about how much money reaches the recipient in usable form and when it arrives. Relevant costs include explicit fees, realized FX spread, time tied up in funding intermediaries, exception handling and the expected cost of failure. The World Bank’s remittance pricing methodology likewise treats exchange rates and speed as core comparison points alongside transfer fees. A sub-cent onchain transaction can therefore coexist with an expensive end-to-end payment.
The report gives a simple example. On a $100,000 cross-border supplier invoice, the stablecoin leg might cost $0.01, but if the provider charges 40 basis points for conversion and payout, the quoted variable cost is $400. If a bank offers comparable delivery for $250, the onchain route is not cheaper on that basis. But if the bank requires two days of prefunding and the stablecoin route can pay out the same day, the conclusion may reverse. A proper comparison should price the days of capital tied up using the customer’s actual cost of capital, verify recipient-market availability and hold service levels constant. The report says these figures are not market-wide cost estimates.
Working capital can matter more than the quoted payment fee. A multinational that pays daily may have to pre-position cash with several local intermediaries. A reliable stablecoin corridor can release part of that balance and improve capital efficiency. In thin markets, though, providers may need to hold extra inventory because of poor offshore liquidity and settlement delays. Those savings or costs belong in the treasury model and should be measured against actual funding needs and transaction volume.
Processors face an even tighter calculation. The report assumes a provider earns 10 basis points of gross service revenue on $10 billion of qualifying annual flow, or $10 million. Counterparty and variable expenses consume 6 basis points, or $6 million, leaving $4 million of contribution before fixed overhead and losses. If competition compresses the take rate to 8 basis points while costs stay at 6, contribution falls to $2 million on the same flow. The provider would need to double comparable volume to preserve the original $4 million contribution. The example assumes unchanged unit costs and no extra operating leverage. It is not a quoted industry take rate.
Liquidity, not just gas fees, determines network position
Tron accounted for about two-thirds of Allium’s adjusted transfer value and 66.6% of classified payment volume in the first nine months of 2026. Ethereum remained the largest home of native stablecoin supply, while Solana and BNB held larger shares in some transfer-count measures. Each metric captures a different competitive attribute. Supply shows where assets are issued. Held balances show where liquidity sits. Payment transfers describe an inferred subset of flows. None of them directly measures end-user satisfaction or onchain profitability.
Tron’s position is hard to explain through gas pricing alone. USDT availability, existing service providers, exchange connectivity and familiar transfer workflows all give users reasons to return. A cheaper chain may be unattractive for an otherwise identical payment if local cash-out partners are missing. A network with higher execution costs can still serve institutional users if liquidity, reliability, control and integration offset those fees.
Recent launches make that distinction visible. As of the end of September, Allium showed $1.73 billion in stablecoins held on Plasma, $831 million on Robinhood Chain, $718 million on Tempo and $528 million on Arc. In September classified payment activity, Plasma recorded $168 million and Tempo $24 million, while Arc and Robinhood had not yet been fully classified. Missing classification does not mean zero demand. Held balances also need to be distinguished from native issuance, which can be much smaller when assets are bridged from other networks.
Early liquidity figures say little about retention. After a full reporting quarter, average active balances, identifiable paying customers, repeat transactions per funded account and offshore corridor coverage would be more useful indicators of network adoption. For investment work, onchain fees, validator revenue, subsidies and any cash flows available to token holders should be listed separately. Settlement notional alone does not value a token.
Cards connect stablecoin balances to existing merchant networks
The simplest retail stablecoin product may look like an ordinary card. Customers fund spending with digital dollars, merchants accept familiar card-network payments and usually receive local currency. Acceptance can grow through existing acquiring relationships. For merchants, the stablecoin layer is often invisible.
Allium estimated visible stablecoin-funded card spending at $3.9 billion from January through September 2026, about 10 times the level in its dataset a year earlier. KAST, Ether.fi and Karta were among the largest visible programs. But the headline mixes different measurement types. About 19% of spending is supported by purchase-level observation, while most of the rest comes from settlement information. Settlement can be netted and may not match the amount or count of underlying purchases. This is a series for covered programs, not a complete global count of card spending funded by stablecoins.
The detailed purchase sample has its own denominator. Programs representing 36% of the headline spending provided 23.8 million observed purchases. Transactions below $50 made up about 83% of purchase count but only 17% of value. Purchases of $1,000 or more were just 0.7% of count yet 39% of value. Those patterns are informative within the sample. Applying them to the full $3.9 billion without weighting would imply a precision the dataset does not support.
The economics are also more complex than a single transfer. A card program may earn interchange-related revenue, service fees or FX spread. It may also have to pay issuer processors, card networks and liquidity counterparties, while funding user incentives. A stablecoin top-up creates one onchain record, a card purchase creates an authorization and settlement entries may appear later. All three can point to the same purchase. Without purchase-to-settlement reconciliation, folding card activity into broad onchain payment totals risks double counting.
Different digital dollars create different legal claims
A dollar stablecoin, a tokenized bank deposit and a tokenized money market fund can share the same blockchain interface while giving holders very different legal claims. Stablecoin holders generally rely on the issuer’s redemption structure and the quality of qualifying reserves. Tokenized deposits represent bank liabilities and are governed by their own contracts, prudential rules and account-eligibility terms. Tokenized funds are investment interests with portfolio-level and fund-level rules. Redemption windows, transfer restrictions, yield arrangements and loss protections can differ sharply across these instruments.
Treasury managers choose among them based on the claim they need to hold. Transferable settlement dollars may favor a stablecoin with reliable redemption and broad counterparties. Corporate banking clients may prefer tokenized deposits inside existing treasury arrangements. Yield-seeking cash management may introduce tokenized fund shares and their redemption terms. These products can run on related technology without being substitutes in legal, liquidity or economic exposure.
The competition also has balance-sheet consequences. Stablecoin reserves can include bank deposits and government securities, so growth in stablecoins does not necessarily remove an equal amount of funding from the banking system. It can change who the depositor is, the maturity structure of claims and who earns the spread. If customers move directly from bank deposits into stablecoin balances backed by short-dated Treasuries, the funding effect may differ from a move out of brokerage cash or another stablecoin. The report says the broad claim that every new stablecoin dollar displaces one dollar of bank deposits is unsupported.
Banks have reasons to issue their own tokenized liabilities or provide services to issuers. They bring regulated customer relationships, cash management, credit underwriting, compliance systems and access to traditional payment infrastructure. Stablecoin specialists may offer broader public-chain distribution and different operating hours. Neither model is universally better. Licensing, customer eligibility, recipient settlement preferences and full transaction cost decide the outcome.
Availability and redemption quality can beat an apparently competitive price. When a recipient is dealing with a bank outage, sanctions review, onchain congestion or a liquidity squeeze in offshore corridors, reserve assets offer limited comfort. Contracts determine who pays for failed payments, refunds and operational recovery. Investors evaluating a payment business need those loss-allocation terms alongside the advertised settlement time.
Dollar demand and cross-border settlement are not the same market
Demand for dollars and cross-border payments are related, but they are not interchangeable. A household may hold USDT because of local-currency volatility. A trader may need dollar collateral. A business may receive export proceeds and keep them in dollars without moving value across borders. Those activities support the economic usefulness of stablecoins even if the token is never used to pay a merchant.
Allium’s clearest geographic result comes from a constrained sample of non-custodial wallets where both ends can be located. That sample covers only about 3% of classified payment value. Within it, 42% of B2B value, 39% of C2B, 34% of B2C and 22% of C2C was cross-border. Those figures describe only the locatable sample and cannot establish the global cross-border share of stablecoin payments. Custodial-wallet users, uncertain locations and country-level labeling differences could materially change the result.
The revenue opportunities are different. Demand for dollar balances creates reserve-income opportunities even when customers transact infrequently. Replacing part of correspondent activity can generate payment fees on relatively small balances that turn over quickly. Public data captures the footprint of both activities better than it separates them. A company priced as a reserve-income business should be measured by persistent holdings. A cross-border processor needs evidence of executed customer payments and realized margins by corridor.
Regulation is changing the cost of holding and moving dollars
Rules taking shape in the United States and the European Union affect who can issue stablecoins, what reserves they can hold, what services they can offer and what rights users receive. The U.S. GENIUS Act was signed into law in July 2025. Its effect depends on the statutory timetable and implementing rules, including the earlier of 18 months after enactment and 120 days after final implementing rules are issued. The law addresses licensed payment stablecoin issuers, reserve requirements, redemption and restrictions on yield paid by issuers. Regulatory proposals put forward in 2026 by the Office of the Comptroller of the Currency and the Treasury Department remain proposals, not final rules.
In Europe, the MiCA framework places e-money tokens and asset-referenced tokens under a separate authorization and conduct regime. In October 2026, the European Securities and Markets Authority clarified supervisory expectations for crypto services involving unauthorised stablecoins. The legal status of a token or service cannot be inferred simply from broad trading elsewhere. Customer reach depends on the specific issuer, jurisdiction, intermediary and business activity.
Compliance is both a cost and a barrier to entry. It can protect incumbents that already hold approvals and banking relationships, and it can constrain business models built around rewards, reserve assets or open distribution. A stablecoin issuer applying for a trust bank charter has only filed an application, not secured approval. That distinction matters when forecasting what business it can conduct or assigning a valuation premium to regulatory positioning.
The report repeats a practical point here. Availability and redemption quality can outweigh a nominally attractive price. For a recipient waiting through a bank outage, sanctions review, onchain congestion or a liquidity squeeze in offshore corridors, reserve assets alone do not solve the problem. Loss-allocation terms for failed payments, refunds and operational recovery matter as much as the settlement time in marketing materials.
Agent payments show volume growth, but little revenue evidence
The fastest-growing category in Allium’s report is machine-oriented payment activity, but the dollar amounts remain small. The study identified 68.3 million agentic transfers worth $3.7 million in the third quarter, versus 34.1 million transfers worth $3.9 million in the prior quarter. Average value was about $0.05 per transfer, and the September median was much lower. Transfer count doubled while total spend fell.
x402 and the Machine Payments Protocol developed by Stripe and Tempo support software-initiated purchases of data, compute and other services. They may reduce the high account-opening cost associated with small, irregular payments. The two observed series use different filtering and counting rules, and a small number of gateways dominate the recorded activity. The value that ultimately reaches merchants is still not well verified. These protocols show functional feasibility. Durable paid demand still needs merchant-level evidence.
The right metrics for this market are externally funded customers, repeat merchants, unincentivized volume, refunds and net revenue. A thousand sub-cent requests from one integration may reveal a workable technical architecture while generating less revenue than a standard software subscription. Agentic settlement is worth watching as infrastructure. The current figures do not support near-term financial forecasts based on transaction growth alone.
The profitability test is short and unforgiving
The report’s closing argument is that stablecoin infrastructure already serves a meaningful stock of digital dollars. Under Allium’s classification, payment activity has grown. Circle’s accounts show how much reserve income can be ceded to distribution partners. Tether’s dominance in classified payment value shows that liquidity and familiar counterparties still matter. Card programs extend reach through merchant networks that predate stablecoins. The evidence supports several viable businesses, not a single winner-take-all layer.
The base case is conditional. Issuers that retain large and durable balances can generate substantial reserve income, but profitability is sensitive to rates and to the share claimed by distributors. Companies that control customer accounts, payroll systems, treasury workflows and checkout have paths to broader monetization, but they still need to prove retention and positive contribution. Infrastructure firms can earn durable fees by solving compliance, liquidity and reconciliation problems customers do not want to handle themselves. Providers of replaceable routing or transfer technology face the clearest fee-compression risk.
That view could change if evidence emerges that issuers themselves drive customer preference. If users choose a token for redemption quality and liquidity even when distributors push their own branded coins, more bargaining power may remain with the issuer. The opposite risk sits with integrated platforms: balances accumulated through incentives may disappear, and payment margins may thin once discounts end. The size of the underlying commercial market also needs more verification, which depends on whether providers can match classified transfer sequences to invoices, sales and completed customer payments.
The investment scorecard is short. Track average active balances and retained reserve income after payment partners. Match transfers to completed customer obligations net of reversals. Then calculate processing contribution after variable costs and repeat activity within an identified customer base. Those measures connect the two sides of the business: revenue when dollars are held and revenue when they move.
The economic test is simple. Measure retained income per dollar of customer balance and contribution per completed payment after partner costs. Companies that can defend those two numbers under lower rates, thinner processing spreads and tighter regulation are the ones that justify their valuations. Transfer volume alone is not enough.