
The key question for bitcoin investors is whether the market bottom was set in early February, when BTC briefly slipped toward $60,000. No single indicator can confirm that on its own, but several on-chain and derivatives metrics point to the harshest part of the correction being over, especially now that bitcoin is trading back above $77,000.
Realized Cap is stabilizing after a sharp decline
The first metric is Realized Cap, which values bitcoin based on the price at which each coin last moved on-chain. Unlike market capitalization, which uses the current trading price, this measure reflects the aggregate cost basis of holders and is often used to track capital entering or leaving the network.
Before the selloff, Realized Cap peaked near $1.12 trillion. As bitcoin fell more than 50% from its October record high, the figure dropped to roughly $1.08 trillion. That represents a major destruction of paper wealth and ranks among the largest such drawdowns on record. The metric has now started to stabilize and form a base, a pattern that resembles the setup seen around the lows of the 2022 bear market.
RHODL Ratio shows long-term holders still control supply
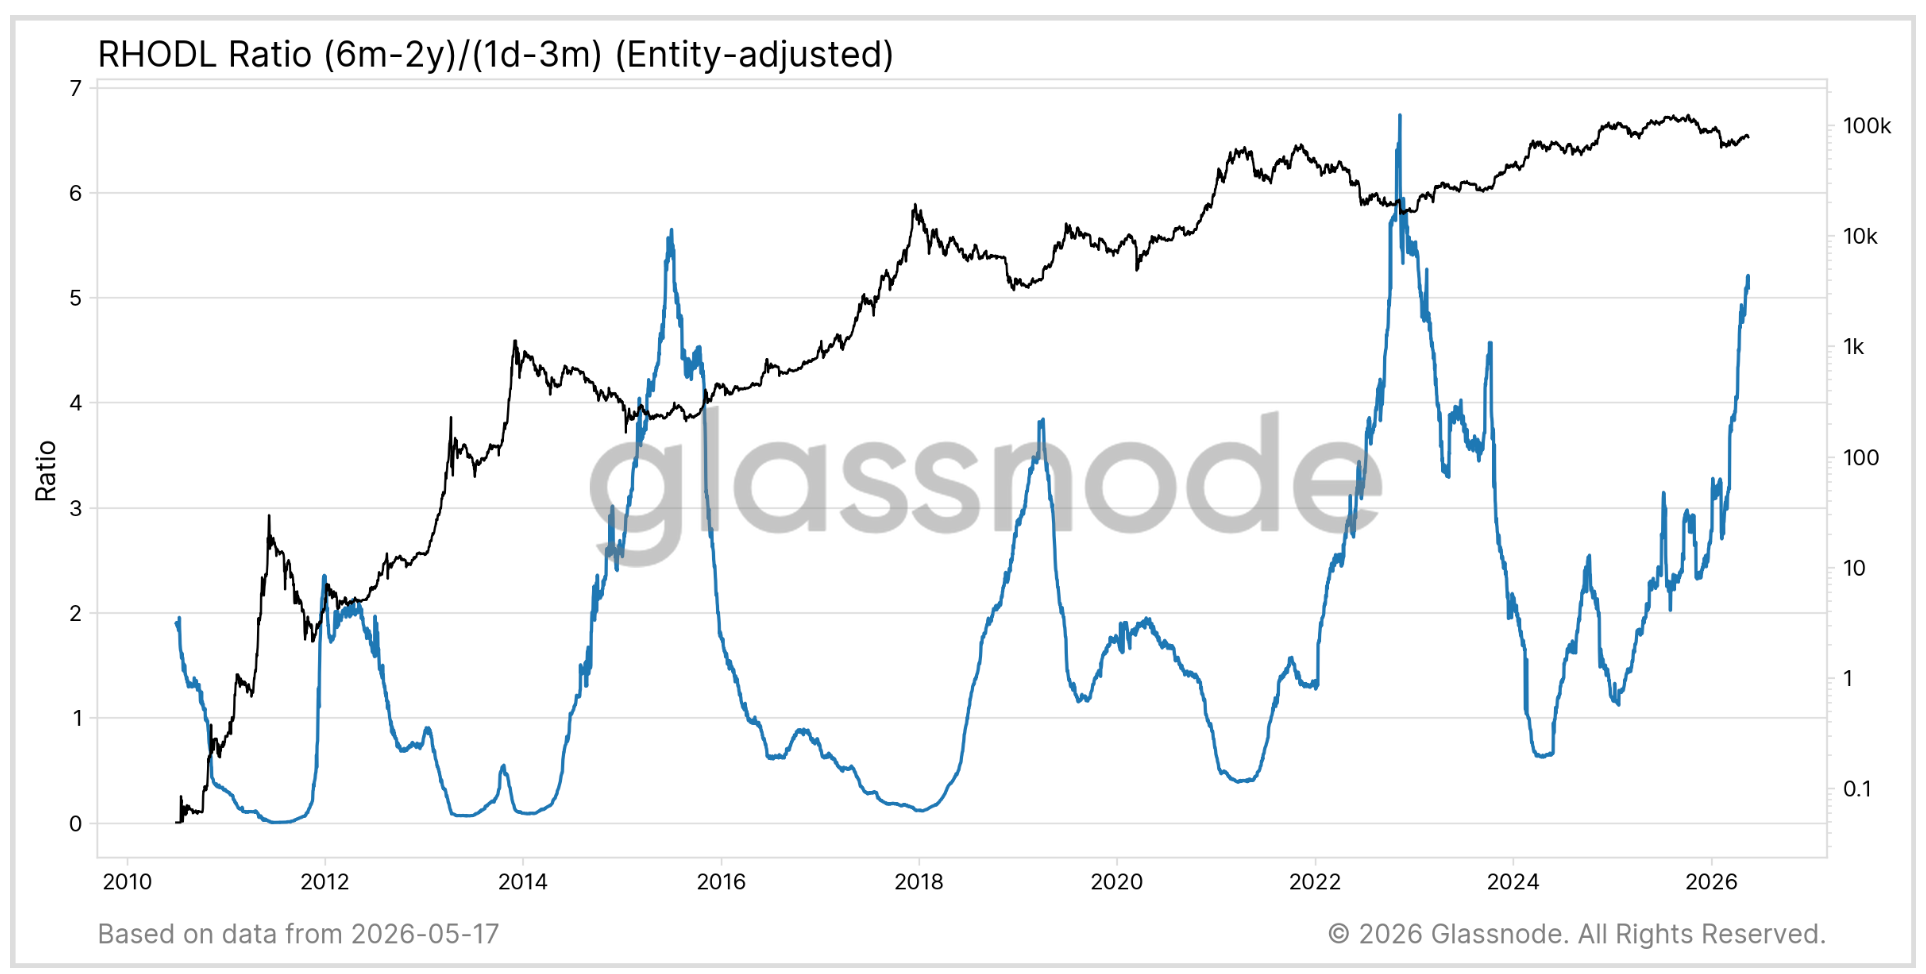
The second signal comes from the RHODL Ratio, which compares the wealth held by longer-term holders, defined here as those holding for six months to two years, against newer participants holding for one day to three months.
That ratio is now above 5, its third-highest reading on record. The only stronger readings came during the cycle bottoms in 2015 and 2022. The takeaway is simple: long-term holders remain dominant in the supply structure. Since February, long-term holder supply has increased by more than 400,000 BTC.
Negative perpetual funding lasted unusually long
The final metric comes from the derivatives market. Perpetual futures funding rates, the payments exchanged between long and short traders to keep futures prices aligned with spot markets, stayed negative from February through May. That stretch was one of the longest on record.
Historically, sustained negative funding reflects deep bearish sentiment and crowded short positioning. Once selling pressure begins to run out, that kind of setup often appears near market bottoms. Similar conditions showed up during the March 2023 Silicon Valley Bank crisis, the August 2024 yen carry unwind, and the April 2025 tariff-driven selloff. Each of those periods later coincided with major bitcoin lows.