
Labor Day closure shifts attention to the week ahead
U.S. stocks were closed on Monday, Sept. 7, for Labor Day, with no trading and no economic releases. The focus, then, is on the week ahead rather than that evening’s market action. All figures in this report are based on the Sept. 4, 2026 U.S. market close.
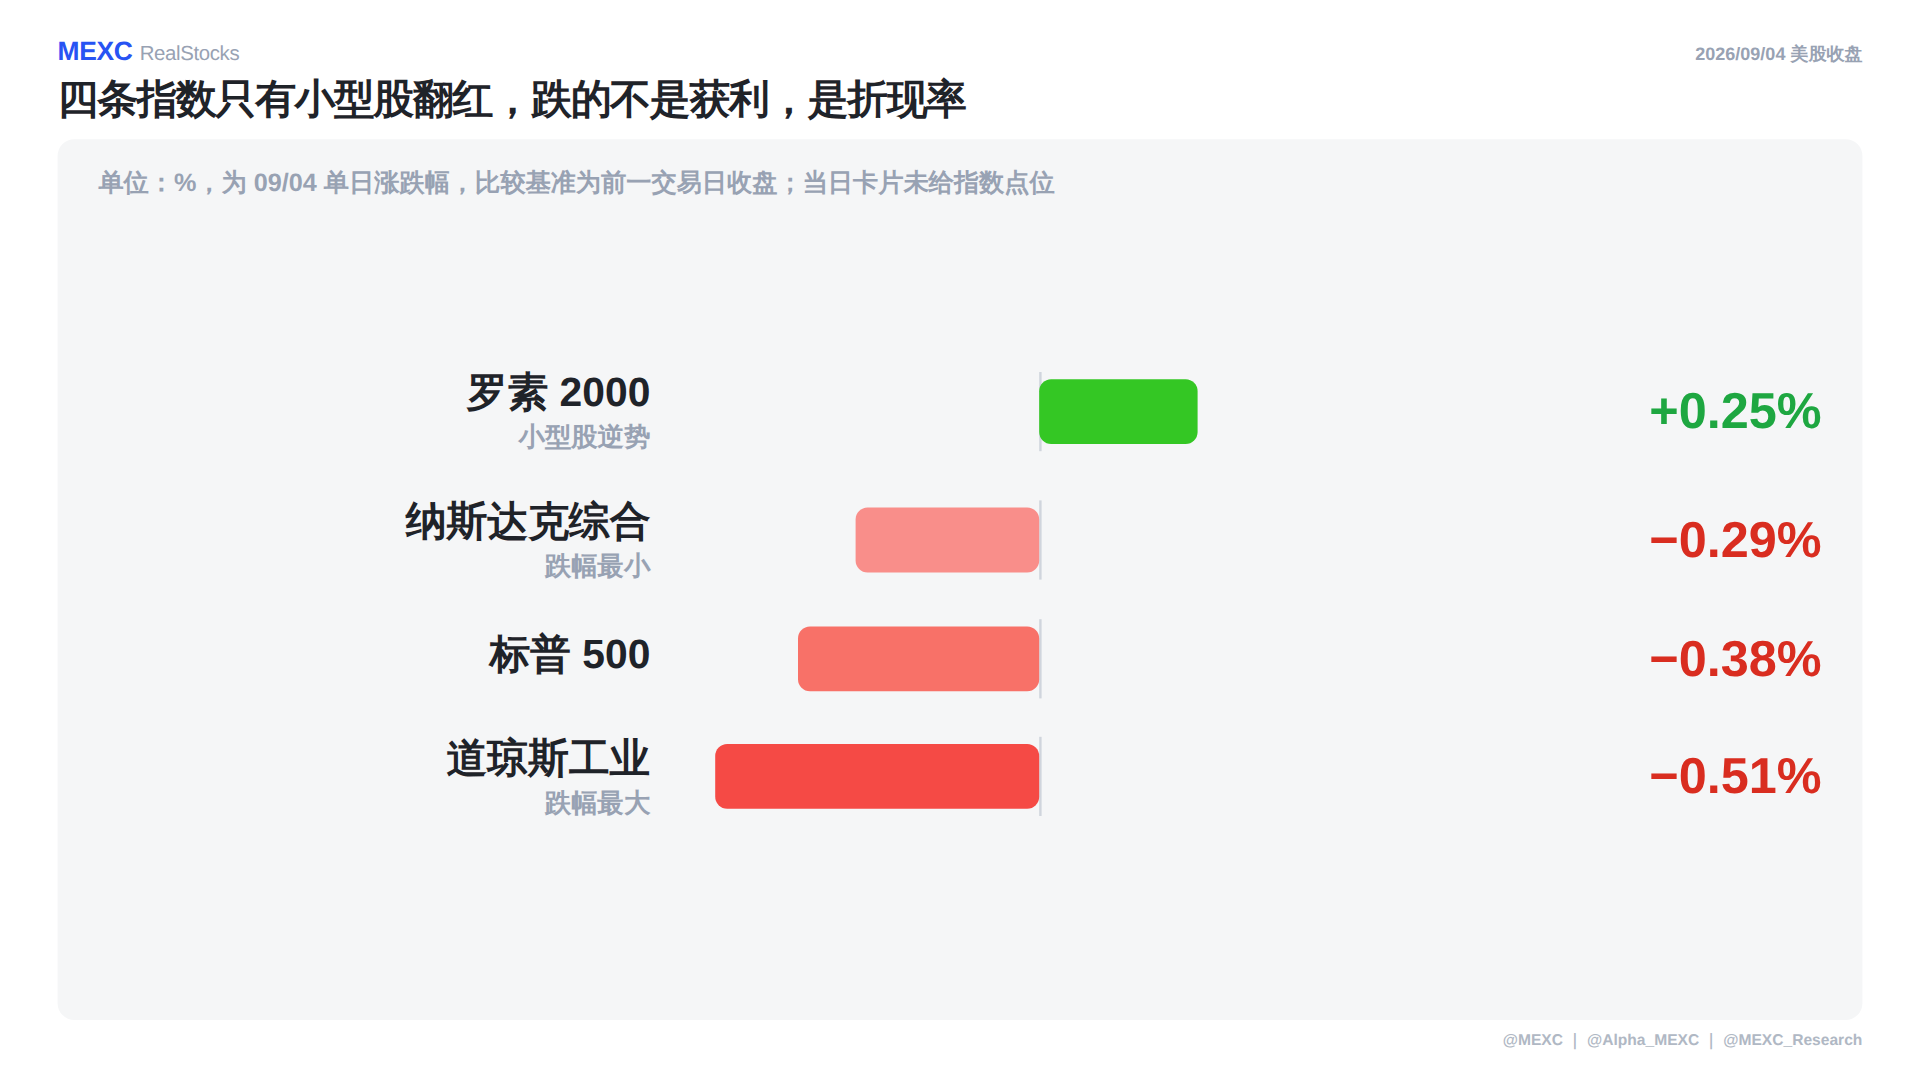
The previous trading day was Friday, Sept. 4. Of the four major indexes discussed in the source material, only the Russell 2000 finished higher, up 0.25%. The Dow Jones Industrial Average fell 0.51%, the largest decline of the group. The S&P 500 slipped 0.38%, and the Nasdaq Composite lost 0.29%, the smallest drop among the three decliners.
The source ties that weakness to the same day’s labor data. August nonfarm payrolls increased by 162,000, far above the market expectation of 55,000, while the unemployment rate held at 4.1%. In the current policy setting, stronger labor data was read less as growth support and more as a sign that money could stay expensive. The 2-year U.S. Treasury yield climbed to 4.374% that day, a one-year high, and market pricing for a September rate hike briefly rose to around 50%.
That matters because the market was not repricing one-day changes in corporate profits. It was repricing the discount rate applied to future cash flows. When that rate moves up, assets with cash flows pushed further into the future tend to take the first hit. That helps explain why the three large-cap-heavy indexes fell, while small caps, with lower valuations and shorter duration, managed to finish in positive territory.
KLAC was the day’s standout, even without a company announcement
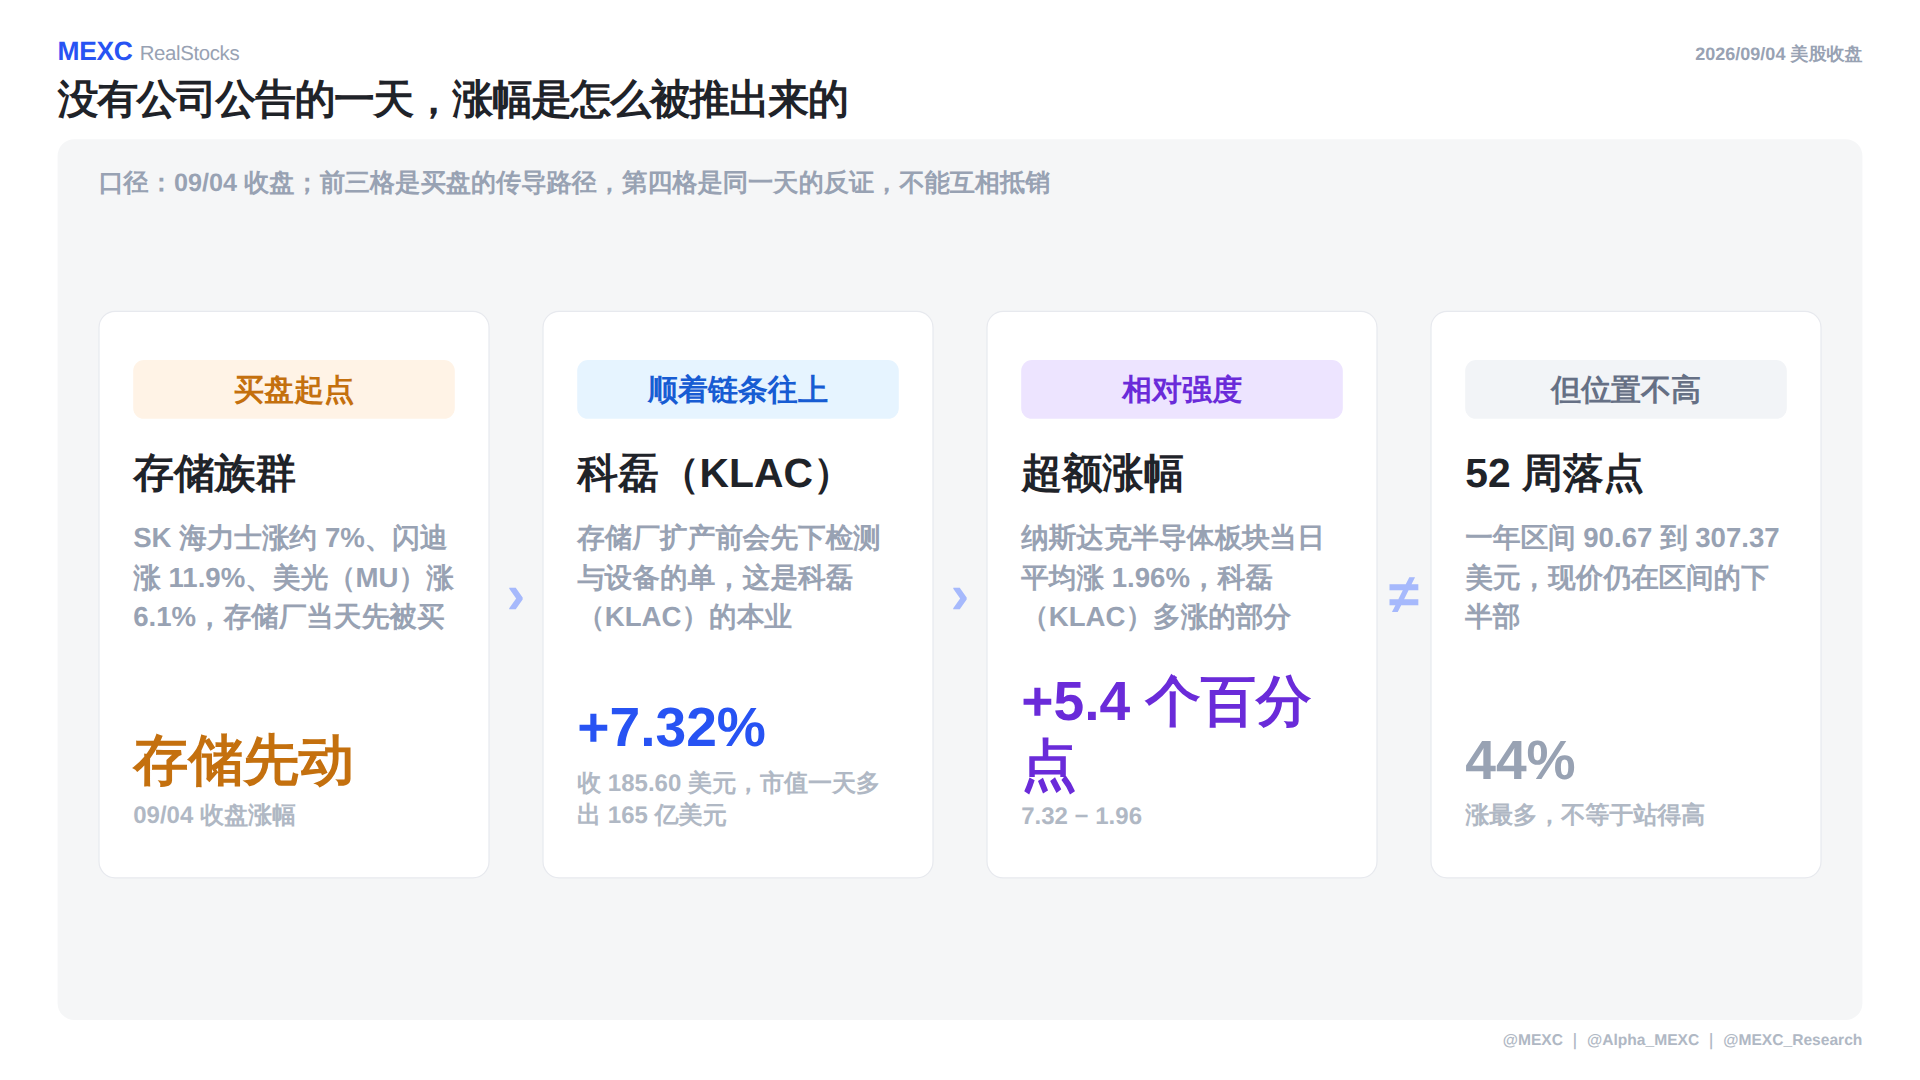
KLA Corp. (KLAC) was the session’s biggest focal point. The stock closed at $185.60, up 7.32% on the day. According to the source, that added $16.5 billion to its market capitalization, lifting it to $242.4 billion. KLAC itself did not release any corporate announcement that day.
The source breaks KLAC’s profile into five dimensions: peer ranking at 100, industry valuation temperature at 93, peer relative strength at 77, volatility control at 62, and trend position at just 44. The gap between those readings is the part worth watching.
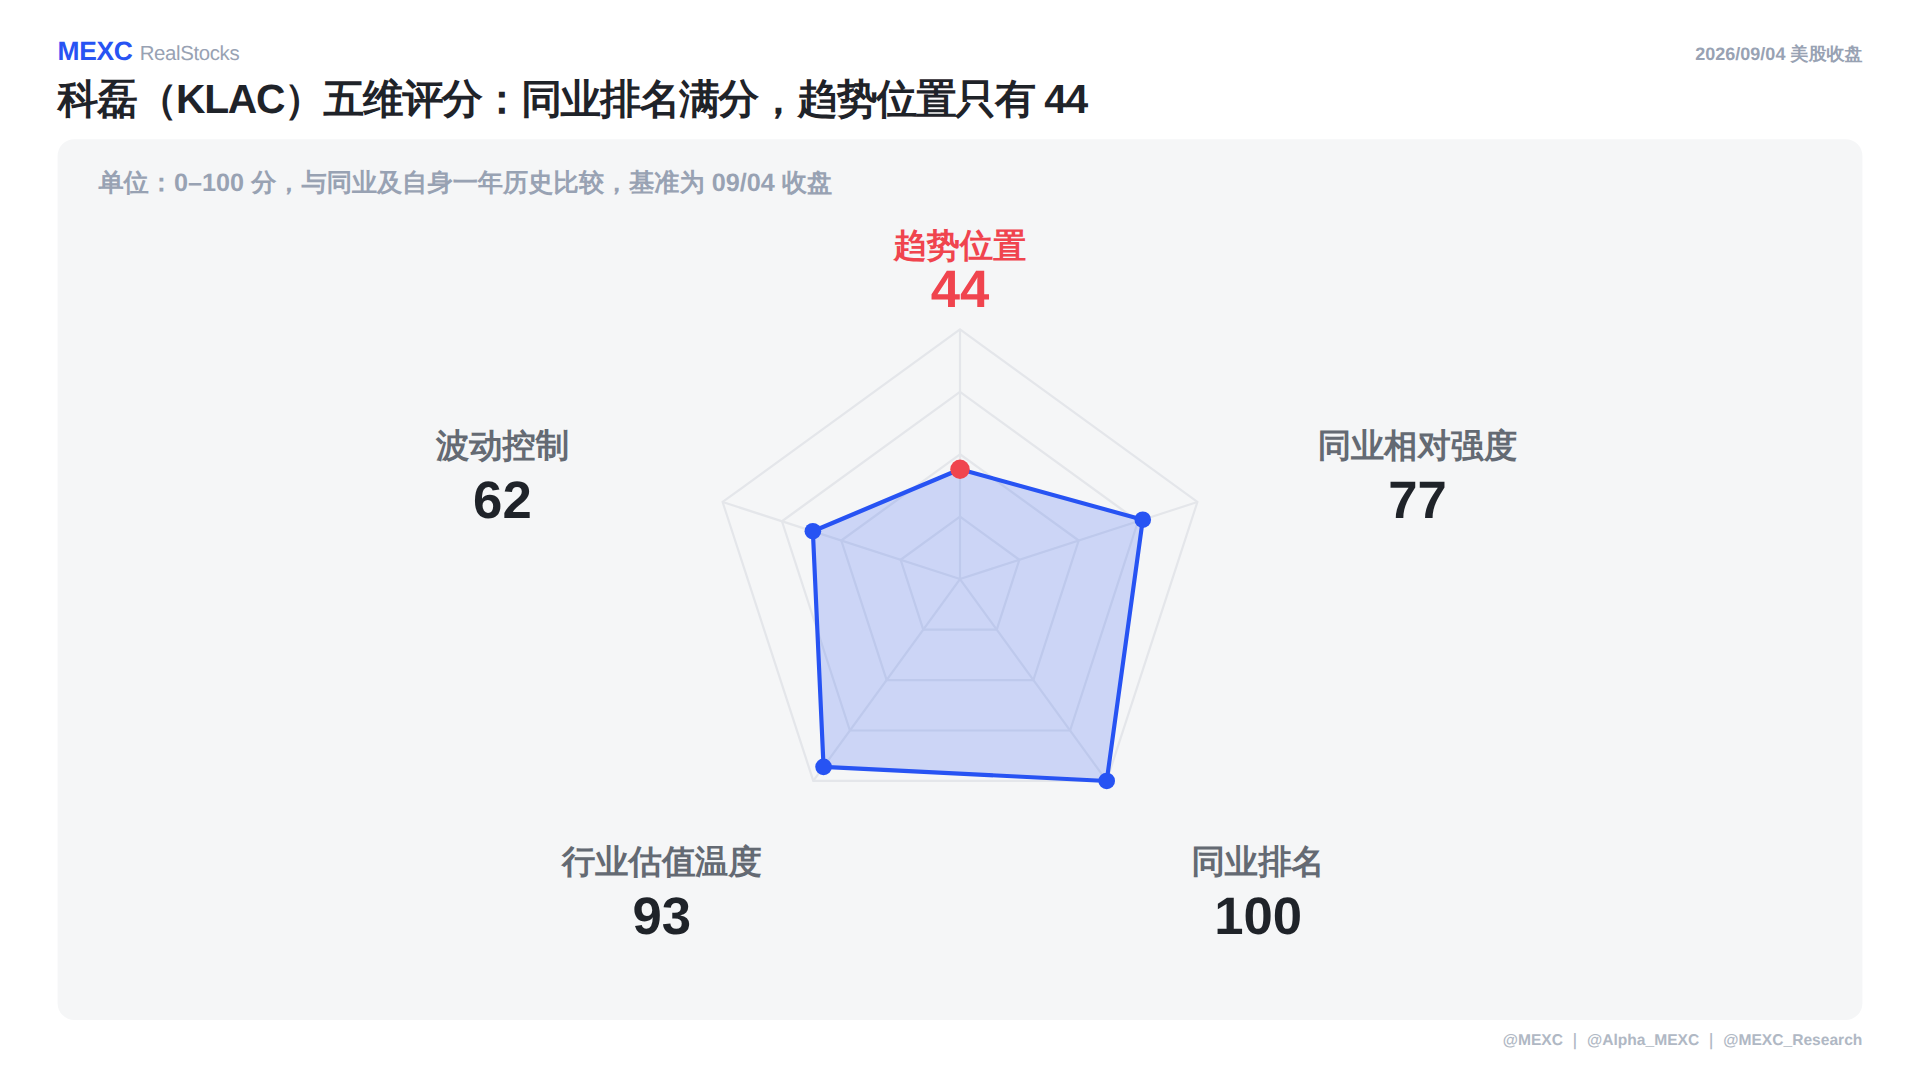
A peer ranking of 100 means no stock in its comparison group was stronger that day. A trend position of 44 means the stock still sat in the lower half of its own one-year range. The 52-week band given in the article runs from $90.67 to $307.37, and the Sept. 4 close of $185.60 places KLAC at 44% of that range.
That is the distinction between rising the most and standing the highest. Looking only at the 7.32% gain can make the stock appear like a fully established momentum name. Adding the trend-position metric changes the picture: the move came from a lower level inside the stock’s own annual range.
Volume adds another layer. Trading volume was in line with the 30-day average, not above it. In the source’s framing, that suggests the move was not driven by a sudden wave of fresh money. It looked more like the same pool of capital changing positions inside the sector. In other words, a repricing move rather than a volume-led breakout.
Semiconductor supply chain split: upstream advanced while downstream sold off
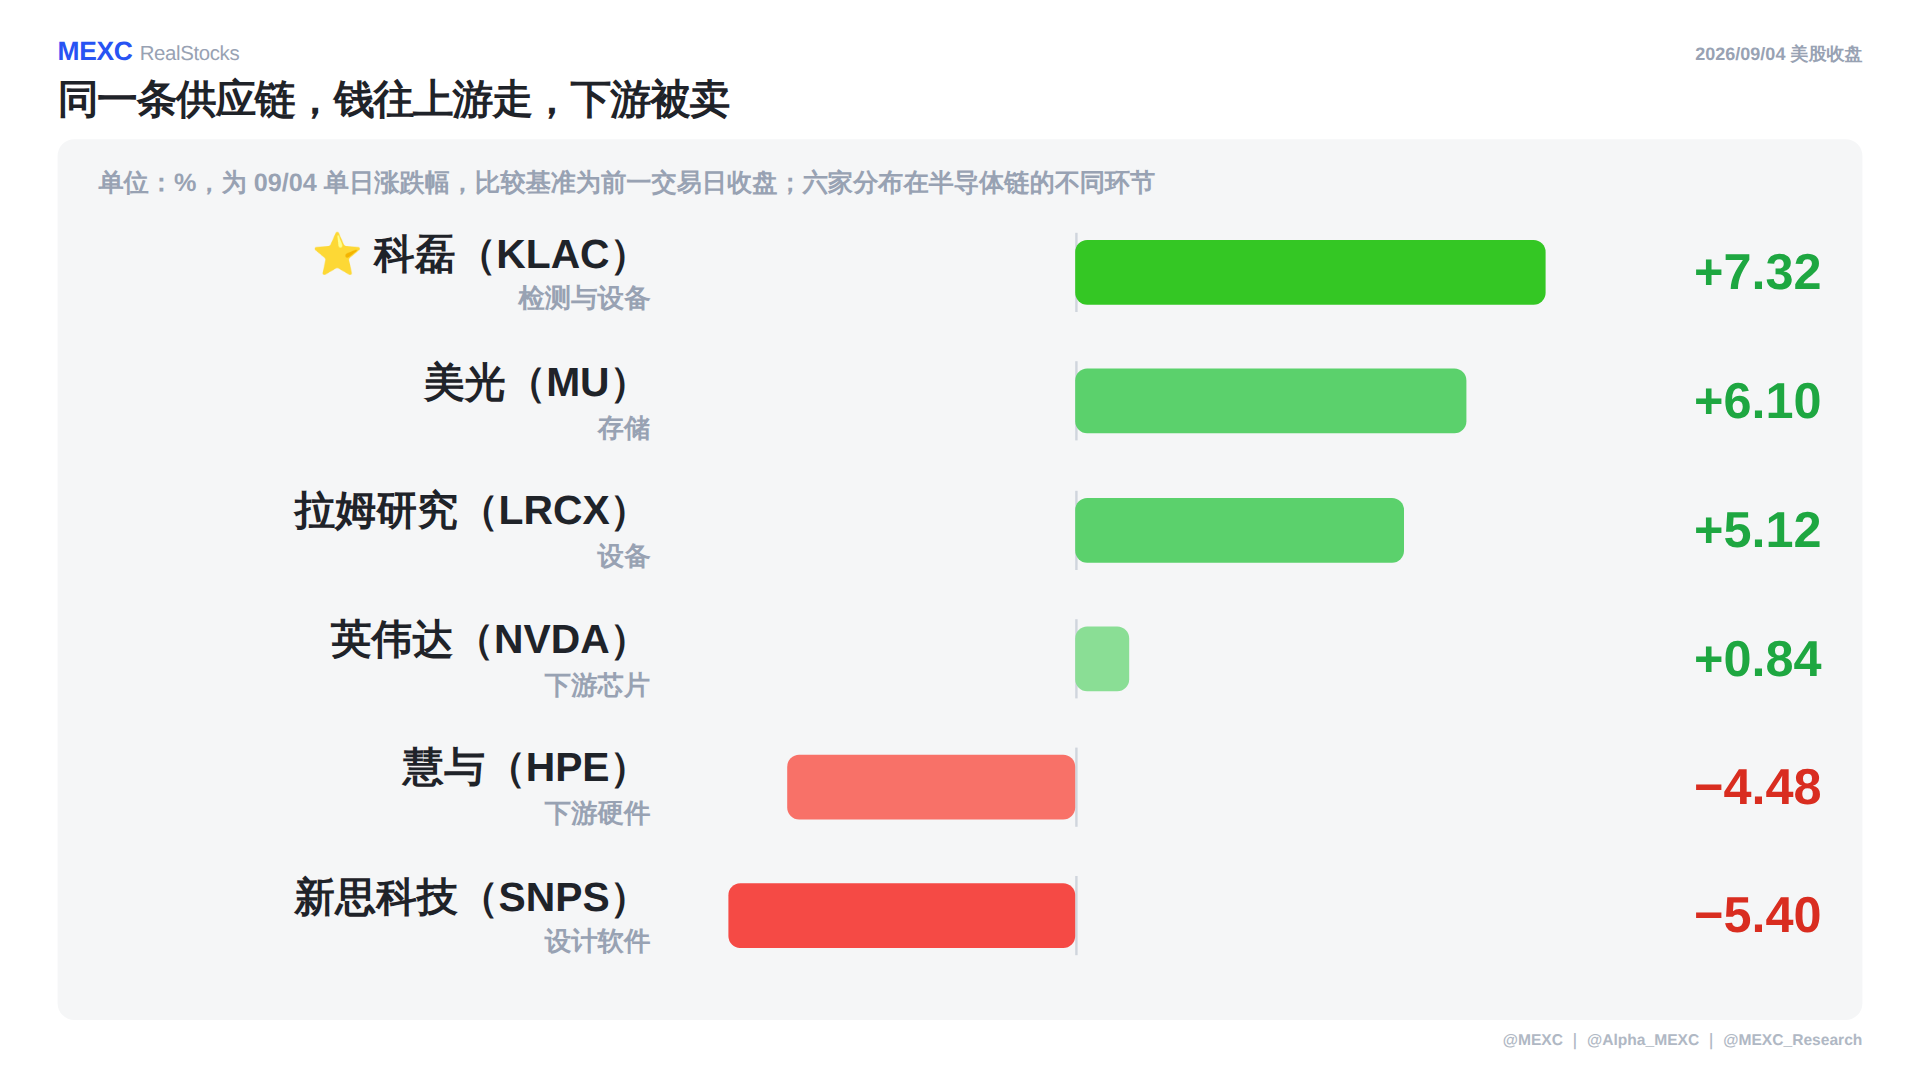
The semiconductor chain did not move in one direction on Sept. 4. The six names cited in the article finished as follows: KLAC up 7.32%, Micron (MU) up 6.10%, Lam Research (LRCX) up 5.12%, Nvidia (NVDA) up 0.84%, Hewlett Packard Enterprise (HPE) down 4.48%, and Synopsys (SNPS) down 5.40%.
The key point is not simply who rose the most. It is where the dividing line sat. The three gainers at the top were all in upstream equipment and storage. The two losers were downstream hardware and design software. Opposite moves inside the same supply chain point to an internal rotation, not a broad-based buying wave. Money was pulled from downstream and redirected upstream.
Nvidia’s move is singled out in the source as a useful comparison. NVDA rose only 0.84%, the smallest gain among the advancing names. The explanation given is positional: Nvidia’s share price was already near its one-year high, so upside elasticity was naturally tighter. KLAC, by contrast, was still in the lower half of its 52-week range. The same amount of buying pressure could therefore produce a larger percentage move. The source is explicit that this is a difference in positioning, not a direct statement about which company is better.
Storage stocks moved first, then money traveled up the chain to tools and inspection
The article lays out the Sept. 4 move in steps.
- First, buying started in storage. SK hynix rose about 7%, SanDisk jumped 11.9%, and Micron gained 6.1%.
- Second, capital moved up the chain. The source says storage manufacturers place inspection and equipment orders before expanding capacity, and inspection is KLAC’s core business.
- Third, the stock’s move is compared with the broader group. The Nasdaq semiconductor group rose 1.96% on average that day, while KLAC climbed 7.32%, outperforming by 5.4 percentage points. That spread is the stock’s own relative strength in the source’s framework.
The article then adds a separate check that does not cancel out the first three points: KLAC’s 52-week position was only 44. The first set of facts explains why the stock rose that day. The last one explains where it still stood after the move. Those answers do not have to match.
The source also stresses one practical distinction. KLAC had no company announcement on Sept. 4. The rise came from a broader shift in capital toward equipment and storage names, not from fresh company-specific news. When a move is triggered by corporate disclosure, the reason is usually visible that same day. When it is driven by rotation inside a group, the underlying proof may not show up until the next earnings report, when actual order numbers are disclosed. Until then, the move remains an expectation rather than an earnings-verified fact.
Constellation Energy (CEG) appears in the article as a side example. The stock rose 4.88% to $298.96, while the Nasdaq independent power producer group gained 5.09% on average. The connection the source draws between CEG and KLAC is that both fit the same market preference: future demand locked in ahead of time. A nuclear plant sells future power output to data centers through long-term contracts; a storage maker places tool orders before capacity comes online, turning future output into current orders. In both cases, the market is buying revenue that has been secured in advance.
Apparel names split sharply on guidance: LULU fell 17.4% while ANF rose 4.3%
The article uses Lululemon (LULU) and Abercrombie & Fitch (ANF) to make a separate point about earnings and valuation.
LULU reported quarterly revenue of $2.4 billion and a gross margin of 60.5%, with profit ahead of market expectations. Yet comparable sales in the Americas fell 12%, and the company cut its full-year EPS target from 10.95-11.15 to 9.48-9.73. The stock dropped 17.4% that day to close at $100.61.
ANF reported quarterly revenue of $1.27 billion, a record for the same period, and its 15th straight quarter of growth. Operating margin improved from 17.1% to 19.9%, and the company raised its full-year EPS target from 10.20-11.00 to 13.10-13.60. Its shares rose 4.3% to $149.67.
Both companies delivered solid-looking recent quarters, yet their stock performance differed by 21.7 percentage points. The source’s conclusion is direct: the line that resets valuation is not revenue, and it is not gross margin. It is guidance. LULU lowered its earnings promise for the next year. ANF raised the equivalent figure. The market was repricing what each business could earn over the coming year, not what it had just earned in the prior quarter.
The article goes a step further and explains why. Share prices point to the future, not the quarter that just ended. Reported earnings describe something that has already happened, and the market often prices a large part of that in before the release. Guidance is the company’s public statement about what comes next. That is why one earnings report can contain two opposite messages at once: a win on the last quarter and a loss on the next year. In the source’s wording, the operating rule is simple: read guidance first, then read the quarter.
Inside one apparel lane, drawdowns differed by roughly 17 times
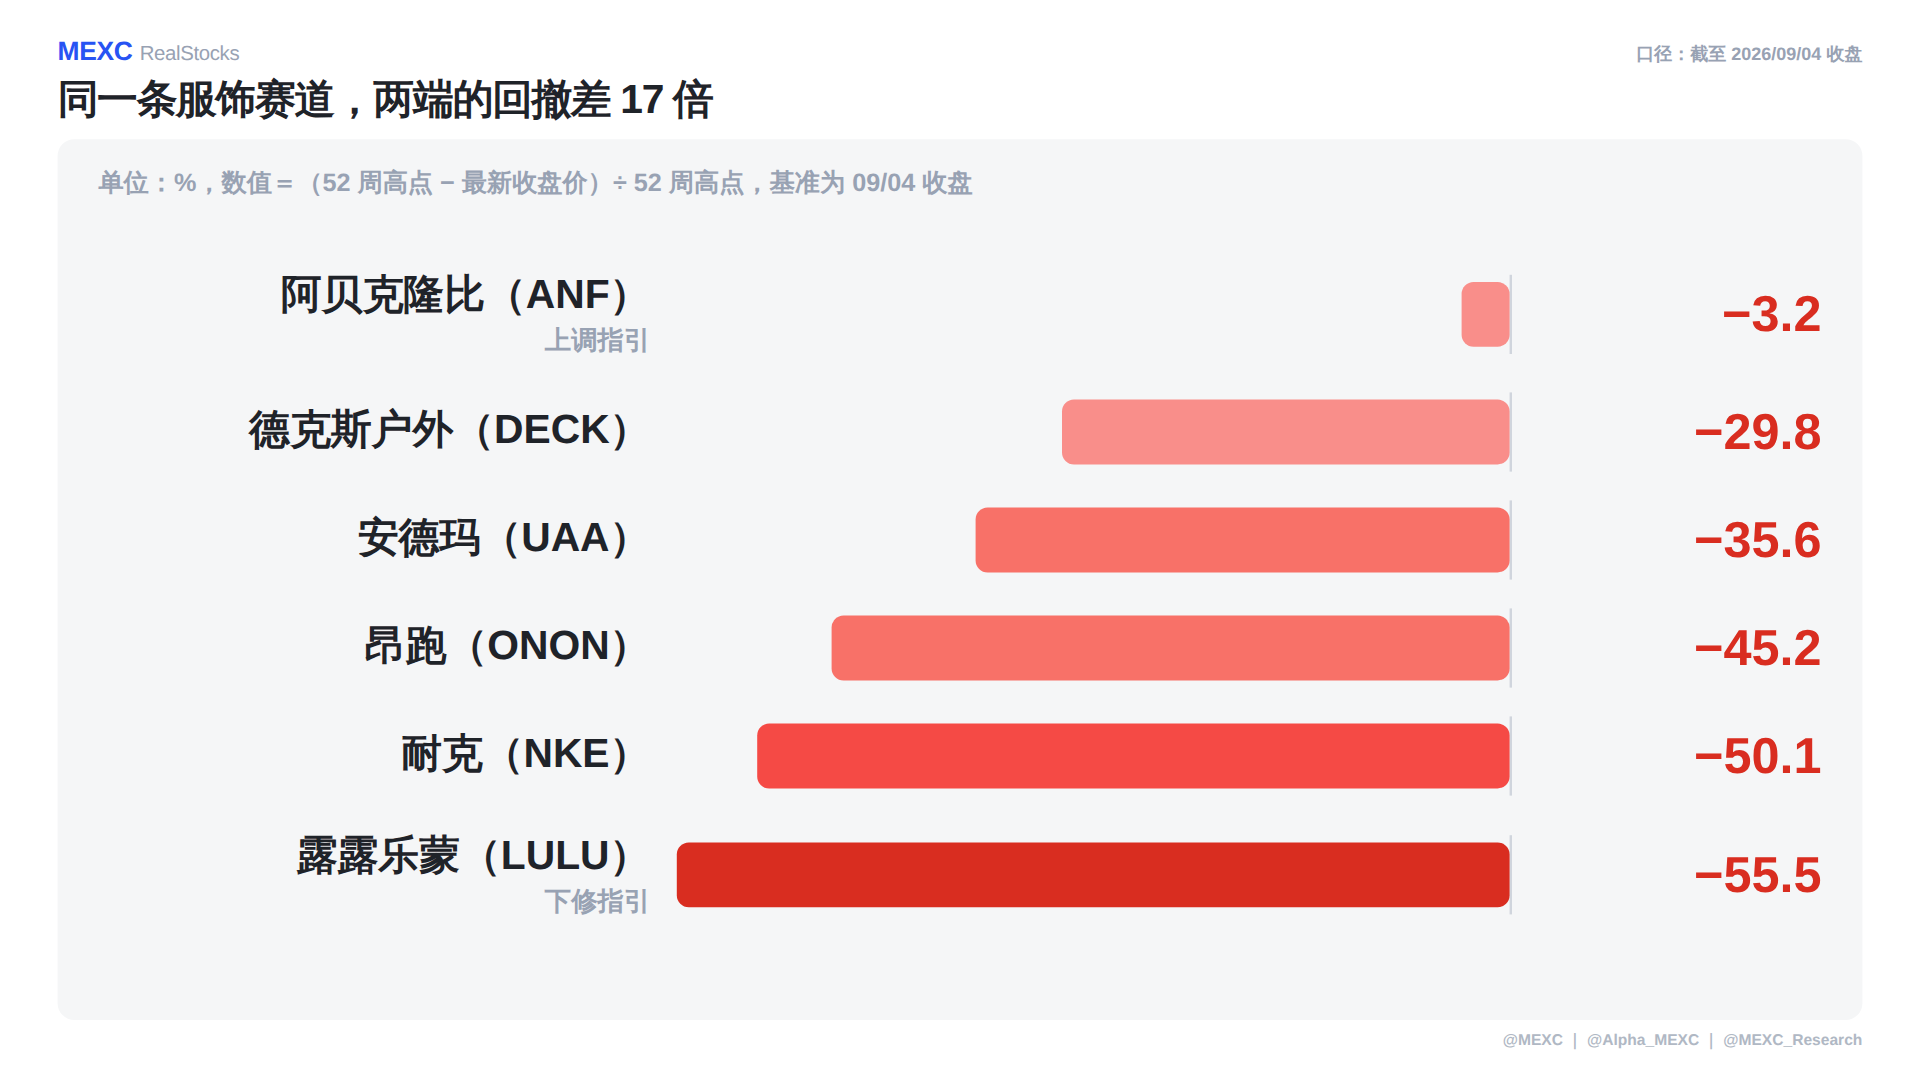
Using the Sept. 4 close and defining drawdown as the distance from the 52-week high to the latest close divided by the 52-week high, the article ranks six apparel names as follows: Abercrombie & Fitch (ANF) down 3.2% from its high, Deckers Outdoor (DECK) down 29.8%, Under Armour (UAA) down 35.6%, On Holding (ONON) down 45.2%, Nike (NKE) down 50.1%, and Lululemon (LULU) down 55.5%. The spread between the two ends is about 17 times.
The source uses that gap to show that even within the same consumer lane, under the same consumption backdrop, tariff setting, and inventory cycle, the market does not treat every company the same way. A company that raises guidance can trade near its high. A company that cuts guidance can be left more than halfway below its peak.

The article also includes a brief profile of ANF. The U.S. apparel group was founded in 1892. Its Abercrombie brand targets adult customers, while Hollister targets teenagers. The two brands share a supply chain and store network. The source says its operating margin improved from 17.1% to 19.9% this quarter not because it simply sold products at higher prices, but because it reduced the amount of inventory that could not be sold.
This week’s macro focal point: August CPI due Friday at 12:30 UTC
The main macro release this week is the August consumer price index, due Friday at 12:30 UTC. The article describes it as the last inflation print before the Sept. 16 rate decision. The current policy range is 3.50% to 3.75%, and rates have been left unchanged for five straight meetings.
The week’s schedule is laid out in the source as follows:
- Monday: market closed for Labor Day.
- Tuesday: NFIB small business optimism index and consumer credit.
- Wednesday: MBA mortgage applications.
- Thursday at 12:30 UTC: PPI. Oracle (ORCL) and Adobe (ADBE) report after the close.
- Friday at 12:30 UTC: August CPI. Kroger (KR) reports before the open.
The article also notes that regular U.S. market hours run from 13:30 UTC to 20:00 UTC, with both times one hour later during standard time.
The reason Friday’s release matters most is straightforward in the source’s logic. Inflation shapes rates, and rates shape the pricing of stocks and bonds. That makes the CPI print the upstream driver for asset prices this week.
July inflation breakdown: gasoline held up headline CPI, housing matters most for core
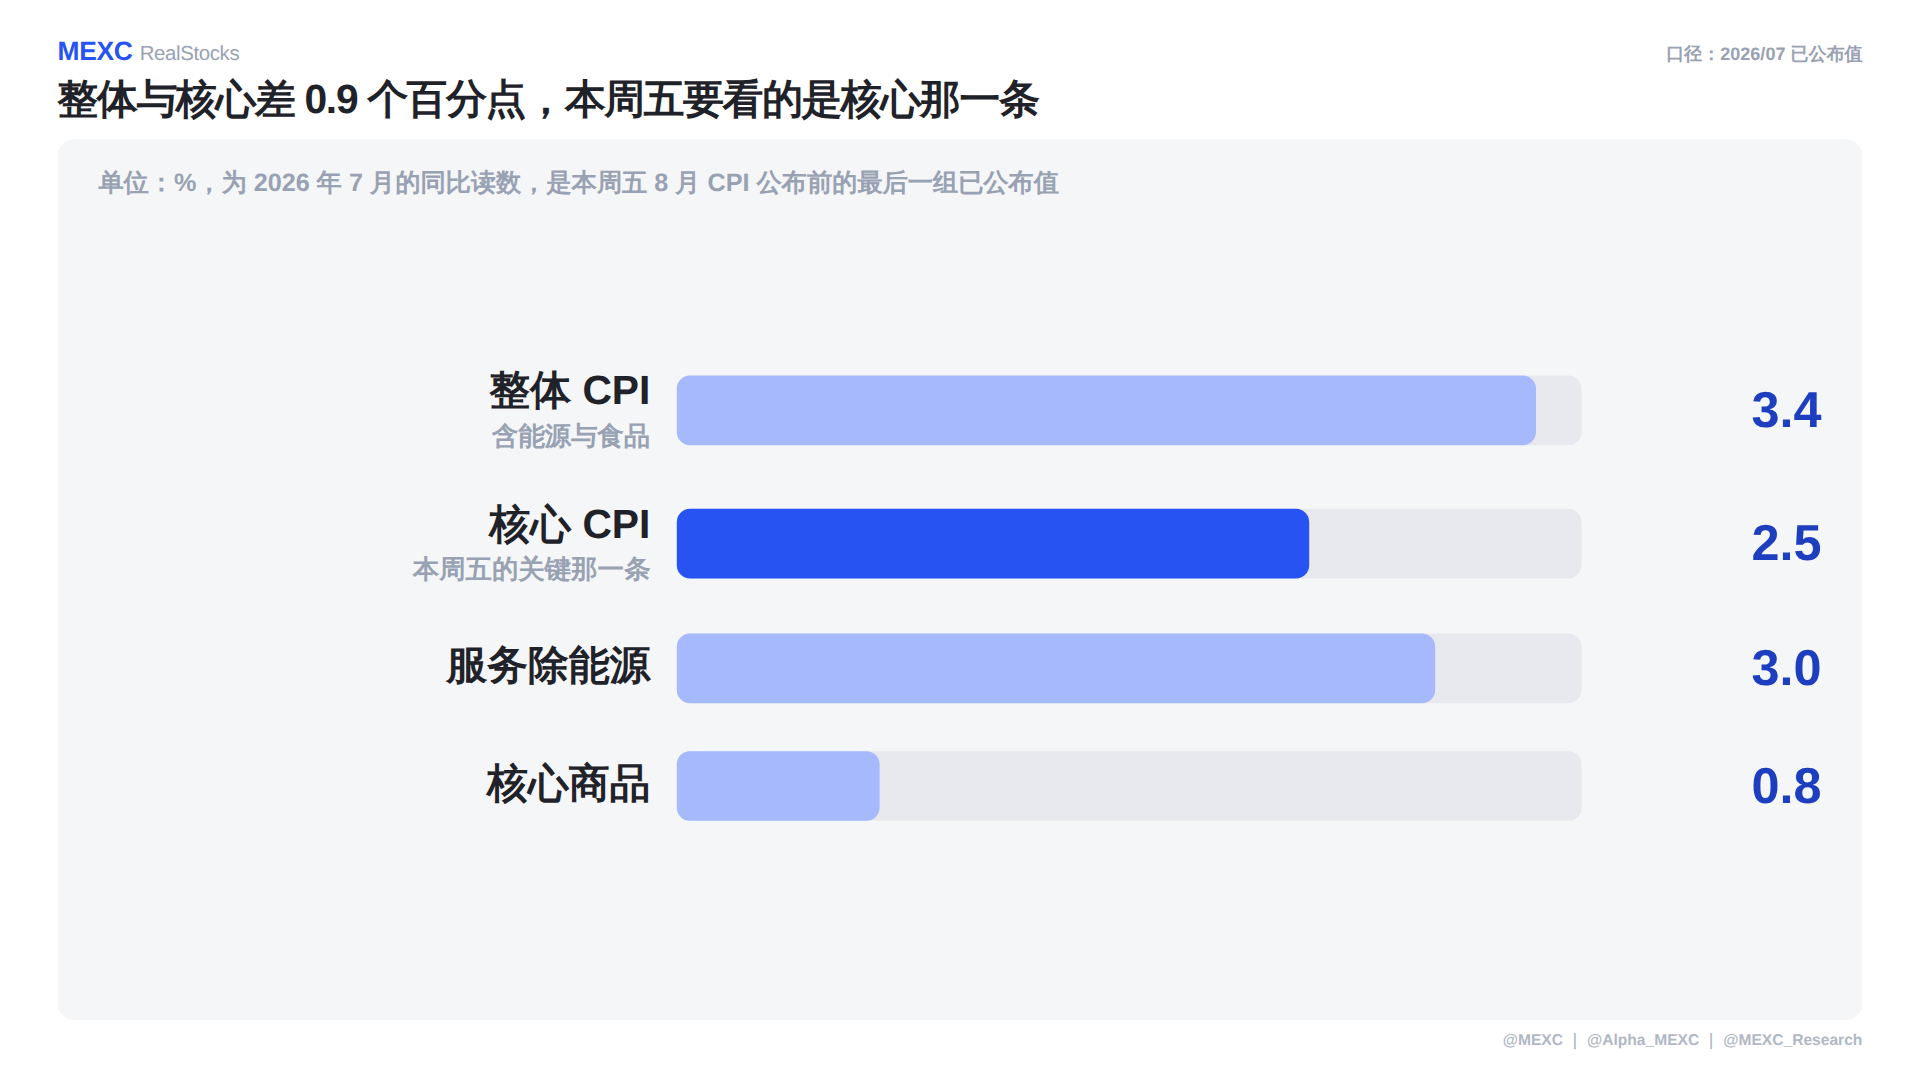
Before August CPI is published, the last available inflation readings are for July 2026. The four headline figures cited in the source are: headline CPI up 3.4% year over year, core CPI up 2.5%, services excluding energy up 3.0%, and core goods up 0.8%.
The source argues that investors should look at core first, not headline. The reason is specific. Energy prices are shaped by supply conditions and geopolitics, and monetary policy cannot directly reach them. Headline CPI and core CPI were 0.9 percentage points apart in July, while both the services and goods lines were much closer to core. That suggests a large share of the gap in headline came from energy.
Breaking July down further, energy goods, mainly gasoline, rose 24.6% year over year, the only double-digit figure in the set. Energy overall rose 14.7%. Shelter increased 3.2%. Services excluding energy rose 3.0%, and core goods climbed 0.8%.
The article pauses on a measurement point here. Energy goods are already part of the broader energy category, so the 24.6% figure for energy goods and the 14.7% figure for energy overall cannot be added together. They move together, but they do not represent separate additive contributions.
The contrast the source wants readers to keep in mind is this: gasoline is what props up headline inflation, while housing is what determines the path of core. Gasoline is the only line still showing a double-digit increase, which is why headline remains elevated. Core goods, at 0.8%, are contributing very little. Shelter, at 3.2%, may not look high in isolation, but it carries the largest weight inside core CPI. Whether core can keep moving lower depends mainly on that category.
So the reading order for Friday, according to the article, has two steps. First, check whether year-over-year core CPI holds at 2.5%. Second, turn to shelter. If headline softens only because energy fades, the effect may not last long, because the base effect on energy changes over time. Shelter moves more slowly. If it sticks, core inflation does not come down easily.
Five takeaways from the article’s Q&A section
Why was KLAC up 7.32% while its trend-position score was only 44?
Because the two numbers measure different things. The daily gain measures that day’s performance. Trend position measures where the stock sits inside its own 52-week range. KLAC closed at $185.60 on Sept. 4, with a one-year range of $90.67 to $307.37, leaving it in the lower half of that band.
Where did KLAC’s move come from if there was no company announcement?
From a broader rotation into storage. SK hynix rose about 7%, SanDisk jumped 11.9%, and Micron gained 6.1% that day. Storage names were bought first. Because storage makers place inspection and equipment orders before capacity expansion, and inspection is KLAC’s core business, money then moved up the chain. The article notes that this kind of move has no same-day company-level evidence behind it; actual order figures will only show up in the next earnings report.
Why did some names rise and others fall within the same supply chain?
Because this was not blanket buying. It was internal repositioning. On Sept. 4, upstream names such as KLAC, MU, and LRCX rose, while downstream names such as HPE and SNPS fell. Looking only at the Nasdaq semiconductor group’s average gain of 1.96% would miss that internal spread.
If LULU beat on profit last quarter, why did the stock still fall 17.4%?
Because the market was not pricing the quarter that had already passed. The report showed $2.4 billion in revenue, a 60.5% gross margin, and profit above expectations, but the company cut its full-year EPS target to 9.48-9.73 from 10.95-11.15. On the same day, ANF raised its target to 13.10-13.60 from 10.20-11.00. The difference was guidance, not the already reported quarter.
What should investors read first in Friday’s CPI release?
Core CPI first, then shelter. July headline CPI was 3.4% and core CPI was 2.5%, a gap of 0.9 percentage points. Energy goods rose 24.6%, making them the main reason headline stayed elevated, while core goods rose only 0.8%. Shelter increased 3.2% and carries the largest weight inside core, which is why the source treats it as the key category for the direction of core inflation.