Bitcoin has climbed back above $80,000 after a stretch shaped by a Federal Reserve rate hike, the U.S. Senate’s 49-50 vote against advancing the Clarity Act, and an unexpected rate increase from the Bank of Japan. That rebound has eased pressure across the crypto market and given altcoins more room to move.
The shift is showing up in market share data. Bitcoin dominance fell from 64% to 59%, pointing to a rotation of capital from Bitcoin into smaller tokens. XRP has been one of the clearest beneficiaries of that move.
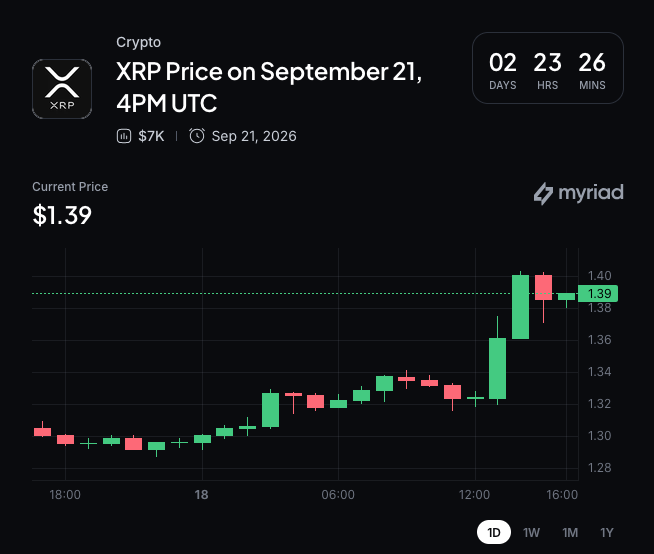
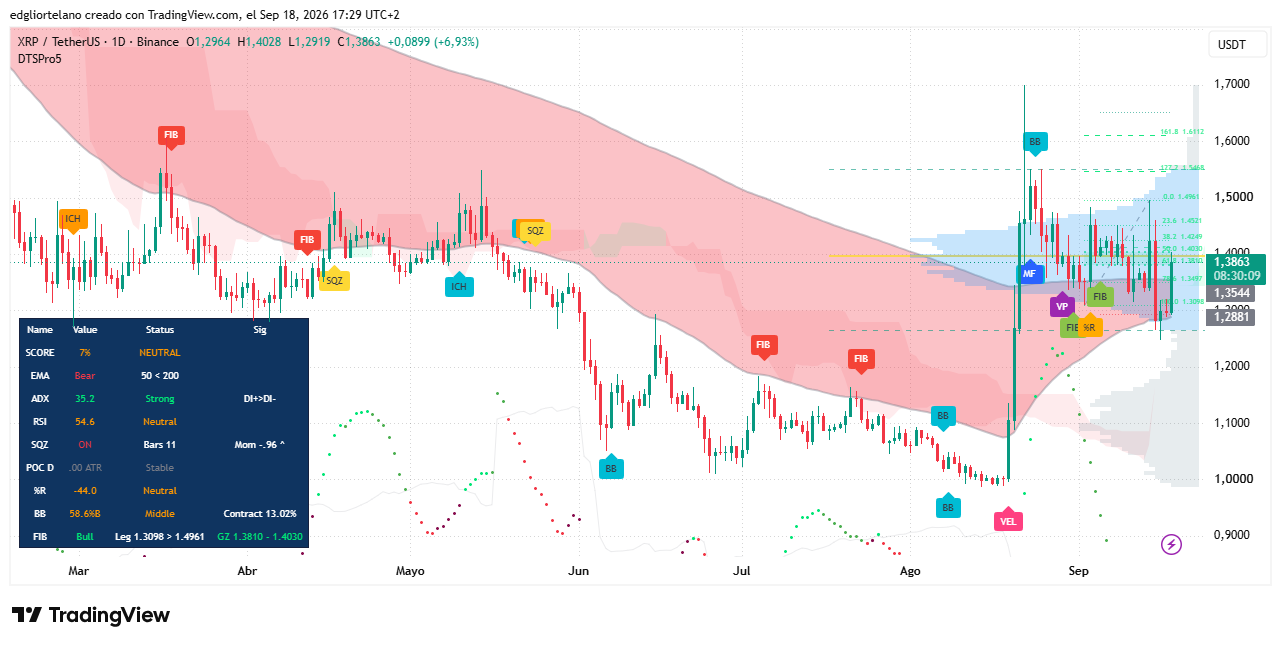
The token, created by the co-founders of payments company Ripple, opened the day at $1.2964. It climbed as high as $1.4028 before settling near $1.3863, leaving XRP up 6.93% on the daily candle and marking one of its sharpest one-day advances in weeks.
The daily chart is still in a death-cross structure
The larger technical story sits in XRP’s moving averages. On the daily chart, the 50-day exponential moving average remains below the 200-day EMA. That keeps XRP in what chart watchers describe as a death-cross structure, a setup generally viewed as bearish because the shorter-term trend is still lagging the longer-term one.
Still, the gap between those two averages has narrowed sharply. According to the report, it is now the tightest it has been since XRP’s last golden cross in August 2024. If the current pace of gains holds, the daily chart could print a golden cross as soon as mid-October.
A golden cross is the reverse of a death cross. It appears when the shorter-term average moves above the longer-term average, and traders often read it as a sign that bullish momentum has more staying power than a short-lived squeeze.
The 4-hour chart already flipped on August 21, but the spread narrowed again
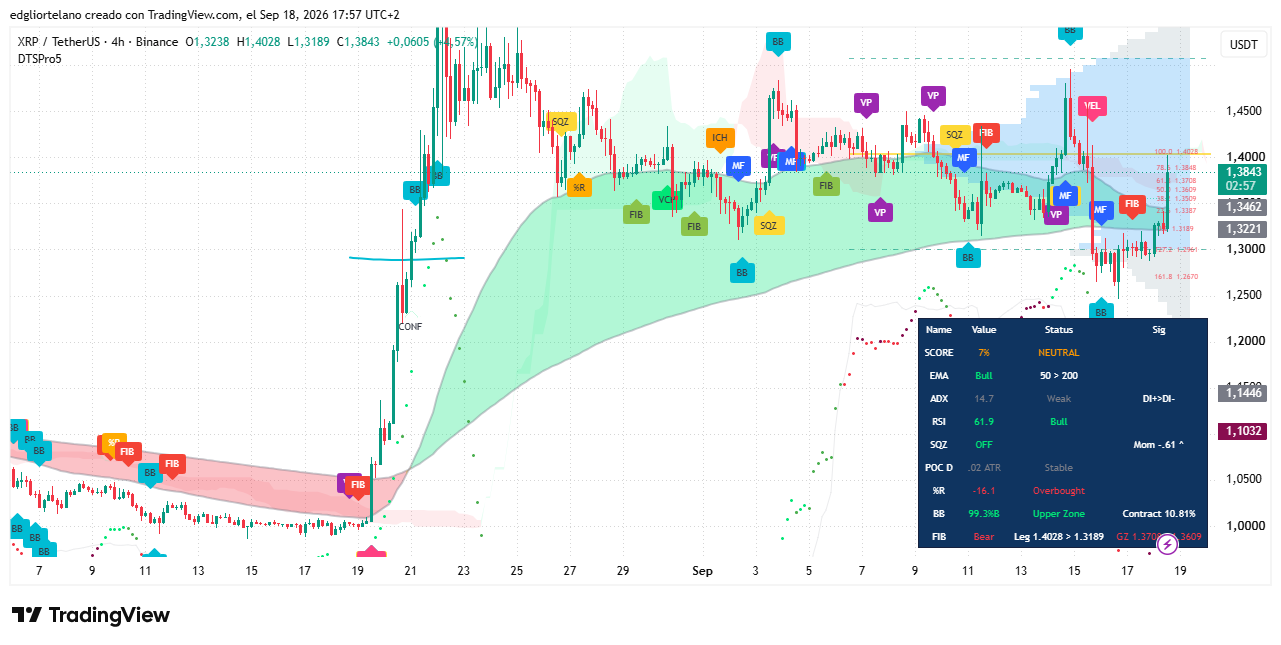
There is a complication in the shorter timeframe. XRP’s EMAs on the 4-hour chart already turned into a golden cross on August 21. But instead of widening the way a stronger breakout usually would, the distance between those averages started to close again.
A failed crossover on a shorter timeframe does not mean the daily setup cannot confirm later. The report notes that shorter timeframes often set the pace for what appears on longer charts, but some experts argue that each timeframe should be examined on its own rather than linked too directly.
ADX, RSI and squeeze readings are more constructive
Other daily indicators look firmer. XRP’s Average Directional Index, or ADX, is at 35.2, well above the 25 level many traders use to separate a real trend from directionless trading. The positive directional line, DI+, is also above DI-, which shows that the stronger side of the current trend is to the upside.
The Relative Strength Index, or RSI, stands at 54.6. That is still neutral territory even after a near-7% daily gain, which suggests XRP is not yet flashing overbought conditions and has not reached the point where profit-taking becomes an obvious technical risk.
XRP’s Squeeze Momentum Indicator has also stayed on for 11 straight bars. Traders generally read that as a sign that volatility has been compressing and that a larger move may follow once that compression breaks.
The momentum reading inside the squeeze has been climbing back toward positive territory. That points to a greater chance of an upward move than a downward one, though the report stops short of treating that as a confirmed signal on longer timeframes.
Bitcoin stability and altcoin rotation are supporting the setup
The broader market backdrop has helped. Even though the Clarity Act stalled in the Senate this week, Bitcoin absorbed the news without losing ground. It held its range and lifted sentiment across the market as the week drew to a close.
That resilience in Bitcoin, combined with continued rotation into altcoins, is the kind of support XRP needs if it is going to keep narrowing the gap between its 50-day and 200-day EMAs.
Over the coming weeks, traders are likely to focus on two questions. First, whether Bitcoin’s rebound can hold well enough for the altcoin rotation to continue. Second, whether XRP’s 50-day EMA can actually move above the 200-day EMA on the daily chart.
The report says a confirmed golden cross around mid-October, together with ADX holding above 25, would add stronger technical backing to the current bounce. If XRP fails to hold the $1.38 golden zone, the odds rise that this move is only another squeeze that loses steam before any daily crossover is confirmed.
Decrypt said the views expressed by the author are for informational purposes only and do not constitute financial, investment, or other advice.