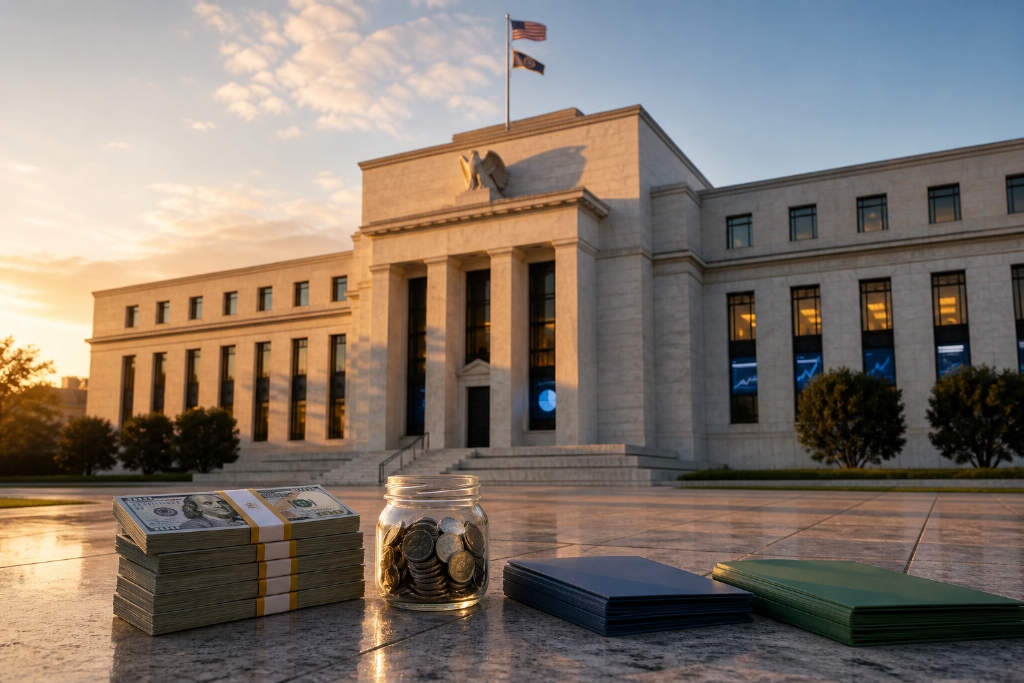
Federal Reser2026-10-01 14:13:55Fed Governor Waller says FRED now holds more than 850,000 data series, with more AI tools plannedFederal Reserve Governor Christopher Waller said FRED, the economic research database maintained by the Federal Reserve Bank of St. Louis, now contains more than 850,000 data series. He also said more artificial intelligence tools are planned for the database. The expansion is intended to strengthen economic analysis capabilities. At the same time, it has raised concerns about data accuracy and reliability. The update was cited by Techub News, which referenced Crypto Briefing. The remarks center on how a larger database and added AI features could improve access to economic information while also bringing fresh scrutiny over the quality and dependability of the data used in analysis.110
United States2026-08-26 00:54:49US M2 money supply rose 5.41% year over year to $23.22 trillion in JulyFresh data from the Federal Reserve Bank of St. Louis’ FRED database showed that the United States’ seasonally adjusted M2 money supply reached $23.22 trillion in July 2026, up 5.41% from a year earlier. According to BlockBeats, that marked the fastest pace of growth since mid-2022 and could make it harder for the Federal Reserve to bring inflation back to its 2% target. M2 is a broad money supply measure. It includes M1, such as currency in circulation and demand deposits, along with relatively liquid assets including small-denomination time deposits and retail money market funds. The seasonally adjusted M2 series is constructed by seasonally adjusting the relevant components separately and then adding them together. The update adds a new macro datapoint to the policy picture as markets continue tracking liquidity conditions and the Fed’s inflation path.1430
Treasury yiel2026-08-19 09:51:2430-year Treasury yield hits 5.33% as backtest points to weak short-term but firmer 12-month S&P 500 returnsThe U.S. 30-year Treasury yield climbed to 5.33% on Aug. 18, its highest level since June 2007, while the 10-year yield approached 4.75%, also near the top of this year’s range. In a historical backtest built on public FRED data, BlockTempo examined how the S&P 500 performed after Treasury yields broke above their highest level of the prior 36 months. The results were mixed in the near term and much stronger over a one-year horizon. For the 10-year yield, there were 10 qualifying signals since 1985. The S&P 500 posted an average return of -1.1% three months later, with seven of the 10 cases ending lower, versus a full-period benchmark of +2.5%. Twelve months later, the average return improved to +11.8%, with nine gains out of 10, roughly in line with the +10.6% benchmark. The 30-year yield produced only six such signals since 1985, with July 2026 marked as the latest live sample. Across the five completed cases, the S&P 500 averaged 0.0% after three months and +10.8% after 12 months, with all five one-year outcomes positive. The report also said rising debt totals alone had little predictive power for equities, while the reason behind higher yields mattered more, especially when moves were driven by inflation or fiscal concerns rather than growth.1410
S&P 5002026-08-11 04:22:53S&P 500’s Four-Day Surge Outran a Three-Month Range as Wall Street Chased the RallyWall Street closed on Aug. 4 with a move that stood out for its speed as much as its size. The S&P 500 gained 5.8% over the previous four trading sessions, and Reuters reported that options positioning turned unusually bullish by standards not seen in at least four years. What made the rally look different was not simply that stocks rose, but that the index covered in four sessions a distance that slightly exceeded the gap between the highest and lowest closing levels seen over roughly the prior three months, based on closing data carried by the Federal Reserve Economic Data database, or FRED. The article argues that this comparison is not meant to equate a four-day return with a multi-month trading range. Instead, it shows how quickly the market’s pace changed. Using 10 years of daily S&P 500 closing data from FRED, a rolling calculation produced 2,504 four-session windows. This latest 5.7458% rise ranked in the 99.32 percentile, with only 18 windows, including the current one, matching or exceeding that gain. At the same time, the Cboe Volatility Index, or VIX, also rose, suggesting traders did not fully mark down expectations for future volatility even as equities advanced.510
FRED2026-07-08 07:36:13FRED Coin Hits All-Time High of $0.23 Then Retreats, Community-Driven Memecoin Draws Market AttentionFirst Convicted RACCON (FRED) reached an all-time high of $0.23 driven by community hype, then retreated. With a circulating supply of ~999.8 million and max supply of 999.8 million, the token exemplifies memecoin volatility and community power.550
FRED2026-07-08 07:36:13FRED Meme Coin Surges on Community Hype: All-Time High of $0.23 in FocusFRED, a community-driven meme coin from X (formerly Twitter), has peaked at $0.23 with nearly all 1 billion tokens in circulation. Analysis of its market performance and risks.520
FRED2026-07-08 07:36:13Community-Driven Meme Coin FRED Draws Attention: ATH $0.23, Nearly 1B in CirculationFirst Convicted RACCON (FRED), a meme coin driven by community on X, has an all-time high of $0.23, a circulating supply of ~999.8 million, and a max supply of ~999.8 million. This article analyzes its community background, market performance, and storage options.600
FRED2026-07-08 07:36:13First Convicted RACCON (FRED) Meme Coin: A Community-Driven Fully Circulating Project After ATH of $0.23FRED, a community-driven meme coin listed on KuCoin, has a circulating supply near 1 billion and an all-time high of $0.23. This article analyzes its background, market status, and investment risks.540