

Story Highlights
- Ethereum remains trapped within a bearish continuation pattern, with a break below $1,640 potentially exposing the price to $1,450-$1,300 this month.
- Declining Open Interest and subdued network activity suggest weak bullish conviction, making a breakout above $1,790-$1,810 crucial for a sustained recovery.
Ethereum price has managed to stabilize after a sharp sell-off, but the latest recovery may not be as bullish as it appears. Instead of establishing a new uptrend, ETH is consolidating within a contracting triangle following a steep decline, a structure that often precedes another impulsive move. At the same time, derivatives data suggest traders are reducing exposure rather than aggressively accumulating positions, indicating that conviction remains weak despite the recent bounce.
As a result, Ethereum is approaching a make-or-break moment. Bulls need to reclaim key resistance levels to invalidate the bearish structure, while failure to do so could expose the token to another wave of selling pressure and potentially drag the price toward much lower support levels this month.
Ethereum Price Analysis: Bearish Continuation Pattern Keeps $1,300 in Focus
The price remains under pressure despite its attempt to recover from recent lows. The daily chart shows the price consolidating inside a symmetrical triangle that has developed after a sharp breakdown from the $1,800 region. Such formations, when formed after a strong decline, are generally considered continuation patterns until proven otherwise. The immediate resistance lies between $1,790 and $1,810, which represents the breakdown level that bulls must reclaim to shift market sentiment.
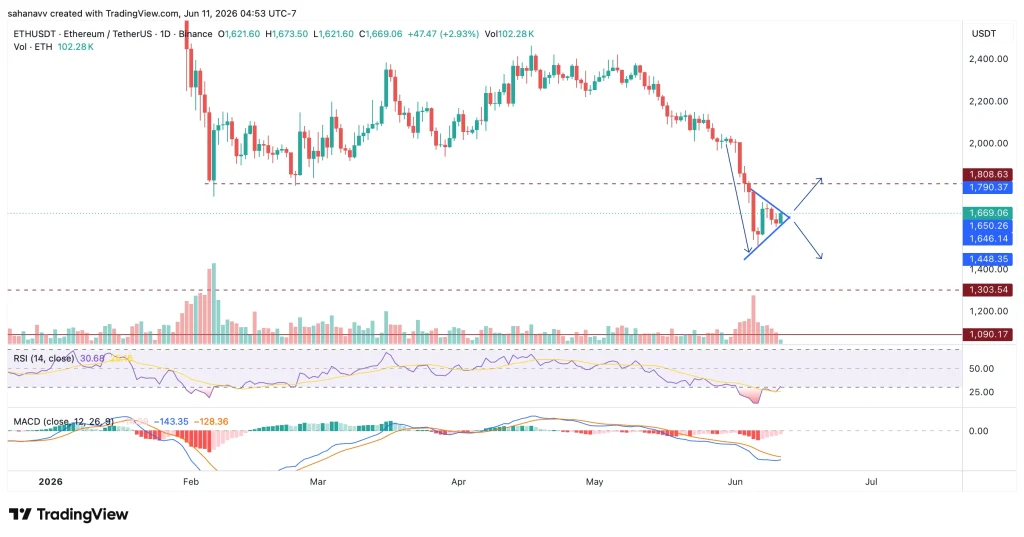
The RSI is attempting to recover from oversold conditions, suggesting selling pressure has eased, while the MACD histogram is gradually weakening on the bearish side, indicating downside momentum is slowing. A successful breakout above this zone would invalidate the current bearish structure and could trigger a relief rally toward $1,950-$2,000, where the next major supply zone exists.
Ethereum Derivatives Data Signals Weak Conviction as Open Interest Declines
Beyond the technical structure, derivatives’ positioning paints a cautious picture. Ethereum Open Interest has declined significantly, falling from levels above $30 billion to nearly $23-$24 billion, according to the chart. This decline suggests that traders are closing leveraged positions rather than opening new ones, reducing speculative participation across the market.
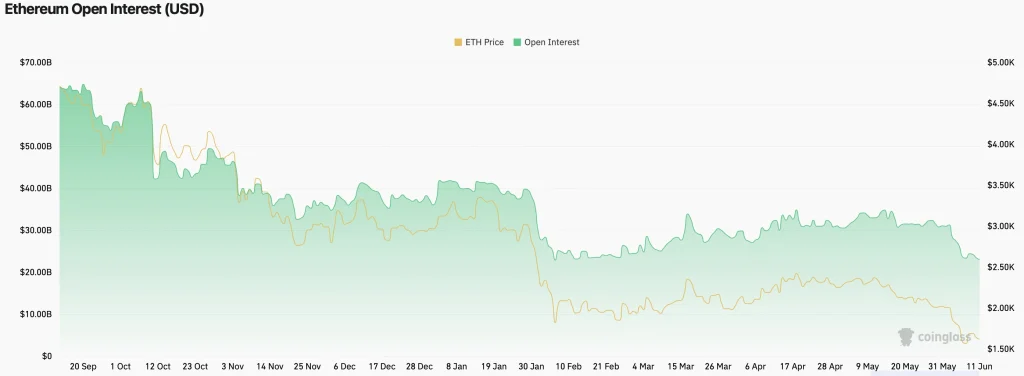
The current recovery has occurred alongside declining derivatives exposure, and this divergence implies that the bounce may be driven more by short covering than by strong bullish conviction. Meanwhile, Ethereum’s active addresses remain relatively subdued, showing no sustained surge in network participation that would normally accompany the early stages of a strong uptrend.
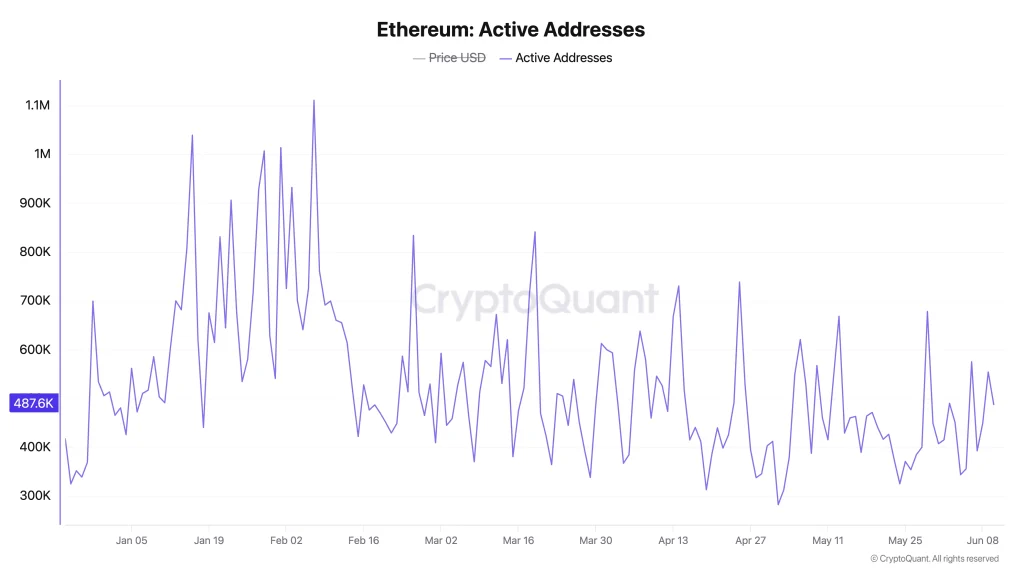
Together, these metrics suggest that investors are adopting a wait-and-watch approach until Ethereum breaks out of its current structure.
Can ETH Bulls Invalidate the Bearish Structure This Month?
The future of the Ethereum (ETH) price rally for the month depends on whether bulls can reclaim the critical $1,790-$1,810resistance zone. A decisive breakout above this level would invalidate the current bearish continuation pattern and improve the probability of a recovery toward $1,950-$2,000, with further upside possible if broader market sentiment strengthens.
A break below $1,640-$1,650 would reinforce the continuation pattern and could accelerate selling toward $1,450. If market weakness persists, the broader support zone around $1,300 may come into focus before buyers attempt to establish a stronger base.