

ArkStream frames the quarter as a structural reset for crypto
ArkStream Capital said in its latest report that the crypto market is going through a historic shift in 2026, with trading, funding flows, and product design moving closer to traditional finance. The firm’s headline points were direct: repeated U.S.-Iran tensions drove oil prices higher, gasoline prices lifted inflation expectations, and the Federal Reserve delivered its first rate hike since 2023 in September; bitcoin moved in step with tech stocks led by the Nasdaq and decoupled from gold; despite a stream of negative macro developments, bitcoin still rose 42% in the third quarter, though most new money entered through ETFs; Robinhood Chain and Circle’s Arc both saw trading dominated by meme assets rather than new categories of on-chain instruments; stock-linked and other RWA perpetuals became the main source of volume growth for the crypto industry in 2026; and tokens backed by protocol revenue plus ongoing buybacks outperformed the rest of the altcoin market.
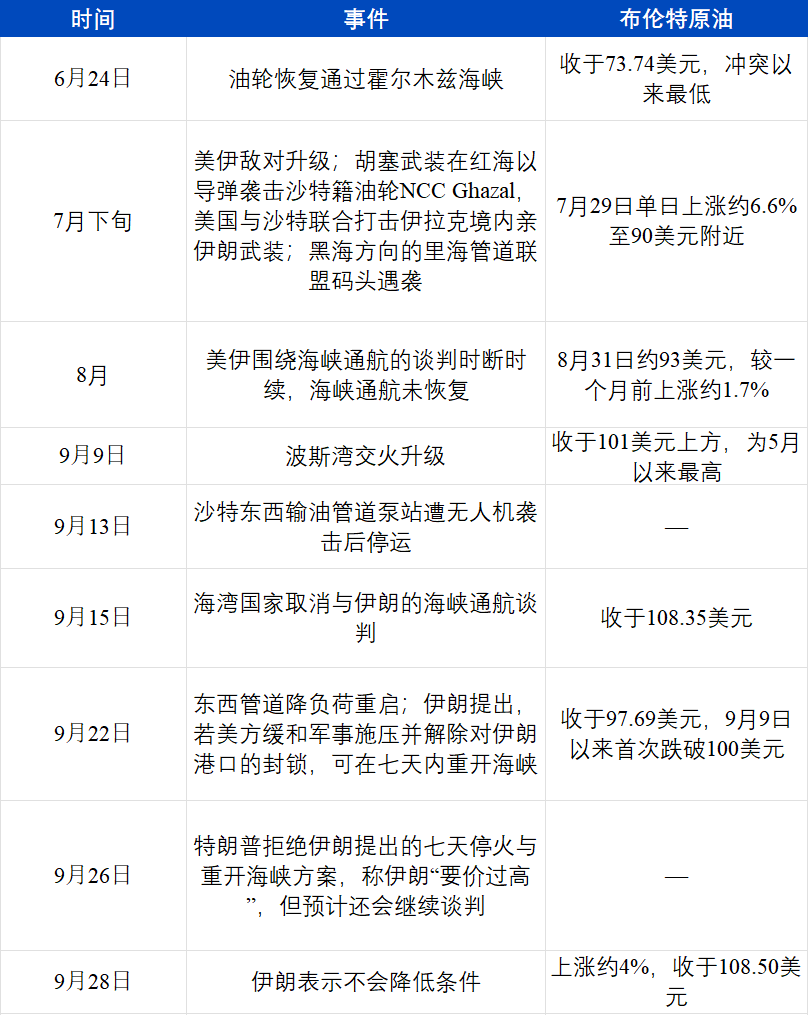
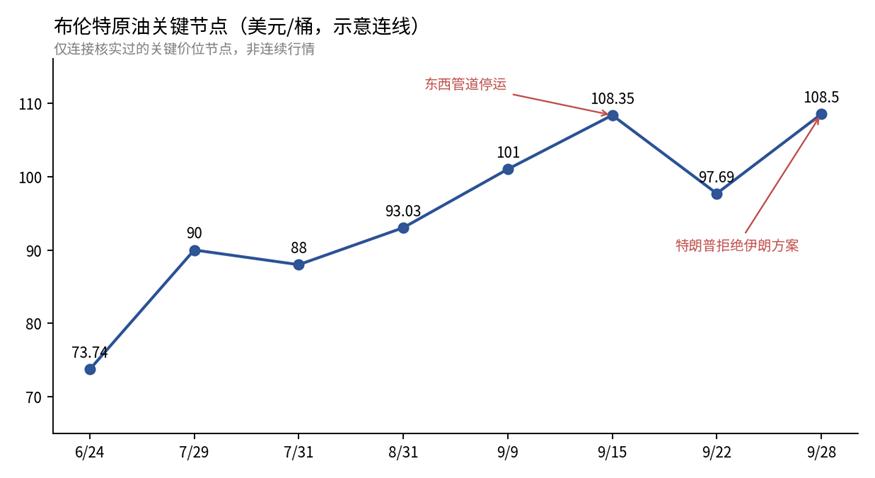
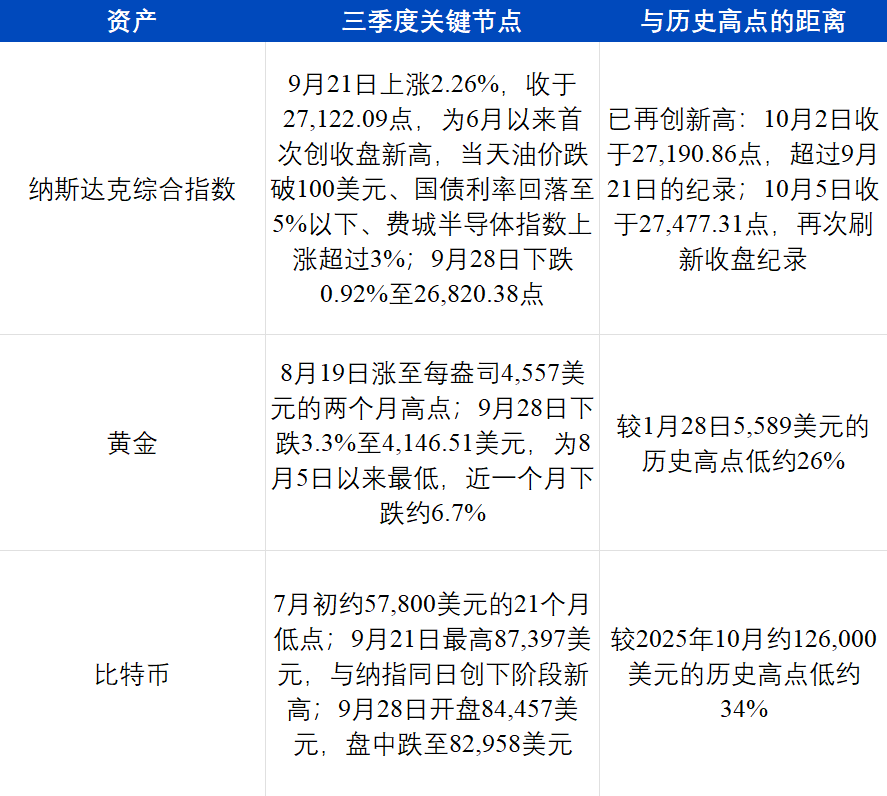
The report opened with a cluster of macro and market markers from the quarter. The Fed approved its first rate hike since 2023 by a 12-0 vote. The U.S. Senate rejected a procedural motion on the CLARITY Act by 49-50. Brent crude traded above $100 twice and settled at $108.50 on Sept. 28. The U.S. 10-year Treasury yield rose to 5.25% on Sept. 28, its highest level since June 2007. Even with that backdrop, bitcoin rebounded from about $57,800 in early July, described in the report as a 21-month low, to $87,397 on Sept. 21, before easing back toward $83,000 on Sept. 28. U.S. spot bitcoin ETF year-to-date flows also shifted from net outflows to net inflows in September, while the Nasdaq Composite closed at 27,122.09 on Sept. 21, its first record close since June.
ArkStream organized the report around three themes: how U.S.-Iran tensions filtered through oil, inflation, and rates into financial markets; how the crypto market recovered in the third quarter and what was actually trading on Robinhood’s and Circle’s corporate chains; and how crypto’s next bull phase is being shaped by a deeper merger with real-world assets.
From geopolitical tension to higher rates
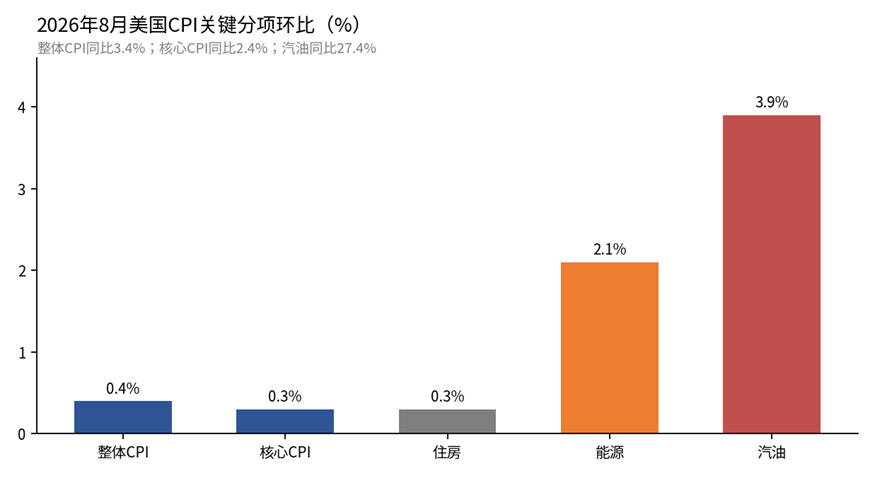
ArkStream said the macro picture could be read as a straightforward chain reaction: U.S.-Iran tensions escalated, oil prices rose, gasoline pushed inflation and inflation expectations higher, the Fed tightened policy, Treasury yields climbed, and financial assets from stocks to gold to bitcoin repriced. In July and September, flare-ups in the conflict sent Brent from $73.74 at the end of June to $108.35 by mid-September. In August, U.S. gasoline prices were up 27.4% year over year, headline CPI rose 0.4% month over month, and one-year consumer inflation expectations reached 4.6%. The Fed then raised rates by 25 basis points in September. Of 19 officials submitting rate projections, 16 expected at least one more hike before year-end. The 10-year yield hit 5.25% on Sept. 28 and the 30-year reached 5.56% on Sept. 29.
The same rhythm repeated through the quarter, the report said. When oil eased, stocks and bitcoin rallied. When tensions escalated, all three major asset groups came under pressure. On Sept. 21, crude slipped below $100 and both bitcoin and the Nasdaq hit local highs. On Sept. 26, Trump rejected Iran’s proposal to reopen the strait, and by Sept. 28 oil was back near $108 while the Nasdaq, gold, and bitcoin all fell together.
Gasoline was the first transmission channel
At the end of the second quarter, ArkStream said, negotiations between the U.S. and Iran had made progress and tankers resumed transiting the Strait of Hormuz. Brent then closed at $73.74 on June 24, the lowest settlement since the conflict broke out on Feb. 28. That calm did not last. In the third quarter, repeated escalations pushed crude sharply higher again.
The first visible effect showed up in gasoline. In August, U.S. gasoline prices rose 3.9% from the previous month and 27.4% from a year earlier, accounting for more than one-third of the month’s CPI increase. The broader energy component rose 2.1% month over month. Labor data added to the shock. Nonfarm payrolls increased by 162,000 in August, far above the market consensus of about 53,000 and the strongest monthly reading since March. The unemployment rate held at 4.1%, with roughly 7 million unemployed.
Inflation expectations were already moving before the payroll report landed. The University of Michigan’s final September reading showed one-year consumer inflation expectations at 4.6%, the highest since June. Five-year expectations rose to 3.4% from 3.3% in each of the prior three months. Consumer sentiment fell to 48.1, and respondents repeatedly cited higher fuel costs as the source of pressure. By contrast, the bond market’s inflation signal was more contained: the 10-year breakeven inflation rate stood at 2.33% in September, well below the 3.02% peak from April 2022. ArkStream said households and bond investors were no longer reading inflation the same way.
The Fed stopped waiting, and the market started pricing a longer period of high rates
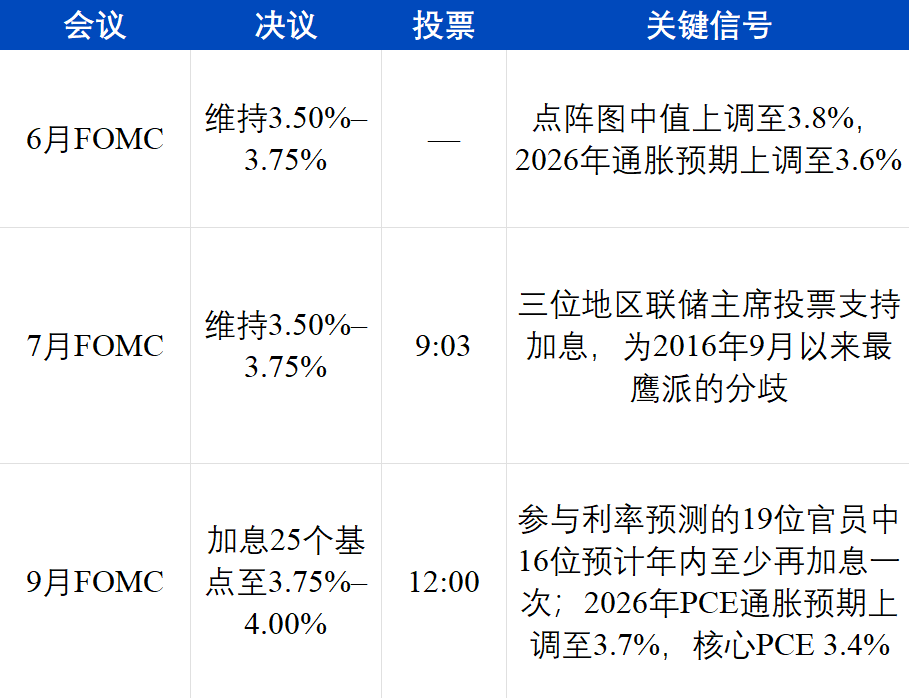
Once inflation and labor data were in hand, the Fed moved in September. ArkStream traced the shift through three meetings. The July statement said economic activity was expanding at a “solid pace” and that inflation remained above the 2% goal, with energy-related supply shocks named as part of the reason. Minutes from that meeting showed officials believed further tightening would be needed if inflation failed to cool. By September, the statement read: “Inflation remains elevated, and today’s policy action will support a more timely return of inflation to the 2% objective.” With growth still expanding, unemployment near 4.1%, and inflation above target, the Fed ended its wait-and-see phase.
The projections were just as important as the move itself. The Fed lifted its 2026 PCE inflation forecast to 3.7% from 3.6% and pushed the timeline for returning to 2% out to 2029. Sixteen officials expected at least one more hike this year, including four who saw two additional increases. Most also projected that rates at the end of 2027 would still be above current levels. Before the September meeting, a hike had already been largely priced in. Afterward, the real source of volatility was the message that rates above 4% could persist into 2027. On Sept. 28, CME FedWatch showed about a 94% probability of at least one more hike by year-end and roughly a 70% chance of a move in October.
ArkStream said the September decision supported the view it laid out in the second quarter: this inflation wave is being driven mainly by supply-side forces such as oil prices, and rate hikes cannot reopen a shipping route. In that setup, high rates are more likely to last longer.
Bitcoin traded like the Nasdaq, not like gold
ArkStream said the quarter’s biggest market signal was the widening split between bitcoin and gold. In September, bitcoin and the Nasdaq both posted local highs on Sept. 21 and both fell on Sept. 28, while gold weakened through the month. The Sept. 21 rally in the Nasdaq was led by chips and AI names. Meta rose about 11% that day, while AMD and Intel gained 8% to 11%, lifting AMD’s market capitalization to $1 trillion. On Sept. 28, the S&P 500 fell 0.77% to 7,683.69, the Nasdaq lost 0.92%, and the Dow slipped 0.67%, with Brent up about 4% the same day.
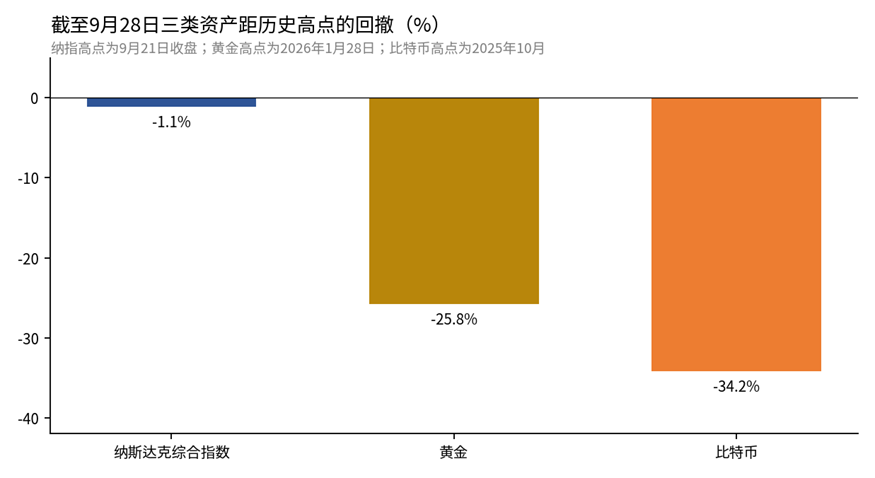
Over the past year, ArkStream argued, bitcoin repeatedly moved away from gold and closer to risk assets represented by the Nasdaq. Gold reached a record $5,589 on Jan. 28, 2026. Bitcoin, by then, had already retreated from its 2025 peak and eventually fell to around $57,800 in early July, a drawdown of roughly 54%. Their rolling one-year correlation was -0.17 and briefly dropped to -0.88 in the spring. Over a similar period, bitcoin’s correlation with U.S. equities swung from -0.68 to +0.72 within two weeks.
August was the exception. After the Treasury expanded buybacks, debate over dollar debasement intensified and bitcoin briefly rose alongside gold. Grayscale data cited by ArkStream showed the 90-day bitcoin-gold correlation climbing from near zero to about 0.5, while the 90-day correlation between bitcoin and the Nasdaq fell from around 0.6 to 0.33. In September, that shift reversed. Gold fell while bitcoin and the Nasdaq moved together again. Historical data from Glassnode, the report said, suggests these short-lived correlation switches usually do not last.
ArkStream listed four reasons for the split:
- Different buyers. Gold’s most stable buyers are central banks. In 2025, official-sector gold purchases totaled 863.3 tons, more than double the 2010-2021 annual average, while gold ETFs saw a record $89 billion in net inflows. Bitcoin has no central bank bid. New money comes mainly from spot ETFs and institutional investors, and U.S. spot bitcoin ETFs held about $108.4 billion in assets, with holders overlapping heavily with tech stock investors.
- A similar sensitivity to rates. Bitcoin and growth tech stocks both lack stable cash distributions. Their valuations rely heavily on expectations about the future, so they both weaken when long-term yields rise and both benefit when yields fall. On Sept. 21, lower oil and lower Treasury yields helped lift both the Nasdaq and bitcoin. On Sept. 28, both sold off as the 10-year Treasury yield reached a 19-year high.
- Gold has other drivers. Gold also produces no income, so higher rates and a stronger dollar weigh on it. The direct pressure in late September came from the highest Treasury yields since 2007 and a dollar index near a two-month high. Silver also fell about 4.7% that day to $61.27. Longer term, though, gold is also shaped by central bank reserve management and sovereign allocation decisions. Bitcoin is not.
- Bitcoin carries more leverage. Open interest in bitcoin futures and perpetuals was about $61.5 billion in September. Large price swings can trigger chains of liquidations and amplify moves, making bitcoin behave more like volatile tech than like gold.
ArkStream reduced the macro quarter to three broad points: U.S.-Iran tensions pushed Brent from $73.74 to above $108 and gasoline inflation drove one-year consumer inflation expectations to 4.6%; the Fed hiked and signaled more tightening, lifting the policy rate to 3.75%-4.00% while the 10-year Treasury yield reached 5.25%; and bitcoin traded with the Nasdaq while gold, down about 6.7% over the prior month, went its own way.
Crypto recovered in the third quarter, but the money stayed concentrated in bitcoin
ArkStream said the digital asset market bottomed and bounced in the third quarter even as macro conditions turned harsher. Through the first half of 2026, trading was thin and leverage appetite remained weak. The tone shifted on Aug. 18 and 19, when three supportive developments arrived almost at once. Treasury Secretary Bessent said long-dated Treasury buyback operations would at least double, with each operation rising from $2 billion to at least $4 billion. The U.S. Securities and Exchange Commission released a consultation draft titled Regulation Crypto Assets, proposing an exemption that would allow crypto issuers to raise up to $5 million over four years or up to $75 million annually with disclosure requirements far lighter than those in traditional securities issuance. Trump also convened executives from Coinbase, Gemini, Ripple, and Chainlink Labs at the White House for a final push to advance the stalled CLARITY Act, though the bill ultimately failed to pass.
Together, those developments triggered a sharp short squeeze. Bitcoin rose nearly 8% in two days and briefly approached $70,000. Ether jumped 18% to 20% over the same window and moved above $2,250. Roughly $1.9 billion in positions were liquidated within 24 hours, most of them shorts.
That “8/19 rally,” as ArkStream described it, drove the quarter’s broader recovery. Bitcoin gained 42% in the third quarter and ended it at $83,161. Because the earlier drawdown had been so deep, it was still down about 5.13% year to date and remained about 34% below its $126,000 record high. ArkStream described the move as a recovery rally rather than a fresh, market-wide bull cycle.
The report stressed that capital stayed concentrated in bitcoin. During bitcoin’s near-25% rise in August, the altcoin season index fell from about 67 at the start of the month to 39 by Aug. 25, far below the 75 threshold associated with a broad altcoin cycle. Bitcoin dominance held near 60%, according to CoinMarketCap. U.S. spot bitcoin ETF cumulative flows were down by roughly $5.8 billion in mid-July, then turned back to net inflows by late September. Stablecoin market capitalization, meanwhile, fell from about $320.6 billion in May to $306.6 billion on Sept. 24, according to DefiLlama. In ArkStream’s reading, new money entered bitcoin through ETFs while on-chain dollar liquidity did not expand.
Exchange data improved from July lows, but not enough to erase the earlier contraction
ArkStream updated the same exchange data set it used in its second-quarter note and said the pattern remained consistent: U.S. equities bottomed in July, recovered through August and September, and reached quarterly highs in September, much like bitcoin. That fit the report’s broader claim that bitcoin was trading closer to growth equities than to traditional safe havens.
Binance and Hyperliquid showed the same bounce in crypto trading activity after August. Binance U-margined perpetual volume dropped to $1.17 trillion in July, the lowest level of the year, while Hyperliquid’s official crypto perpetuals fell to $109.5 billion. By September, those figures had recovered to $1.61 trillion and $188.4 billion. Binance spot trading also rose from $193.7 billion to $306.6 billion over the same period.
Still, ArkStream said this was mostly a rebound from depressed July levels. Third-quarter Binance U-margined perpetual volume totaled $4.15 trillion, about 12% below the first quarter, while spot volume was down about 28%. Hyperliquid’s official crypto perpetuals reached $456.2 billion in the third quarter, around 9% below the first quarter. The industry’s real source of new volume, ArkStream said, came from stock-linked and other RWA perpetual products.
Robinhood Chain and Circle Arc grew fast, but trading still centered on meme activity
Robinhood Chain completed its first full quarter
Robinhood Chain, an Ethereum Layer 2 backed by Robinhood, launched mainnet on July 1, 2026. The third quarter was its first full operating quarter. ArkStream said its core product is tokenized equities aimed at users in more than 120 countries outside the U.S., with 24/7 trading and the ability to post those assets as collateral in lending pools.
By Sept. 30, daily DEX volume on Robinhood Chain was about $1.3 billion and active addresses reached 394,000. Daily revenue peaked at $8.27 million on Sept. 4.
Entropy Advisors data cited in the report showed Robinhood Chain’s TVL hitting $1.12 billion by the end of September, achieved in just three months. For comparison, Hyperliquid’s HyperEVM launched in February 2025 and needed about seven months to reach $190 million to $200 million by early September that year. Coinbase’s Base launched in August 2023 and took about 13 months to break $2 billion in September 2024.
Total on-chain assets reached $4.21 billion by the end of September. The rapid expansion at the start of that month was driven mainly by meme tokens and protocol tokens. Stablecoins grew in absolute terms too, but their share was diluted. RWA assets and yield-bearing stablecoins, or YBS, increased more slowly and lagged far behind meme and protocol tokens. The period coincided with a surge in minting and trading on the Pons token-launch platform, where cumulative turnover reached roughly $4.5 billion.
The highest-value assets on the chain were still mostly meme tokens and launchpad tokens. On Sept. 29, meme tokens on Robinhood Chain had a combined market capitalization of about $871 million and 24-hour trading volume of about $146 million. PONS, the platform token of Pons, rose from a $20 million market capitalization in August to above $200 million. The largest token, AI, and the fourth-largest, BONER, both traded against tokenized equities. AI was quoted against tokenized Nvidia shares, while BONER accumulated more than half of the tokenized HIMS stock supply. Another meme token, A Meme Coin, traded against tokenized AMC shares and explicitly leaned on the 2021 meme-stock narrative.
Launch platforms also generated the most revenue on the chain. On Sept. 2, Pons issued about 25,000 new tokens in a single day and had generated $174.6 million in cumulative fees. In the week ending Sept. 24, fees came to about $19.5 million, down from $35 million the week before.
Trading in tokenized equities expanded quickly, but ArkStream said it was deeply entangled with meme activity. CoinDesk Research estimated Robinhood processed $6.57 billion in tokenized stock volume in September, up 407% month over month and equal to 42.0% of the total market, making it the largest tokenized stock venue. Token Terminal estimated that tokenized equity DEX volume on Robinhood Chain reached $10.4 billion over the 30 days through Sept. 23, about 19% of all DEX volume on the chain during that period, compared with roughly 8.7% in its first two months. Nvidia led the category with about $2.1 billion in cumulative volume, followed by active trading in tokenized Apple, GameStop, and SpaceX shares.
But that data does not strip out meme-token pairs denominated in tokenized stocks. Some trading in tokens such as AI and BONER was counted as tokenized stock activity for that reason. TVL data pointed in the opposite direction. DefiLlama’s broader measure put tokenized assets on the chain at roughly $125 million, or about $32 million under a narrower definition, only around 6% of TVL. At launch, that share had been close to one-third. Of the roughly $640 million in stablecoins on the chain, USDG accounted for 54.8%, while USDe grew 167% within a month.
Arc was built for institutions, but its early trading skewed meme
Circle’s Arc blockchain launched mainnet on Sept. 16. ArkStream said nearly every part of its design points toward institutions: all 11 founding validators came from traditional finance and payments, including BlackRock, DTCC, Intercontinental Exchange, Visa, Mastercard, Standard Chartered, MoneyGram, SBI, Sumitomo Corporation, Global Payments, and Galaxy; transaction fees are paid in USDC; and settlement finality takes less than one second. In May, Circle completed a presale of the ARC token at a $3 billion valuation, raising $222 million with a16z leading and institutions such as BlackRock and Apollo participating.
On the funding side, activity was concentrated in lending and USDC transfers. Of Arc’s $385 million TVL, more than 90% was deposited in Morpho and Aave. Stablecoin transfers were the chain’s main activity. Yet on the trading side, meme assets dominated. On Sept. 19, the top five tokens by 24-hour trading volume on Arc were launchpad token ARGUS at $4.24 million, meme token BCAT at $4.11 million, a community meme token borrowing the USDC name at $1.79 million, launchpad token TOLLY at $930,000, and meme token DUKE at $840,000. Three of the top five were memes on a chain explicitly designed around USDC and institutional rails. Among Arc’s first batch of ecosystem projects, Hibachi, a foreign-exchange venue, was the only one that clearly differed from existing public-chain asset categories, and it had not yet published volume data.
ArkStream’s conclusion was blunt: corporate chains have not introduced a genuinely new asset category yet. On Robinhood Chain, the largest assets were still memes and launchpad tokens, and a notable share of tokenized stock volume came from meme-stock trading pairs. On Arc, funds clustered in USDC lending while traded tokens were mostly memes and launchpad assets. If activity remains meme-heavy once gas subsidies and trading incentives fade, ArkStream said, the real value proposition of these chains will still be an open question.
ArkStream calls 2026 crypto’s first real RWA year
Before defining the current RWA cycle, ArkStream stepped back through earlier crypto bull markets. The 2017-2018 ICO cycle was described as crypto’s first true retail wealth event, built around the promise of decentralized disruption and largely unconstrained by regulation. Many teams were simply using blockchain as a generic story for projects across different industries, and in hindsight a significant portion of those offerings were outright scams.
The 2020-2021 DeFi and NFT boom took shape under globally loose monetary policy. Stablecoins such as USDT and USDC expanded on-chain and became the key bridge between the traditional dollar system and crypto markets. As infrastructure matured, DeFi products worked at scale, AMMs transformed liquidity provision, and liquidity mining created strong reflexive price effects. But as that infrastructure improved, more narratives faced real-world testing. Tokenization and airdrop incentives extended the life of those narratives, yet many were later disproved in the bear market. ArkStream singled out the metaverse as a clear example.
The report then traced the evolution of meme assets. Outside early examples such as DOGE, most of the meme trade could be traced back to SUSHI in the DeFi Summer period. Early memes were not pure memes. They were closer to “meme-style DeFi,” with ironic branding used to improve community reach while projects still followed conventional operating models. Late in the bull market, the failure of many narratives and the rise of memes reinforced each other. Traders concluded that supposedly serious narratives often existed to extract value, while memes that appeared more fairly distributed were rewarded by the market. SHIB became the clearest marker of that shift: it started with the meme first and only later brought in DeFi and L1 narratives to absorb demand and selling pressure. From that point on, increasingly pure meme projects emerged, built around fair launch language, community identity, anti-VC positioning, celebrity catalysts, very low unit prices, and reflexivity driven by social media.
For ArkStream, the defining feature of the 2024-2025 ETF and meme cycle was a fundamental change in how capital entered the market. Spot ETFs, led by firms such as BlackRock through IBIT, created a regulated entry point for traditional asset managers. DAT, represented by Strategy, gave public-equity investors indirect exposure to bitcoin through listed companies. But this cycle never delivered the broad altcoin boom that earlier markets did. Institutional capital poured into bitcoin and did not rotate automatically into smaller tokens. Instead of a general altcoin season, the market moved through short-lived micro-themes that gathered capital quickly, generated gains, and faded, often within less than three months. In 2020-2021, capital tended to flow from BTC to ETH, then to large-cap and sector altcoins. In 2024-2025, the pattern looked more like meme to AI and then back to meme, with ArkStream adding that most AI projects in that period were effectively AI-themed memes.
The report said the 2023 bear market pushed crypto into a post-narrative phase. By late 2023, BONK and WIF had launched a Solana meme wave. Unlike SHIB in the prior cycle, WIF had almost no elaborate vision and no traditional roadmap, yet it proved that a meme built almost entirely on imagery, language, community consensus, and liquidity could become a major asset on Solana. That marked a transition from ecosystem community coins to “attention assets.”
Even so, ArkStream said the meme bull market is over. Pump.fun industrialized meme issuance, creating supply that far outstripped retail liquidity. In the firm’s view, the collapse of belief in “fair meme distribution” could hurt sentiment nearly as much as the earlier collapse of confidence in VC-backed tokens. The report compared that shift to what happened in NFTs, where Blur added major liquidity but also created the channel through which concentrated selling eventually hit the market.
ArkStream pointed to the exchange rate of small-cap altcoins against bitcoin as evidence. Most of the gains in this cycle accrued to bitcoin. U.S. spot bitcoin ETFs posted net inflows of $35.2 billion in 2024 and $21.4 billion in 2025, according to CoinDesk. That capital moved into bitcoin through ETFs and did not diffuse into smaller tokens. The third-quarter recovery in 2026, ArkStream said, looked the same.
Even if the market has not yet reached the definitive turning point of a full crypto RWA bull cycle, ArkStream said 2026 is already the first true “year one” for RWAs in crypto. If one word best captures this phase, it is “integration.” Crypto is no longer just a global lab for financial experimentation, the report argued. It is being folded into everyday financial life through the global spread of stablecoins and the tokenized restructuring of stock market liquidity.
The first three major bull cycles in crypto, from ICOs to DeFi/NFT to ETF/DAT, were all built on one-way spillover from the native crypto world into the outside financial system. This RWA-driven phase looks different. ArkStream called it a “two-way convergence.” Large centralized exchanges such as Binance, Coinbase, and Kraken are pulling stocks, commodities, and indexes onto crypto rails, while internet brokerages led by Robinhood are moving in the opposite direction by launching their own chains and tokenized products.
RWA perpetuals became the biggest source of industry volume growth
ArkStream said the most direct expression of the current RWA cycle is not branding or narrative but actual trading volume in stock-linked and other RWA perpetual products on Binance and Hyperliquid. That category, the report said, was the single largest source of incremental crypto trading activity in 2026.
Binance RWA perpetual volume rose from $410 million in January to $216.9 billion in July. On Hyperliquid, trade.xyz under the HIP-3 framework reached $114.1 billion in July. Both were year-to-date highs. Volume eased after August, with September figures at $142.0 billion for Binance and $59.3 billion for Hyperliquid, but both remained well above second-quarter levels. In the third quarter, Binance RWA perpetual volume totaled $547.7 billion, more than four times the second quarter and equal to 11.7% of all perpetual volume on the platform. In the first quarter, that share was below 0.1%.
On Hyperliquid, HIP-3 Builder volume rose from $132.4 billion in the first quarter to $261.2 billion in the third. Stock-linked perpetuals climbed from $16.5 billion to $94.6 billion over the same span. On a monthly basis, HIP-3 Builder’s share of total volume hit 51.1% in July before falling to 24.4% in September, while monthly stock-perpetual volume declined from $42.1 billion in July to $20.3 billion in September. ArkStream said that, during the same period, crypto-native perpetual volume on both Binance and Hyperliquid stayed below first-quarter levels. Nearly all of the industry’s incremental trading growth came from RWA perpetuals.
Across the broader market, CryptoRank estimated that RWA perpetual DEX volume reached $365.0 billion in the third quarter, up 32% from the prior quarter, with stock-linked assets contributing $175.0 billion, or about 48% of the total. CoinDesk Research said crypto exchanges processed close to $1 trillion in RWA-related trading in the first half of 2026, with Binance alone accounting for 60.9% of the market. Commodity perpetuals tied to gold, silver, and crude oil, as well as pre-IPO contracts such as SpaceX, all became fresh sources of trading demand.
ArkStream said exchanges are moving beyond pure crypto matching engines and turning into multi-asset financial infrastructure where nearly anything can be traded. It pointed to Coinbase’s push with Yahoo Finance to unify quote and trading access for digital assets and traditional stocks under its “Everything Exchange” vision. Kraken, through the xStocks framework, introduced regulated tokenized stock perpetuals with up to 20x leverage for non-U.S. users around the clock. Binance, for its part, used Binance Alpha to bring in tokenized asset exposure from Ondo Finance.
Binance’s own listing data reflected that shift. In the third quarter, the exchange added 134 trading products. Of those, 86 were TradFi-style perpetuals and 37 were spot stocks and ETFs. Only 11 new listings were crypto spot tokens or crypto perpetuals. That is why ArkStream said Binance has effectively become a stock exchange as much as a crypto exchange.
On-chain RWAs expanded, and tokenized stocks were the fastest-growing segment
According to Binance Research, on-chain RWAs totaled $34.18 billion by Sept. 15, up 85.2% year to date. U.S. Treasuries and money market funds made up $18.29 billion and contributed 54.7% of the year’s net increase. Tokenized stocks reached $4.43 billion, up 390.4% in 2026, and their share of the RWA market rose from 4.9% at the start of the year to 13.0%. Private credit was the fastest-growing non-Treasury segment. Commodities such as gold, along with corporate and sovereign bonds, real estate, shipping finance, and renewable energy assets, also moved on-chain at a faster pace.
On the supply side, ArkStream highlighted traditional institutions including BlackRock, Franklin Templeton, Fidelity, JPMorgan, and Apollo, alongside tokenization platforms such as Securitize, InvestaX, and IXS. DTCC had already completed production-environment live testing for tokenized securities, ETFs, and Treasuries with about 40 institutions and planned full commercialization in October. Participation in Singapore’s Project Guardian had also expanded to more than 40 institutions.
Tokenized stocks were the fastest-growing category. CoinDesk Research said marketwide tokenized stock capitalization reached $4.87 billion in September, with monthly trading volume hitting $15.6 billion, both record highs. Transfer volume for tokenized equities peaked in July and later pulled back, but activity in August and September still stood well above pre-June levels. Holder addresses reached 4.26 million.
Robinhood was the most watched brokerage example in the quarter. In September, it became the largest tokenized stock venue with 42.0% market share by trading volume. Yet ArkStream repeated that Robinhood Chain’s largest assets were still memes and launchpad tokens, while tokenized stocks accounted for only about 6% of TVL. The company’s real advantage in this convergence story, the report said, lies in its distribution: a footprint across 38 countries and more than 28 million customers.
Industry observers summarized the trend as the simultaneous dissolution of the boundary between digital and traditional assets from both directions. Crypto exchanges are trying to look more like traditional exchanges. Traditional brokerages are trying to look more like crypto platforms. Measured by new trading volume, ArkStream said, exchanges are currently ahead, with stock-linked and other RWA perpetuals driving the bulk of the expansion, while brokerage-led on-chain equity tokens remain at an early stage.
User integration and technical integration are moving in parallel
For ArkStream, both Binance and Robinhood are pursuing the same strategic goal in this integration window: to become global entry points for many asset classes. That shift is not only about what can be traded. It is also about who uses the systems and how the technology fades into the background.
On the user side, the report said that by the end of 2025, global crypto asset holders numbered about 720 million to 740 million, roughly 9% of the world’s population. But ownership is not the same as usage. Deduplicated active crypto users totaled only about 40 million to 70 million, or around 6% to 10% of holders. Crypto has reached a large group of asset owners, ArkStream said, but it is still far from becoming a high-frequency financial infrastructure used in everyday activity.
On the technology side, the report gave two examples. In 2025, Stripe and Shopify said millions of merchants in 34 countries would be able to accept USDC payments. Consumers pay in on-chain USDC, merchants receive local fiat directly, and the funds land in bank accounts just like card revenue, without merchants needing to handle wallets, gas fees, or stablecoin conversions. The other example was Polymarket. ArkStream said the platform preserves blockchain transparency while using stablecoins for settlement, open position data, and smart-contract custody to create a real-time probability market that did not previously exist between traditional media and betting venues. Its breakthrough, in the firm’s view, is that political observers, traders, reporters, and the general public increasingly treat on-chain pricing as an information source whether or not they ever buy a crypto asset themselves.
Crypto was once associated first with cypherpunk ideals, speculative trading, fringe markets, and financial experimentation. As RWAs advance, ArkStream said, it is becoming part of ordinary financial life and drawing growth from that broader connection.
Buyback-backed tokens outperformed other altcoins
As more incremental capital is pulled toward RWA products, tokenized equities, and stablecoins, ArkStream asked a harder question of crypto-native tokens: how can they show that they deserve to retain capital? The report focused on buyback-backed tokens, meaning projects that use part of protocol revenue to repurchase and either burn or redistribute their own tokens in the secondary market. Hyperliquid’s HYPE and Pump.fun’s PUMP were cited as examples. ArkStream said these projects act as a test of whether a protocol can generate real cash flow and recycle that value back into the token, echoing the same logic that underpins investor interest in RWAs.
Using a Binance-based sample, with spot markets as the core data set and derivatives used as a supplement, ArkStream found that the 33-token buyback group rose an average 78.6% in the third quarter. Bitcoin gained 42.6%. Eight large-cap altcoins rose 69.2% on average, while 544 small-cap altcoins gained 58.8%. Measured from Aug. 19, when ArkStream said bitcoin’s real strengthening began, the buyback group rose an average 71.6% through quarter-end, compared with 29.2% for bitcoin, 55.4% for large-cap altcoins, and 41.4% for small-cap altcoins. On either basis, buyback-backed tokens outperformed the broader altcoin set.
The report noted another split inside the altcoin market. Large-cap altcoins showed more upside elasticity than bitcoin, but small-cap altcoins underperformed large caps as a group. Their average gains exceeded bitcoin’s only because they were rebounding from much deeper earlier losses. Their exchange rate against bitcoin remained near multi-year lows. ArkStream said that without buybacks to support token value capture, and without the attention magnet that meme assets can still create, most altcoins are likely to fade over time.
That, for ArkStream, is the real test imposed by the current RWA cycle. Assets such as tokenized stocks and other RWAs continue to attract new money because their underlying cash flows are clearer and their standing with regulators is stronger. Crypto-native projects that cannot demonstrate sustainable, verifiable protocol revenue and a credible mechanism for value capture, whether through buybacks, distributions, or some other route, risk being pushed aside in the next round of capital reallocation. A small number of protocols with genuine cash-generation capacity and a willingness to return value to token holders, the report said, may stand out as the market rebuilds valuation frameworks along more RWA-like lines. Hyperliquid was named as an example of a protocol that could serve as a bridge between native crypto narratives and traditional financial valuation logic.
ArkStream’s closing point was that in coming quarters, the durability of protocol revenue and buybacks may matter more than TVL or trading volume alone when judging crypto fundamentals. Speculative demand will not disappear, and meme or narrative-driven projects will still find room in the market. But for most teams, the era of easy token issuance as a primary growth model is over. During the period covered by the report, Blast and Abstract announced they were shutting down, and centralized exchanges continued delisting assets. Binance alone delisted 15 spot assets and 13 derivatives contracts in the third quarter. ArkStream described that cleanup as a painful but necessary part of crypto’s integration with the RWA world.
ArkStream’s bottom line
The report closed by tying together its three central arguments. On the macro side, repeated U.S.-Iran tensions pushed Brent from $73.74 to above $108, gasoline prices jumped 27.4% year over year, and one-year consumer inflation expectations rose to 4.6%. The Fed delivered its first rate hike since 2023, the market assigned roughly a 94% chance of another increase before year-end, and the 10-year Treasury yield reached 5.25% on Sept. 28, the highest since June 2007. In that environment, bitcoin moved with the Nasdaq and away from gold.
Inside crypto, the market improved after Aug. 19 and bitcoin rose 42% in the quarter, but the altcoin season index and bitcoin dominance showed that capital was still concentrated in bitcoin. Crypto perpetual volume bottomed in July and recovered into September, though third-quarter totals still lagged the first quarter. Robinhood Chain and Arc both scaled quickly after launch, yet their actual trading mix stayed heavily meme-driven, while tokenized equities and institutional settlement rails remained early.
At the industry level, ArkStream said the clearest expression of this RWA bull phase is the rise in stock-linked and other RWA perpetual volume on Binance and Hyperliquid. That category has become the crypto market’s main source of new volume in 2026. On-chain RWA assets grew 85.2% year to date. Meme’s broad bull market is gone. Fresh capital mainly entered bitcoin through ETFs. And within the crypto-native segment, tokens tied to protocol revenue and sustained buybacks clearly outperformed.
ArkStream’s core view is that until the Strait of Hormuz is fully reopened and both oil prices and Treasury yields decline materially, bitcoin will likely keep trading with U.S. equity risk appetite. At the same time, the gap between crypto projects may widen further, and the sustainability of protocol revenue and buybacks may become a more important filter than before.