Bitcoin's 5-Wave Correction Nears End: Endpoint 44 Determines Short-Term Direction
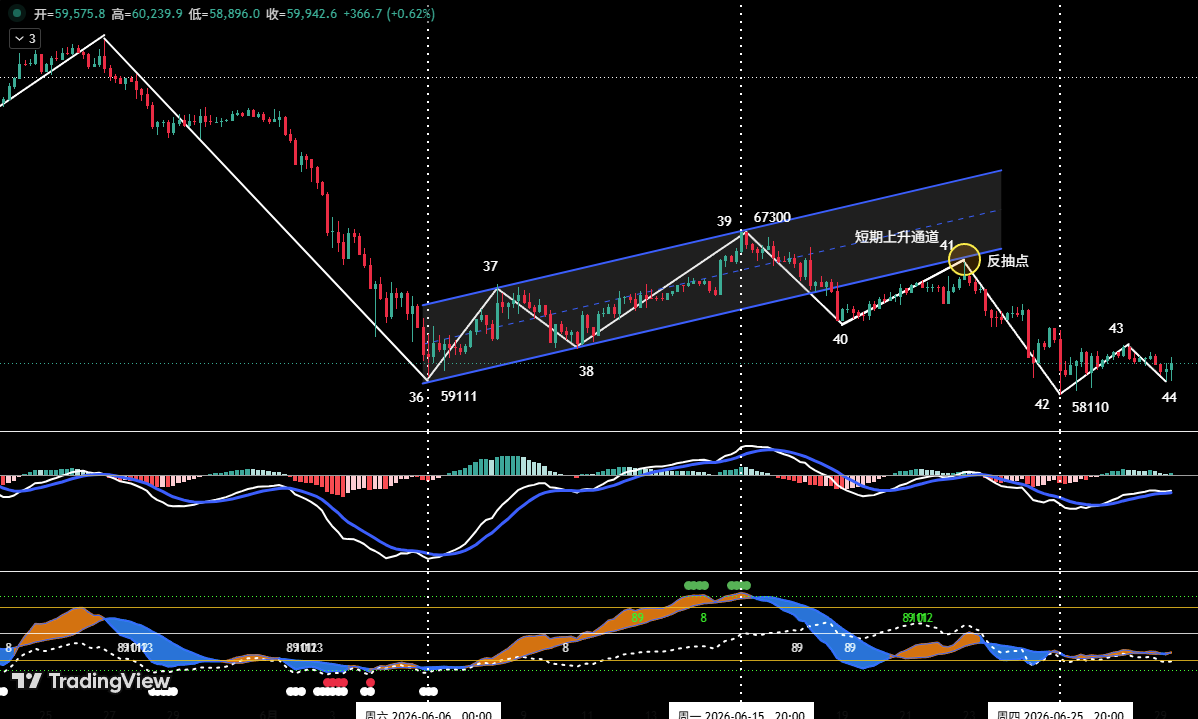
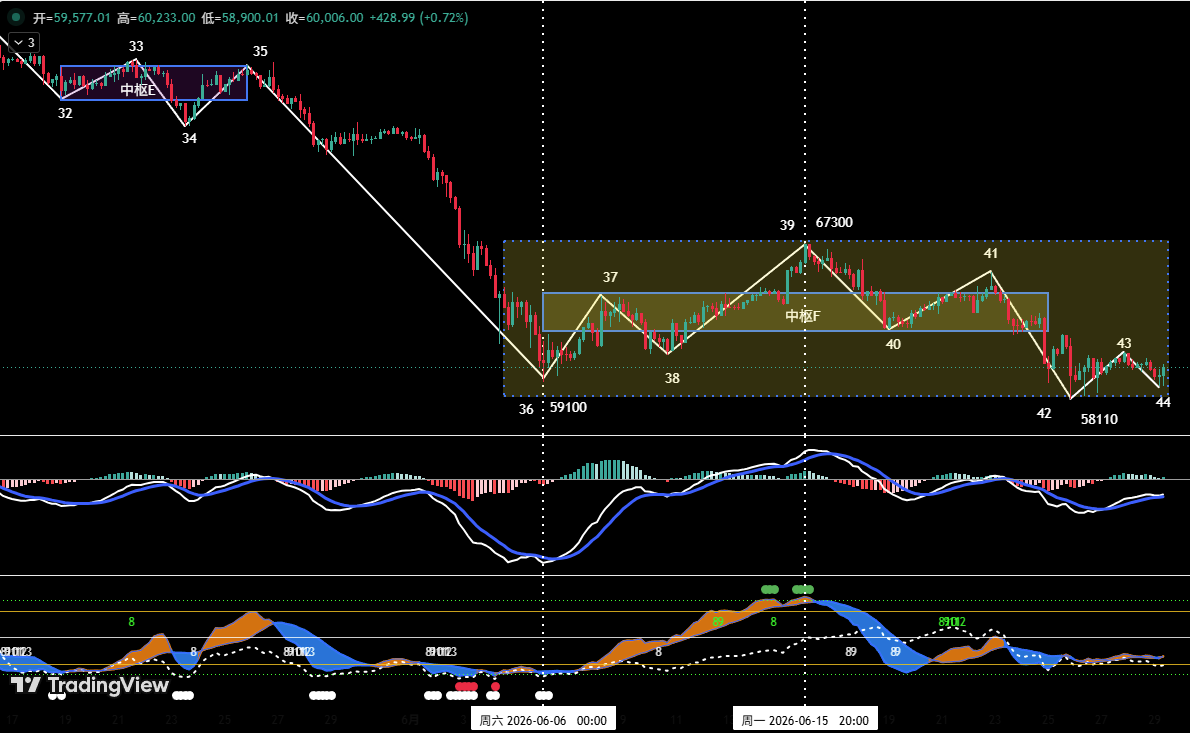
This week, Bitcoin (BTC) exhibits a clear five-wave corrective structure on the 4-hour chart (endpoints 39 to 44), currently in the (43-44) sub-wave. Last week's review highlighted that wave (40-41) was a retest after breaking below the short-term ascending channel (blue channel); failure to reclaim the channel lower bound signaled weakening momentum. Price found temporary support at $58,110. The final position of 'endpoint 44' is the key determinant of short-term direction: if above $58,110, a technical bounce is likely, followed by a wide range-bound consolidation; if below $58,110 but accompanied by hidden bullish divergence (momentum bottom divergence), a bounce remains possible but with uncertain strength; if below $58,110 without divergence, further breakdown is likely after a brief consolidation. According to the proprietary quantitative model, the first two scenarios have higher probability.
Key Resistance/Support Levels and Trading Playbooks
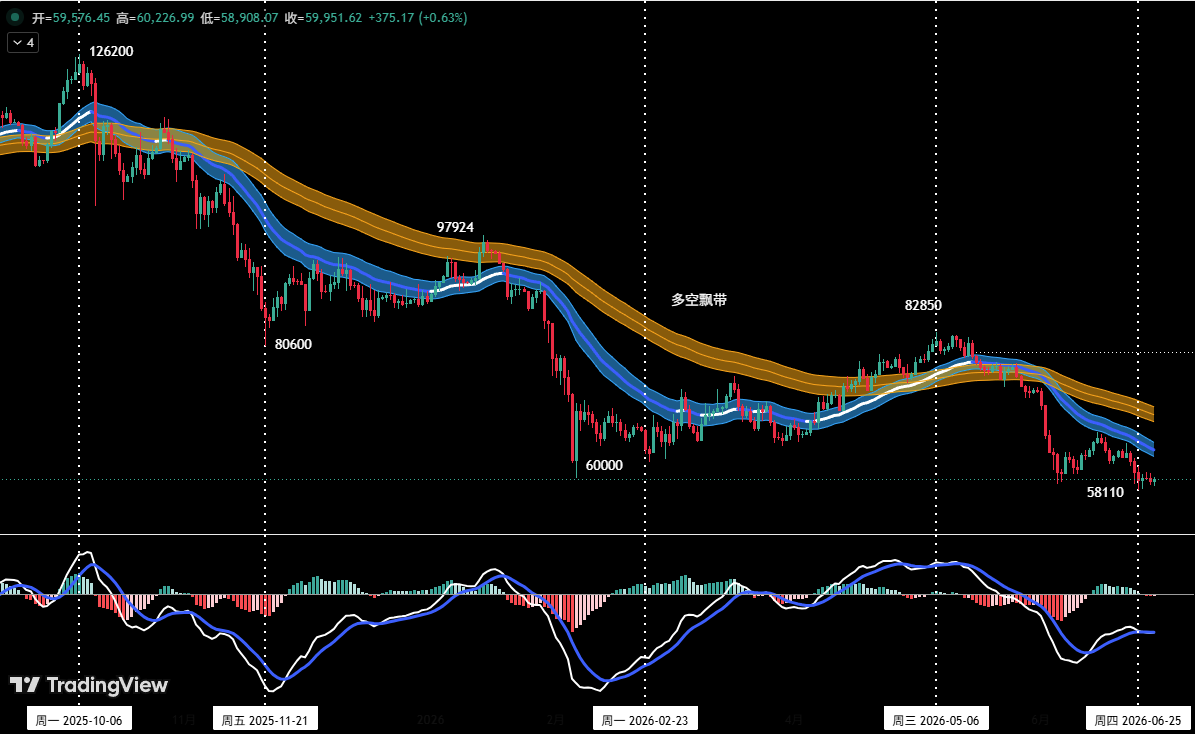
Core resistance zones: first at $60,900–$62,300 (previous major high/low levels), second near $65,500, third at $67,300–$69,500. On the support side, the chart shows BTC has effectively broken the 'long-short channel', confirming a bearish market structure. Mid-term strategy: maintain 20% short position. Short-term strategy: allocate 30% capital for swing trades using 30-min/60-min charts, targeting price differences between support and resistance. Three specific playbooks (A/B/C) are pre-defined to adapt to different market scenarios.
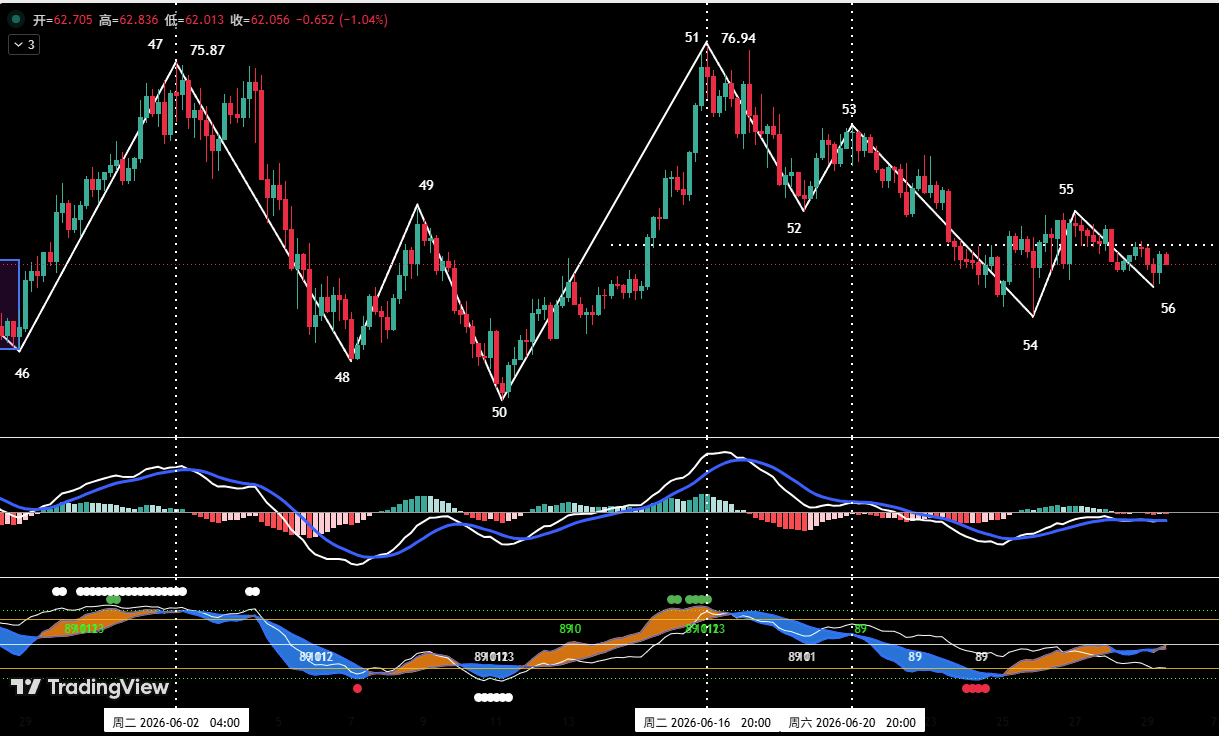
HYPE 5-Wave Correction: Support Zone Emerges in Wave 55-56
HYPE began a corrective decline from its June 16 high of $76.94 (endpoint 51). The 4-hour chart reveals a five-wave structure (waves 51-52, 52-53, 53-54, 54-55, 55-56), with the current wave 55-56 in progress. The formation of 'endpoint 56' will be crucial. Quantitative models indicate a higher probability of the first scenario (double bottom bounce). Key resistance levels: first near $65.5, second near $71.5. Key support zones: above $58.8 and the deeper $52–$54 area. Short-term strategy recommends 'buying dips, avoiding chasing rallies': when price stabilizes in the support zone and both the spread-trading model and momentum model generate bottom signals, traders may consider light long positions with position size strictly below 30% and tight stop-losses.
Last Week's Trade Verification and Risk Disclaimer
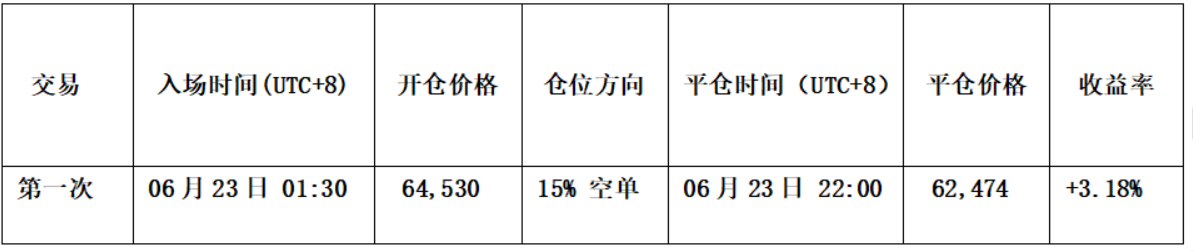
Last week, two short trades were executed according to the plan: the first was opened at $64,530 (15% size) and closed at $62,474, realizing a profit of ~3.18%; the second was opened at $62,679 (15% size) and closed at $60,775, realizing a profit of ~3.03%. Combined profit: ~6.21%. All analysis and strategies presented here are based on personal technical analysis and trading logs; they do not constitute investment advice. The cryptocurrency market involves extreme risk; please make independent decisions.