

Bitcoin is back near the 50-week moving average, a level that Jake Pahor says has marked the end of the last three Bitcoin bear markets.

In a MarsBit-translated article, Pahor wrote that BTC rose 22.8% over the week, its biggest weekly gain since March 2023. The article lists Bitcoin at $78,153, with the 50-week moving average near $81,000. Price touched that line on Friday, then fell back to about 3% below it.
Pahor said the market is focused on that level because it tends to act as a rebound point during bull markets and as the ceiling for failed rallies during bear markets. To test whether the current setup matches past cycle bottoms, he reviewed 5,322 days of score history going back to 2012 and isolated every bear-market ending in the data.
CSH score rises to 37.6
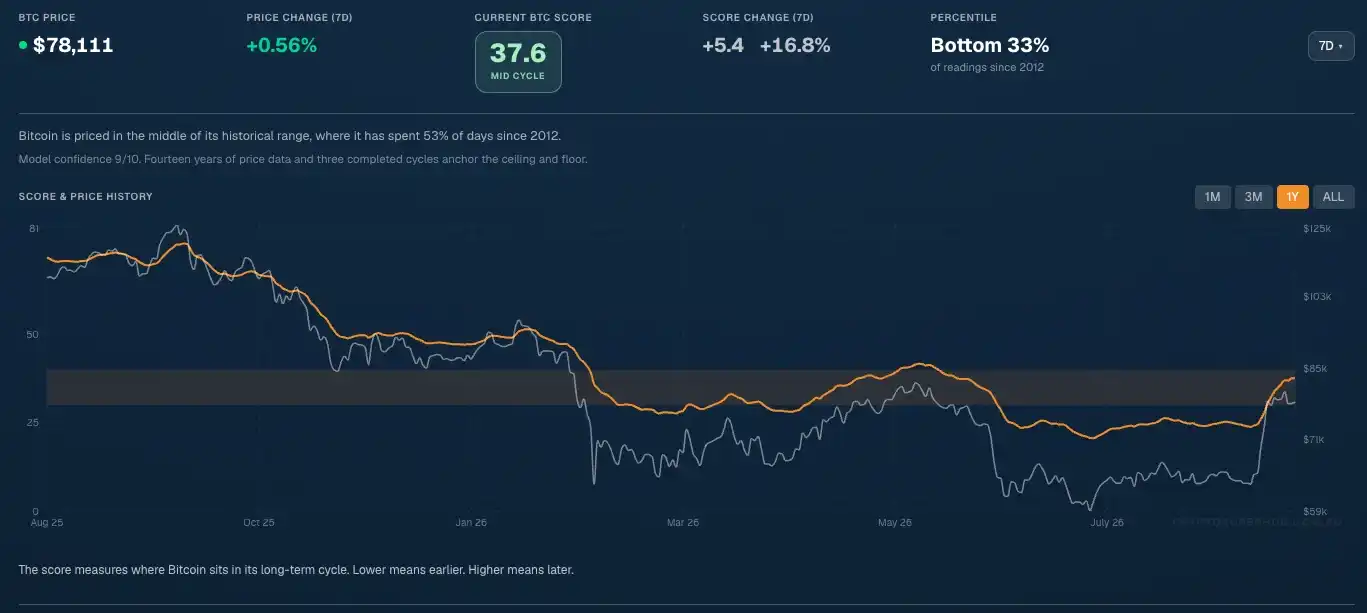
The article says the current CSH score is 37.6, in the middle of the cycle, up 5.4 on the week, or 16.8%. That places it in the bottom 33% of all readings since 2012.
Pahor wrote that his plan stopped buying on Aug. 22, when the score moved back above 30 after spending 79 straight days below that threshold. Under his rules, dollar-cost averaging pauses when the score is above 30, resumes mechanically if it drops back below 30, and activates a reserve cash tier if the score falls below 20.
He also listed several current-cycle figures: it has been 327 days since the October top; the bear-market low so far is $58,551 on July 1, representing a 53.1% drawdown; and the CSH score spent 115 days at 30 or lower during this bear market, all within the 20 to 30 band, without ever breaking below 20.
Three prior bear markets ended the same way
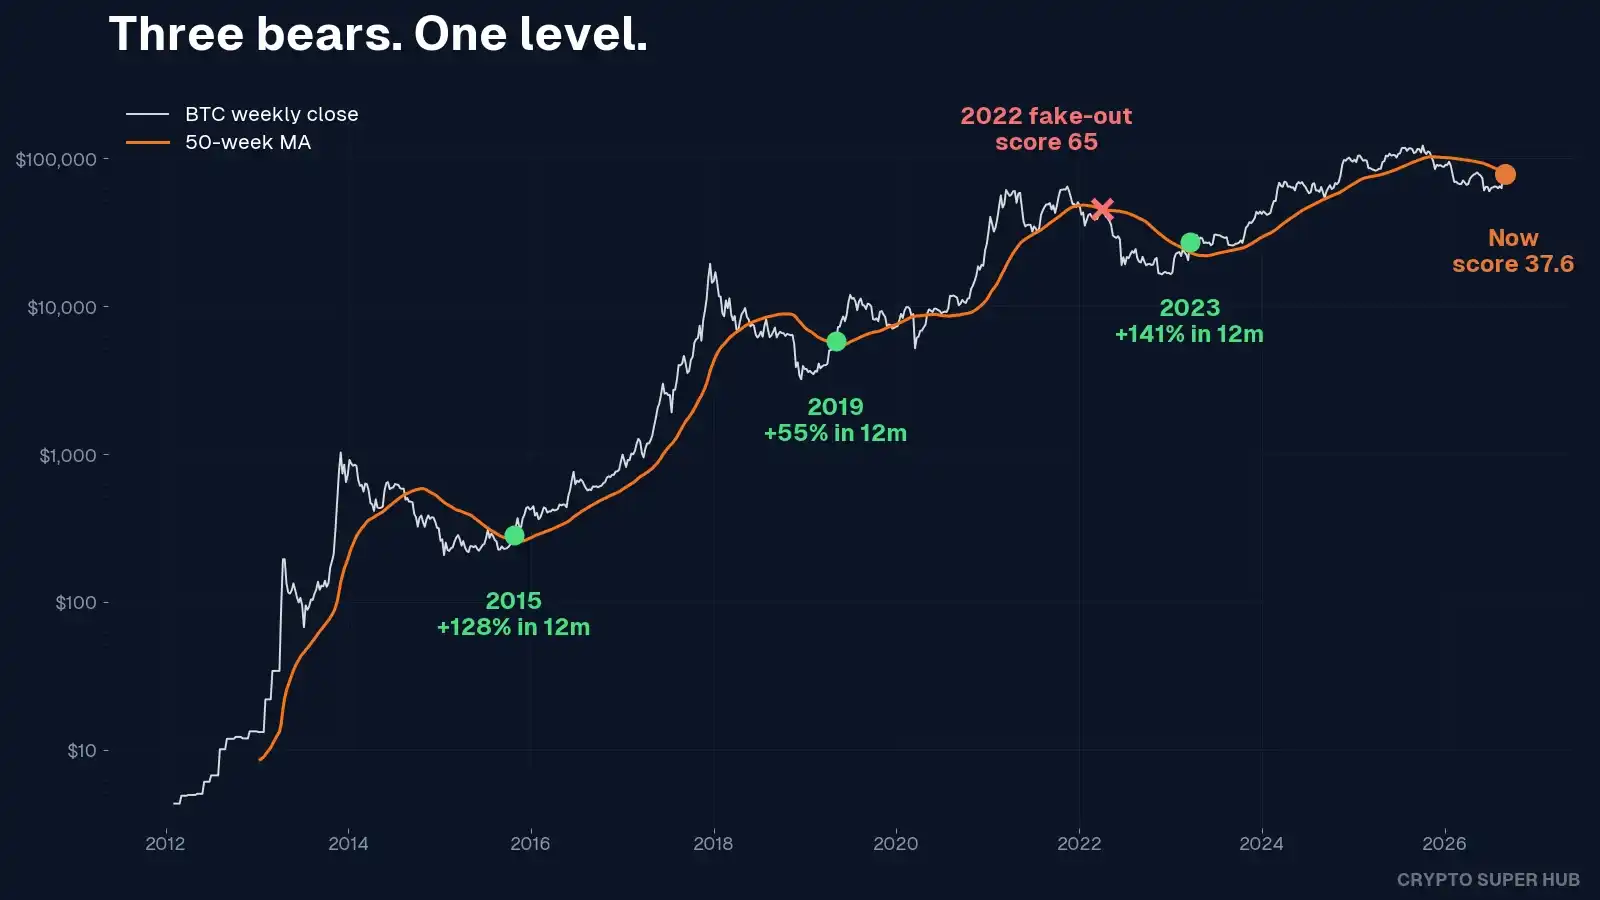
Pahor’s central finding is that the last three Bitcoin bear markets all ended in the same pattern: the first weekly close back above the 50-week moving average after the cycle bottom.
- Oct. 25, 2015
- May 5, 2019
- March 19, 2023
According to the article, each case shared the same follow-through. Over the next six months, Bitcoin never posted another weekly close back below the line, and the bear-market low was never revisited. Twelve months later, Bitcoin had gained 55%, 128%, and 141%, respectively, from those reclaim-week closing prices.
Pahor also pointed to one detail he did not expect: the most recent reclaim week, March 19, 2023, posted a 32.1% green candle. Since then, the biggest weekly gain had been last week’s 22.8% move.
The dataset includes one false signal
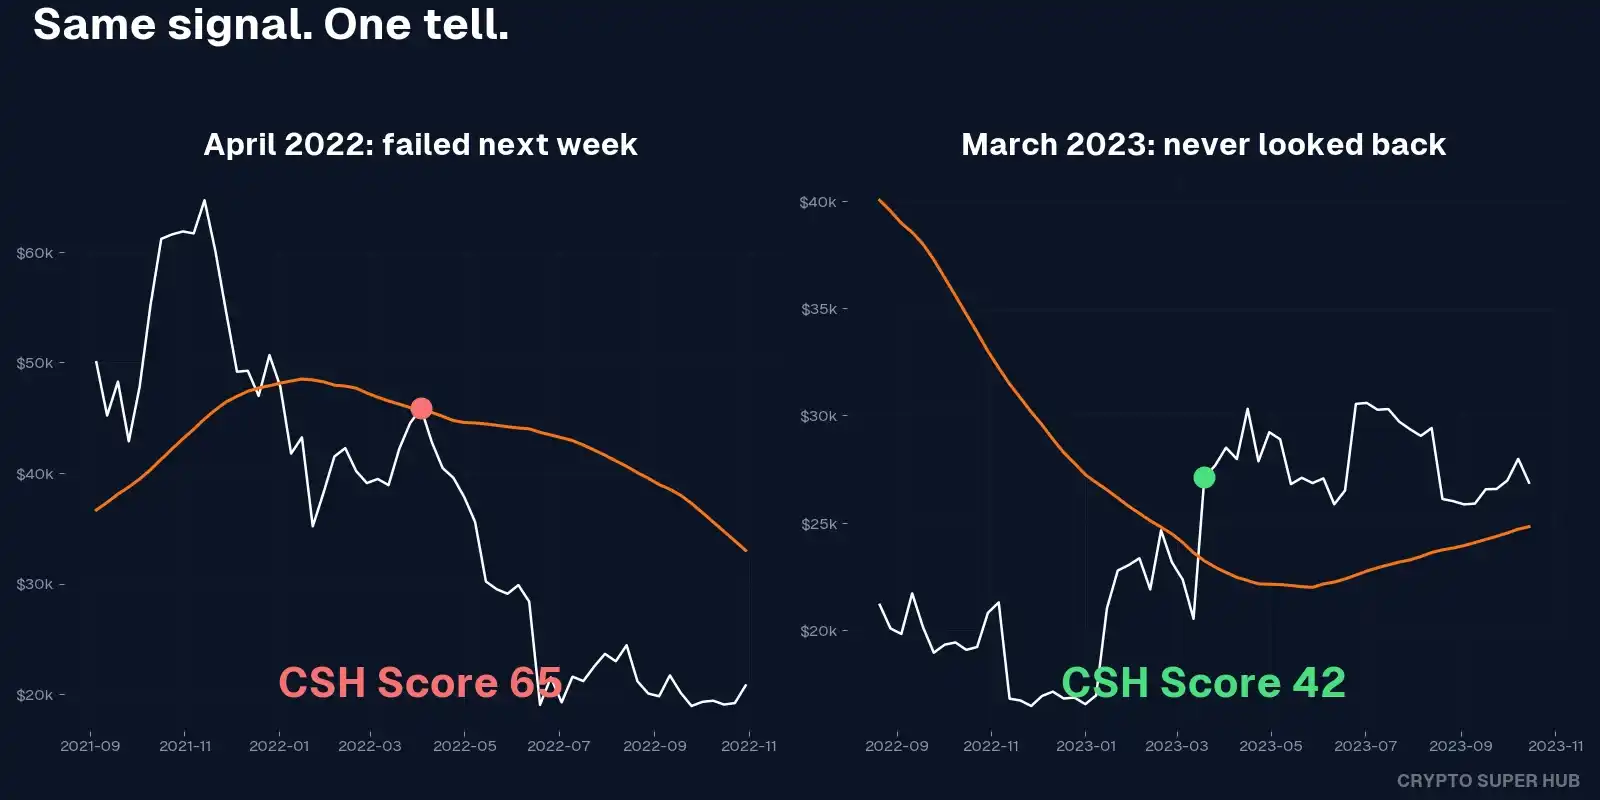
The article says there has only been one false signal in the full dataset. On April 3, 2022, Bitcoin managed a weekly close above the 50-week moving average in the middle of a bear market. That move failed the very next week, and the ultimate low did not arrive until seven months later, 64% below that level.
Pahor said the distinction between that fake breakout and the three valid recoveries was not visible in the price chart alone. It showed up in the CSH score. At the April 2022 close, the score was 65.4, with no capitulation-style selling behind it and price still expensive relative to its own cycle. By contrast, the three genuine reclaim setups all came off score bottoms of 22.1, 14.6, and 2.3, while the reclaim weeks themselves carried readings of 47.5, 41.9, and 19.5.
Today’s score is 37.6, rebounding from a 20.6 low. Pahor said that shape looks closer to a true signal than a false one.
Why he is not calling the bottom confirmed yet
Pahor still flagged two reasons for caution.
The first is drawdown depth. This bear market has only retraced 53.1%, which he called the shallowest on record, against prior declines of 75% to 83%. The CSH score also never dropped below 20. At the same time, he noted that the 2018-19 bear market bottomed and reversed without printing sub-20 readings, so a final washout is a pattern, not a rule.
The second is timing. The three successful reclaim events happened 284 days, 141 days, and 118 days after the bottom. If July 1 was the low this time, the market is now only at day 60. Pahor wrote that Bitcoin has never moved this quickly from a bear-market low to a weekly attempt to regain the 50-week moving average.
His conclusion in the article is that the full historical signal has not appeared yet. What ended the prior three bear markets was a weekly close above the 50-week moving average that then held in the following weeks. What has appeared so far is the setup: a deep score trough, a sharp surge off the lows, and price pressing directly into that level.
How his buying plan has been executed
Pahor said he did nothing this week because his plan had already been running for seven months. During the 115 days when the CSH score sat between 20 and 30, the system bought Bitcoin every day. When the score moved back above 30 on Aug. 22, buying stopped automatically.
He said he is still holding cash reserved for a sub-20 score, a condition that may never arrive. If this is the bottom, then the full buying window has already been filled on autopilot. If not, the rules for the next leg down are already written.
The article also compares two approaches using the same amount of money since the October top. Buying every day would have produced an average cost of $76,551. Buying only on days when the CSH score was 30 or lower would have produced an average cost of $64,759. With the same capital, the second method accumulated 18.2% more Bitcoin.
Pahor added that CSV import is now live for My Plans and said he used it to upload every Bitcoin purchase made by his SMSF since August 2024. Looking back, he found that one quarter of his buying capital had been deployed when the CSH score was above 70, all before the plan was built.
Macro backdrop shifts to the Fed
The article also turns to macro conditions. Following Jackson Hole, the tone shifted hawkish. New Federal Reserve Chair Kevin Warsh said in his first keynote on Friday that inflation remained too hot and left the door open to a rate hike. The figures cited in the piece were 3.7% for full-year PCE and 4.1% on a six-month annualized basis.
Using CME data from Aug. 28, Pahor wrote that futures markets raised the probability of a September rate hike overnight from 35% to about 59%.
He identified two key dates ahead: Aug. CPI on Sept. 11 and the Federal Reserve decision on Sept. 16. If the Fed hikes, he said, it would be the first time the crypto market has faced renewed tightening since the 2022 bear market.
The article also lists moves in other assets. Gold gave back 3.2% this week, equities were flat, and the VIX sat at 14.4. In his view, Bitcoin’s rise over the past two weeks was not driven by a broad risk-on wave across all assets.
Two paths from here
Pahor framed the near term around a single question: can Bitcoin hold near the 50-week moving average, or will it be sharply rejected there?
In the first path, Bitcoin closes the week above the 50-week moving average and holds it. He said that was the signal that ended the last three bear markets, and if it happens again, he would turn bullish.
In the second path, price falls hard. He wrote that every bear market since 2013 has seen rallies fail at this area, and in that case he expects another test of the range low.
His plan has actions for both outcomes. If the CSH score drops below 30, buying resumes. Below 20, allocation increases in heavier tiers. If Bitcoin posts a weekly close above the 50-week moving average and holds it, he said he would explicitly shift his positioning language from a 50-50 stance to bullish.
The piece ends with a disclaimer from Crypto Super Hub, which says the content is for general information and education only, does not constitute financial advice, and does not take account of any reader’s objectives, financial situation, or needs. It also states that crypto is volatile, losses are possible, past performance does not guarantee future results, and the team itself holds Bitcoin.