

Bitcoin rallied close to 25% in August, jumping from about $64,420 on August 19 to nearly $80,700 by August 25. Since then, price action has turned into a grind: a week of sideways movement and a partial fade, with BTC last trading around $77,470.
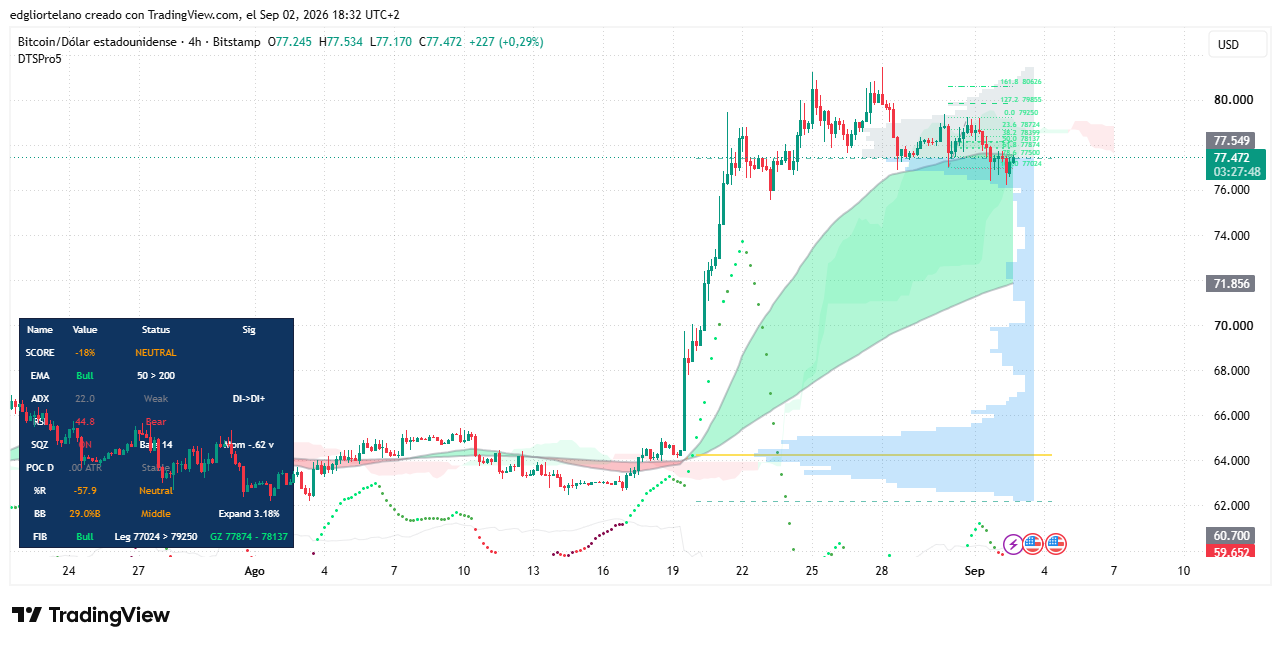
That profile—a sharp spike, a flat top, then some giveback—is why crypto traders have returned to a familiar phrase: the “Bart Simpson” pattern.
The term is a chart nickname, not a formal technical indicator. It describes a quick move in one direction, a tight period of sideways trading, and then a snap back toward the level where the move began, creating a silhouette that resembles Bart Simpson’s spiked hair. The label has circulated in crypto markets since 2015 and tends to reappear when Bitcoin posts a fast rally in a narrow range, as it did in August.
What the four-hour chart is showing now
A completed Bart Simpson pattern would point to a flash crash. For now, Decrypt says Bitcoin’s four-hour chart is sending mixed signals rather than an outright warning.
The Relative Strength Index, or RSI, measures whether an asset is overbought or oversold on a 0-100 scale. BTC’s RSI is currently 44.8. That leans bearish, but it is still well above the sub-30 zone that usually accompanies a deeper breakdown.
The Average Directional Index, or ADX, tracks trend strength without regard to direction. It is sitting at 22, below the 25 threshold many traders use to confirm that a market is actually trending.
The article singles out the Squeeze Momentum indicator as the most concerning data point. That tool is used to flag volatility compression before a breakout. In Bitcoin’s case, it is currently bearish, and momentum is declining. The chart is also showing a compression zone, which suggests that a larger move may be ahead. If that move breaks lower, the Bart Simpson setup could take shape. If the breakout goes higher, the bullish trend would be reinforced.
At the same time, the 50-period exponential moving average remains above the 200-period moving average, which is the classic definition of a bullish trend structure even as short-term momentum cools. In that kind of setup, a full Bart Simpson reversal is generally less likely because average price structure still favors the upside.
None of the readings on their own point to an imminent crash. That is one reason analysts remain divided over whether the pattern will fully develop this time or stay as a trading meme attached to a choppy consolidation.
What a real flash crash would need
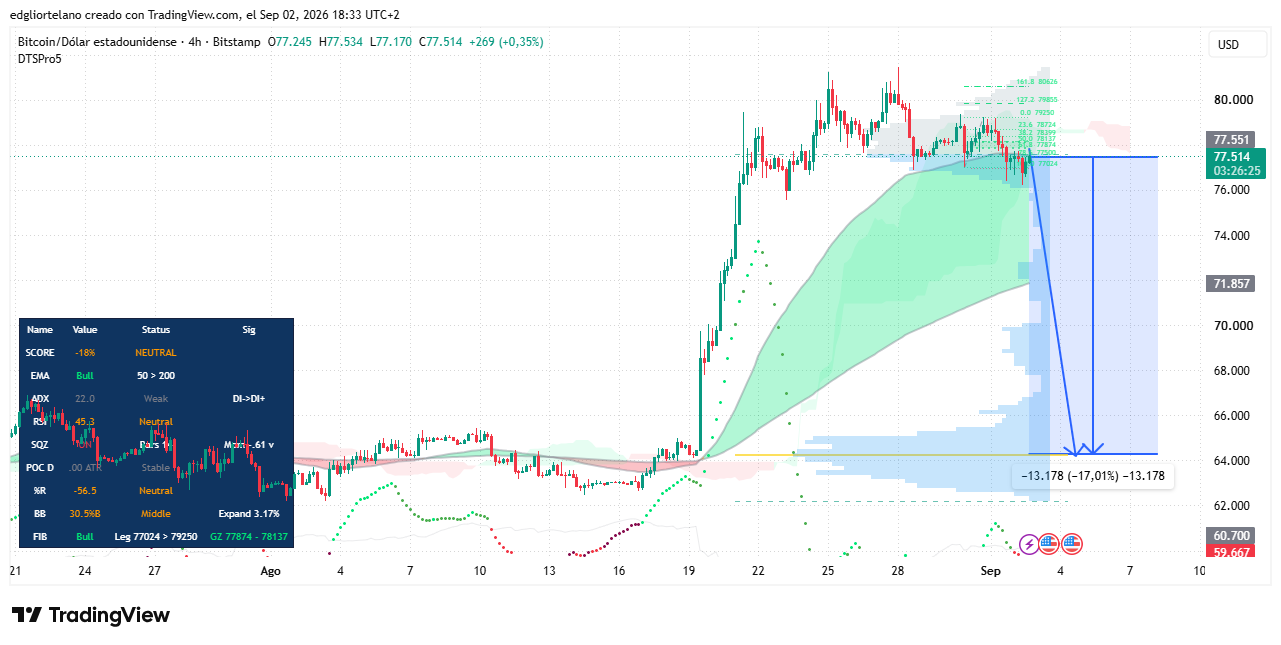
The defining feature of a completed Bart Simpson pattern is speed. The reversal has to happen at roughly the same pace as the initial rally.
Applied to Bitcoin’s current structure, a true flash-crash version would mean giving back the full August advance within hours rather than over a period of weeks. That would pull BTC back toward the $64,000 area where the rally started. Decrypt notes that such a drop would amount to roughly 17% in a single move, comparable in scale to the rally that came before it.
That outcome would not come from a slow drift lower. The article identifies a specific trigger level: $75,800. A break below that line would make the bearish setup more credible. Holding above it would tend to invalidate the case for a Bart-style breakdown.
A flash crash would also need a catalyst strong enough to force the move, especially cascading leveraged liquidations rather than an ordinary pullback. Bitcoin has seen that mechanism before. Decrypt points to a $19 billion liquidation wipeout tied to an October 2025 Trump tariff threat as an example of the type of event that can produce this kind of move. The mechanism exists; the article’s point is that this week’s four-hour indicators have not yet shown it appearing in real time.
That leaves the Bart Simpson pattern in the category of a debated possibility rather than a confirmed market event.
Why September is feeding the debate
The discussion is landing during what Decrypt describes as Bitcoin’s weakest month on the calendar. Since 2013, Bitcoin has finished eight of the last 13 Septembers in the red, with an average loss of 2.97%. By both average and median performance, September has been the worst month, which is why traders often refer to it as “Red September.”
This year, that seasonal weakness is colliding with a live Federal Reserve decision. The CME FedWatch tool is currently pricing in a 64% chance that the Fed raises rates at its September 15-16 meeting. That is usually negative for risk assets, including crypto, because higher borrowing costs can push investors toward perceived safe-haven assets such as gold and bonds.
Fund flows have also added to the cautious tone. Spot Bitcoin ETFs recorded roughly $236 million in outflows on Tuesday alone. Oil, meanwhile, has climbed into the low $90s per barrel after fresh U.S.-Iran strikes near the Strait of Hormuz, adding inflation pressure to the rate-hike case described in the article.
Decrypt stops short of saying any of that guarantees a crash. The article’s point is narrower: these are factors worth weighing before putting on trades. A Fed-driven risk-off move and a Bart Simpson flash crash are different mechanisms, even if both currently imply downside risk.
The other bearish path: a correction, not a flash crash
Decrypt also lays out a second bearish scenario, one that does not resemble a Bart Simpson pattern at all.
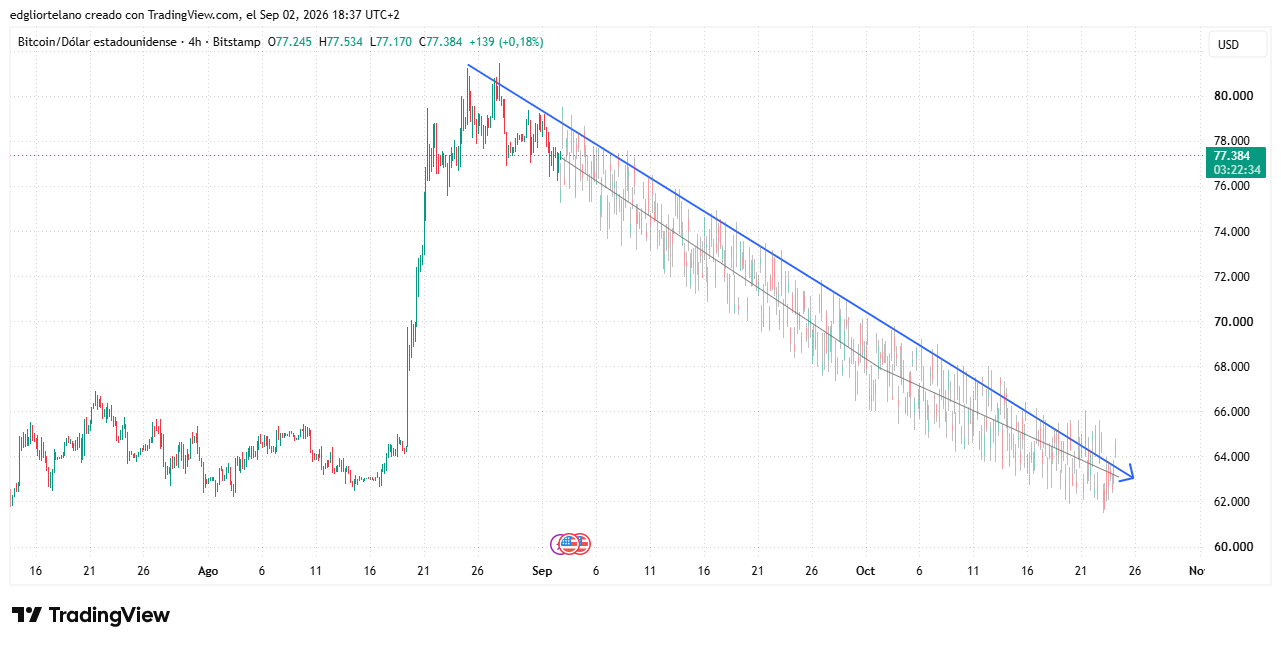
Using a descending trendline from the roughly $80,626 August high, together with support levels, current indicators, and what the article calls natural expectations, the chart suggests a gradual downward channel. In that version, Bitcoin would not collapse in a single violent leg. Instead, it could slide toward the $62,000 area over about eight weeks, taking the move into late October.
The percentage decline would be similar to the flash-crash case, but the timing would be very different. Rather than unfolding in hours, it would stretch across a seasonally weak September and a historically volatile October.
The article says that this slower structure also has precedent in Bitcoin’s recent chart behavior. Decrypt reported in March that Bitcoin was tracing a compressive wedge, a formation made up of lower highs pressing against descending resistance. According to the article, that setup preceded breakdowns in October 2025 and January 2026. Both were grinding structural declines, not one-candle collapses.
That distinction matters for traders. A flash crash would require a forced liquidation event and a fast break below $75,800 to complete the shape. A drawn-out correction would need far less drama: September seasonality, a Fed hike, and time.
Decrypt notes that the views expressed in the article are for informational purposes only and do not constitute financial, investment, or other advice.