

Bitcoin ETF weekly inflow and outflow figures are frequently interpreted as a thermometer of institutional confidence in Bitcoin. However, a closer look reveals that a significant portion of the weekly noise originates from a hidden interest-rate trade—cash-and-carry arbitrage—rather than directional conviction.
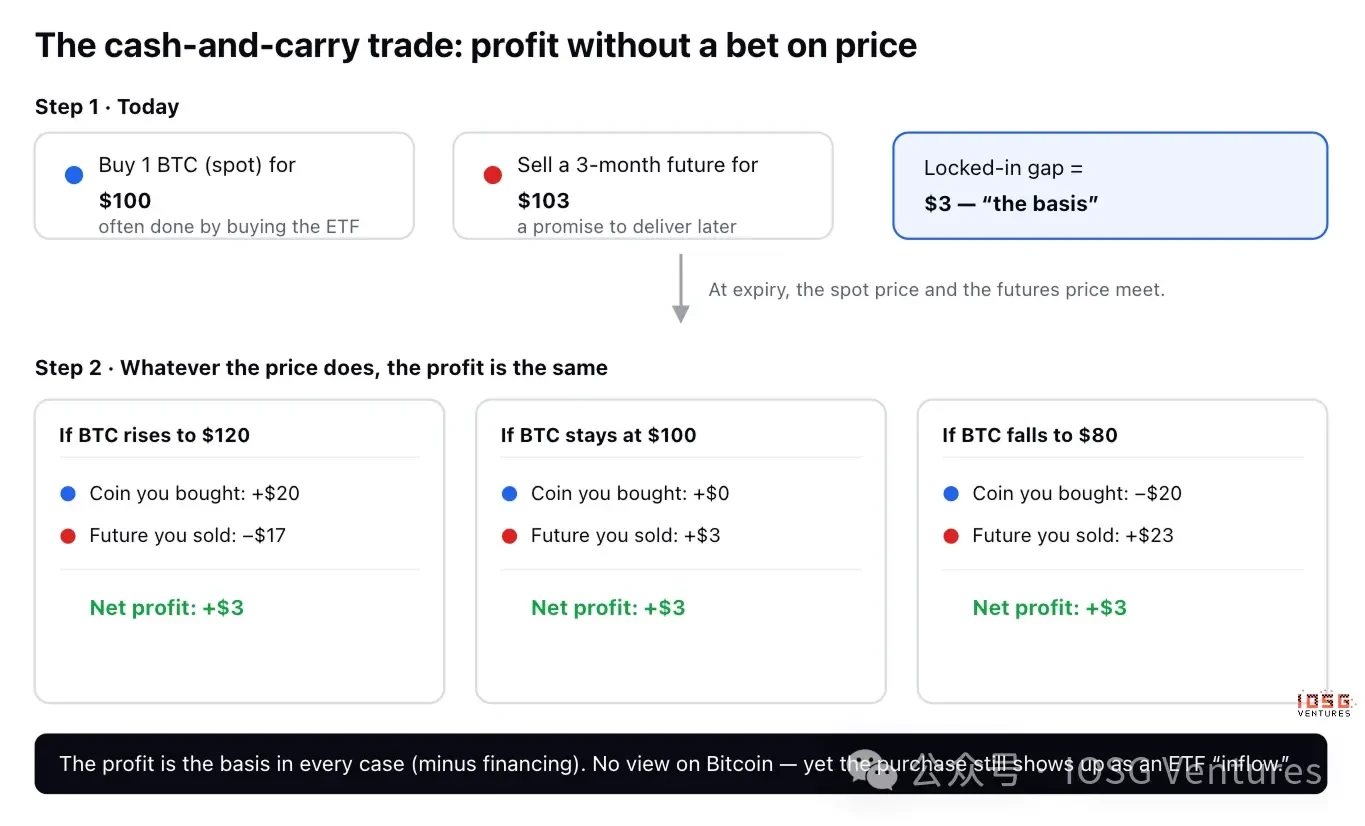
Cash-and-Carry: Disguised as Conviction
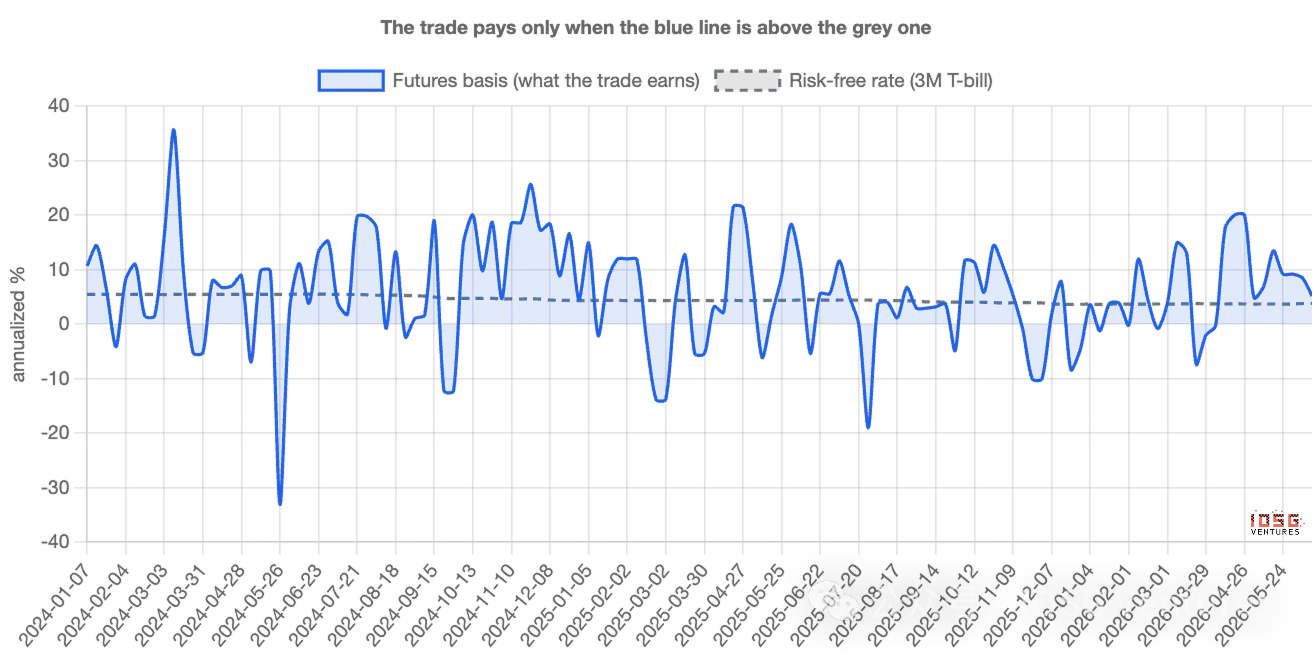
The cash-and-carry arbitrage is a classic risk-free strategy: when Bitcoin futures trade at a premium to spot, traders buy the spot (often via an ETF) and sell an equivalent amount of futures, locking in the spread (basis). Regardless of Bitcoin's price movement, the profit equals the annualized basis, as long as it exceeds the risk-free rate from U.S. Treasuries. The key point is that the spot purchase by arbitrageurs appears in ETF flow data exactly like a long-term holder's purchase. However, arbitrageurs leave a second footprint—they establish short positions in CME futures. True believers leave only the first footprint. By tracking the weekly Commitment of Traders (COT) report for leveraged funds (hedge funds), one can decompose how much ETF inflow is actually hedged.
Data Reveals Arbitrage Dominates Weekly Volatility
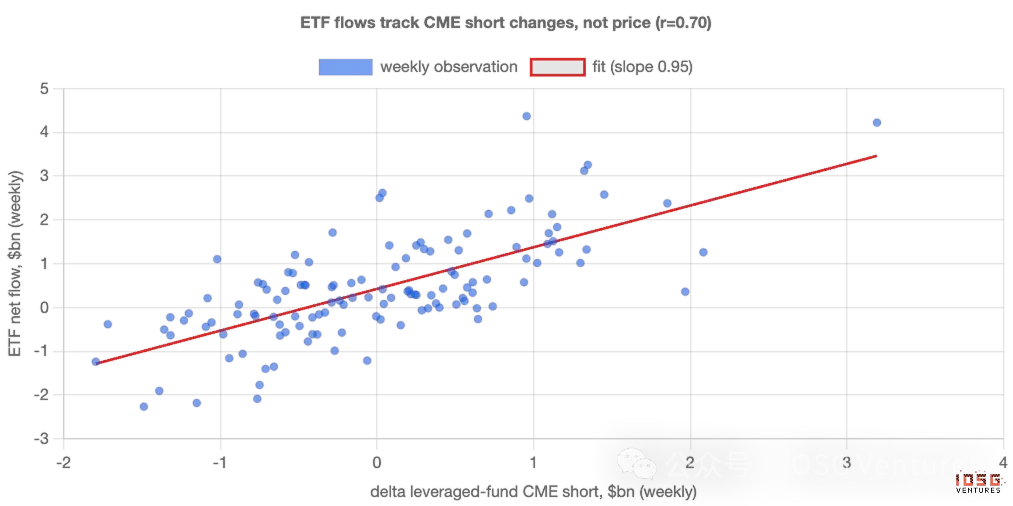
Since the launch of Bitcoin ETFs, weekly ETF inflows have moved almost in lockstep with new short positions held by leveraged funds, showing a correlation of 0.70. Roughly half of the weekly flow variation can be explained by this single factor: how much new short positions funds added. In contrast, Bitcoin's weekly return has virtually no statistical relationship with ETF flows—price itself explains nothing. This means weekly "demand" is not chasing performance but following the ebb and flow of basis profitability.
Scale: Small in Total, but Dominant in Volatility
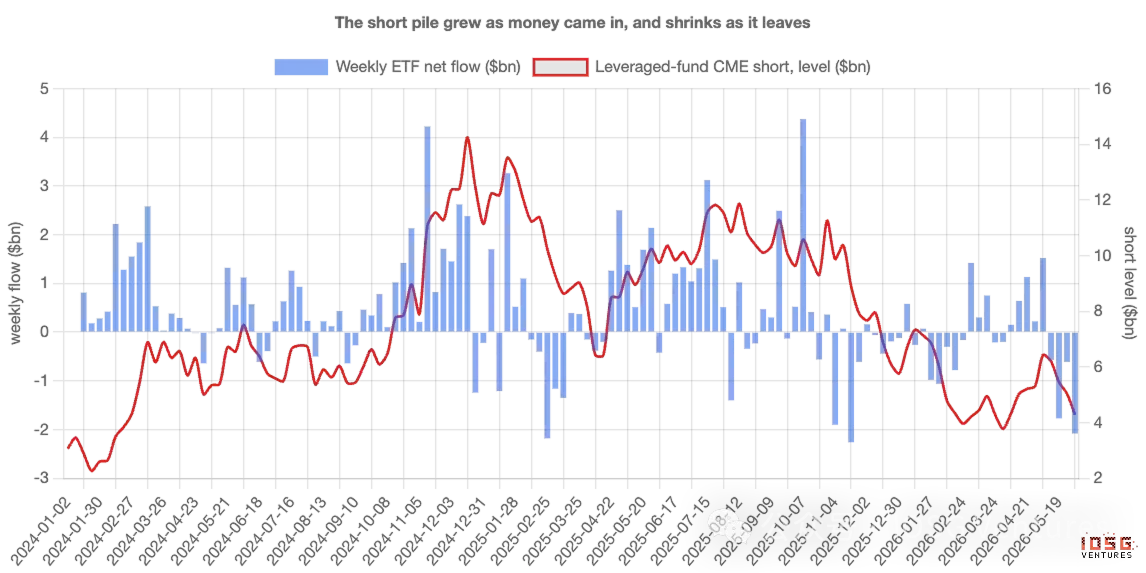
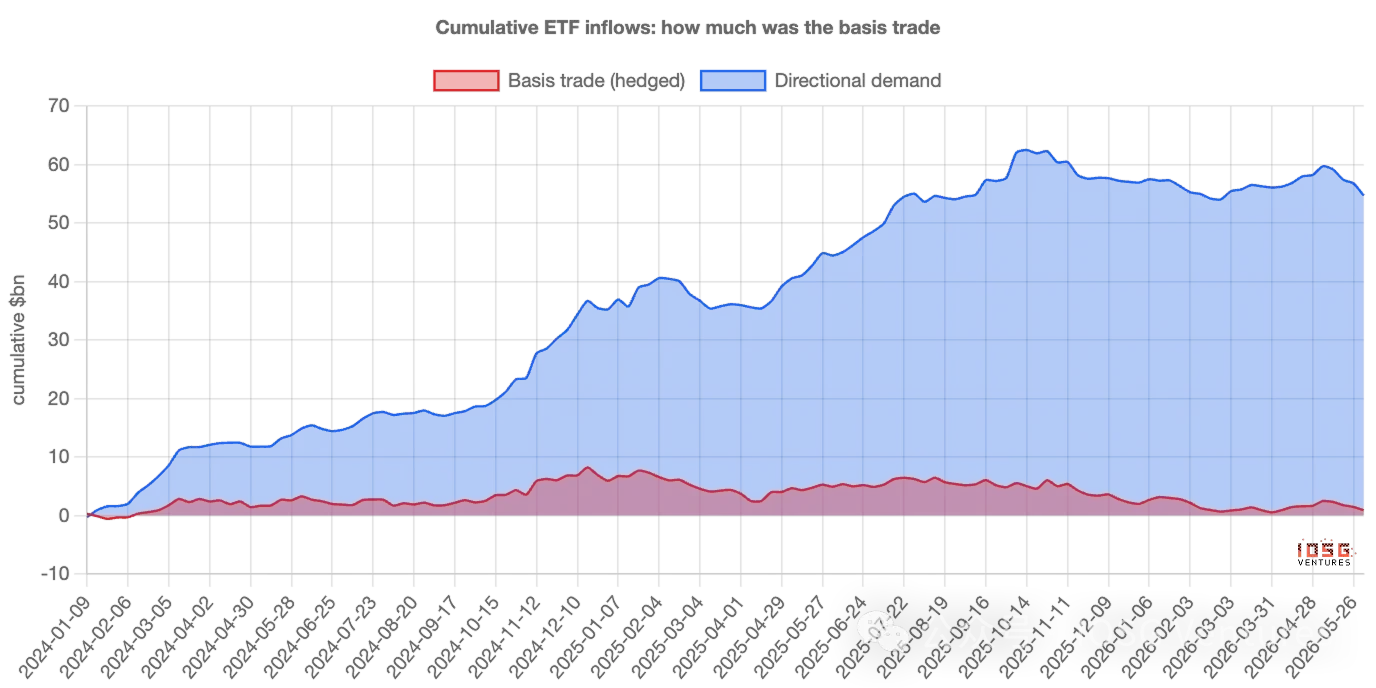
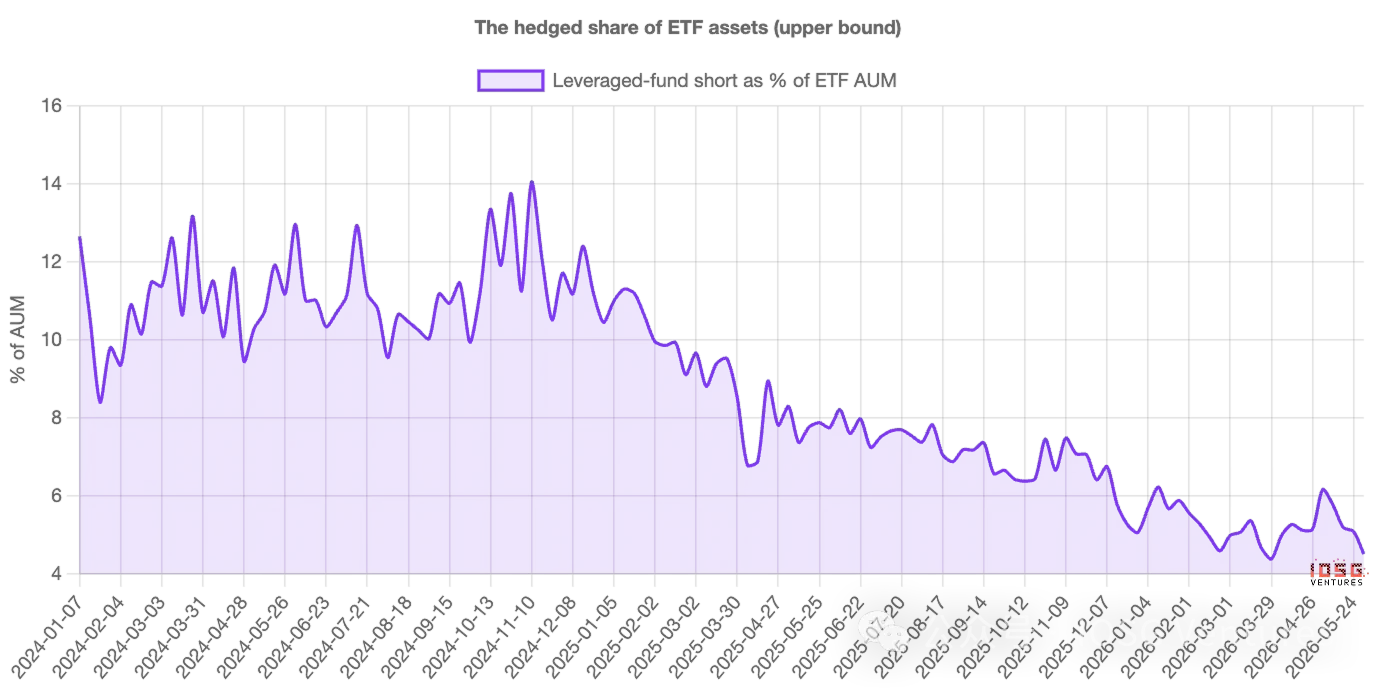
Despite dominating weekly swings, the arbitrage component has never been the majority of total holdings. Of the cumulative net inflow of approximately $55 billion since ETF launch, the current net arbitrage position is only about $1 billion. The rest is steady directional buying, averaging about $400 million per week, compounding over two years. As a share of ETF assets, the hedged portion peaked near 14% in 2024 and now stands at 4%–5%. In short, ETF flows overstate the volatility of conviction, not its level.
Leveraged funds' short positions grew from roughly $3 billion at launch to about $14 billion by end of 2024, then steadily declined to around $4.5 billion. In early June, shorts halved further to $4.3 billion, coinciding with $300–$500 million daily ETF outflows. On the surface, this looks like panic capitulation, but combined with futures data, it is merely a routine unwinding of a no-longer-profitable interest-rate trade.
Ethereum ETFs: Weaker Structure
Applying the same analysis to Ethereum ETFs shows a weaker pattern: lower correlation with short positions and almost no steady directional buying. The reason is that holding spot Ethereum forgoes staking yields of about 3%–4% annually, making the basis often negative and arbitrage unprofitable. Consequently, Ethereum ETFs lack both strong conviction and robust arbitrage support, resulting in a smaller, noisier market.
How to Interpret Flows Correctly
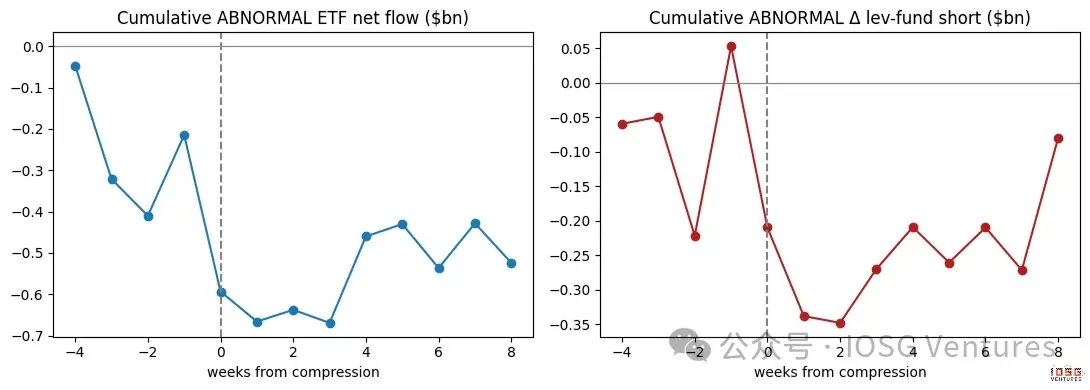
When basis is rich, expect "institutional demand" to appear strong and largely hedged—do not mistake that for conviction. When basis compresses, expect inflows and shorts to decline together—do not read outflows as a market judgment on Bitcoin. The two metrics to watch are the annualized basis relative to T-bill rates and the weekly net short position of leveraged funds in the CME COT report.
Honest limitations: the basis is constructed from the front-month CME futures contract against spot, excluding the last few days before expiry; the correlation is strong but not proof of causality; and the futures short is an upper bound for hedged ETF buying because some shorts may hedge coins held elsewhere. None of these alter the main thesis.
Week by week, Bitcoin ETF "demand" is largely a hidden interest-rate trade, not faith. The real buying is genuine, patient, and now constitutes the vast majority of holdings, as the “rented” portion has been gradually leaving over two years.