Bitcoin's Five-Wave Correction Nears End; Key Levels Determine Short-Term Direction
Bitcoin (BTC) is currently in the final segment of a clear five-wave corrective structure (wave 43-44) on the daily chart. The relief rally that began from the June 6 low of $59,100 ended at point 39 ($67,300), after which the correction resumed. Last week, price broke below the short-term rising channel and retested it before failing, eventually finding support at $58,110. Analysts note that the eventual location of endpoint 44 will be pivotal: if it settles above $58,110, a relatively strong technical rebound is expected, followed by a wide range-bound consolidation; if it falls below $58,110 with hidden bullish divergence from momentum oscillators, a rebound is still possible but likely weaker; if it drops below $58,110 without such divergence, further downside breakout is likely. According to proprietary quantitative models, the first two scenarios have higher probability.
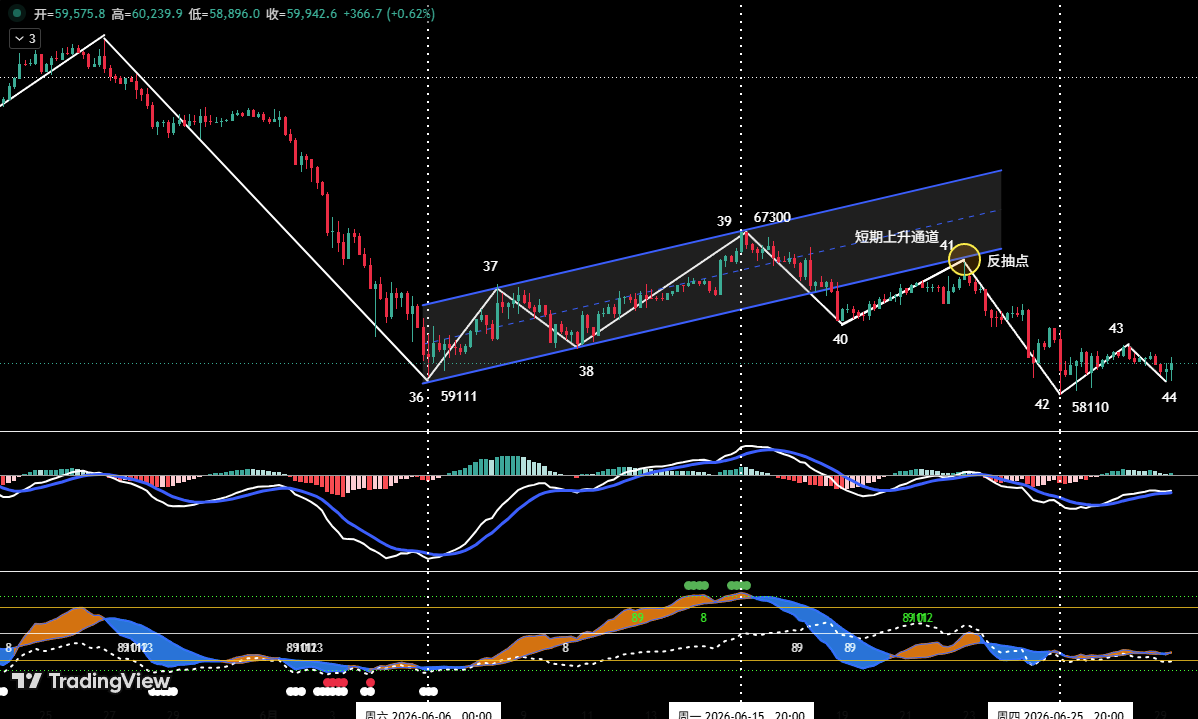
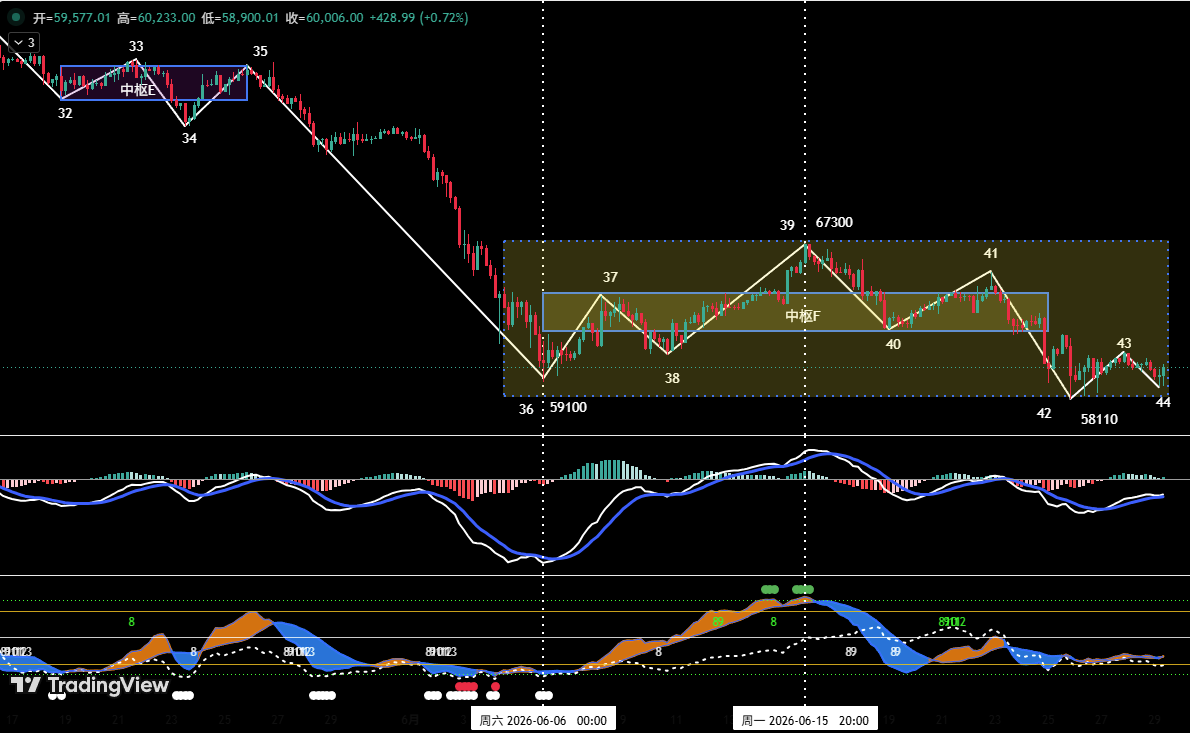
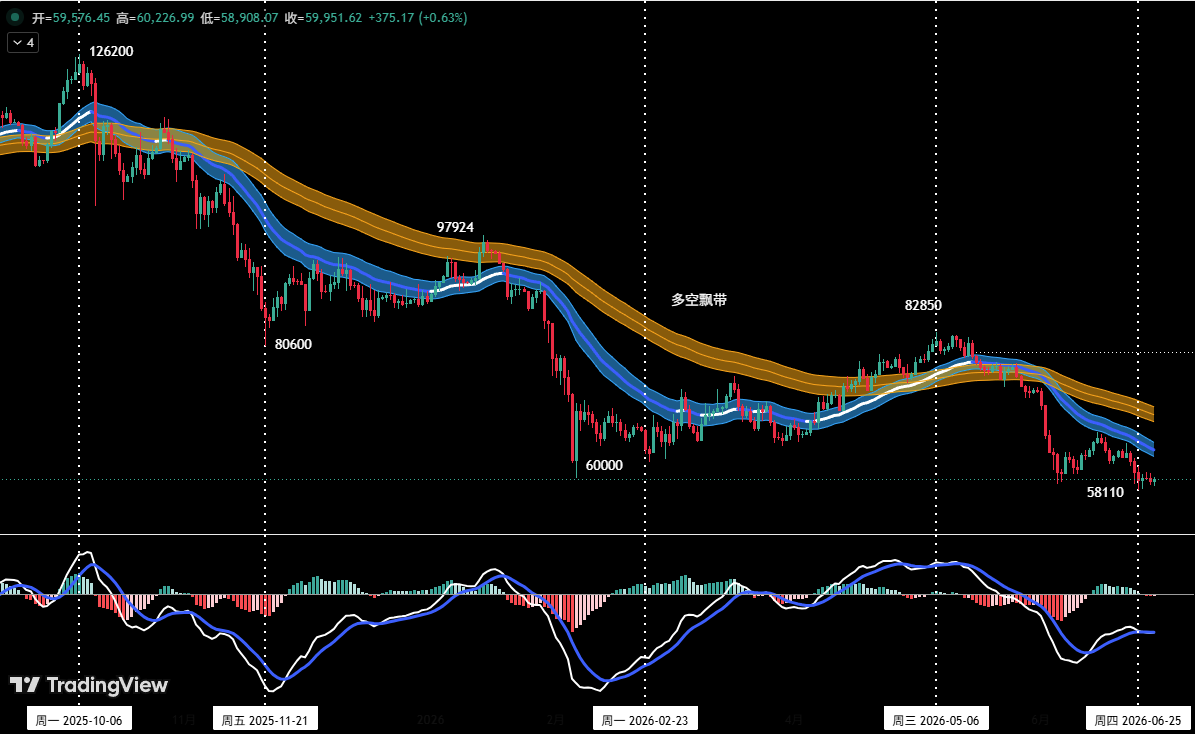
On the operational front, because BTC has broken below the bull-bear channel, the market structure is confirmed as bearish-dominant. Medium-term short positions are maintained at around 20%. Meanwhile, 30% of capital is allocated for short-term intra-swing trades using the 30-minute/60-minute timeframe, dynamically adjusting based on key resistance and support levels. Resistance zones are identified at $60,900-$62,300, near $65,500, and the $67,300-$69,500 region. Key supports are at $58,110 and lower levels. To handle complexity, three contingency plans (A/B/C) have been prepared, to be activated based on the actual formation of endpoint 44.
HYPE Approaches Support Zone; Short-Side Scalping Opportunity Emerges
HYPE has been correcting since its June 16 high of $76.94 (point 51). On the 4-hour chart, a five-wave structure (waves 51-56) is visible, with price currently in wave 55-56. The location of endpoint 56 will be critical for near-term price action. If endpoint 56 forms above the prior low (creating a double bottom), the probability of a significant rebound increases markedly. Quantitative models suggest the double-bottom scenario is more likely. Key resistance levels are around $65.5 and $71.5; support zones are above $58.8 and deeper in the $52-54 area.
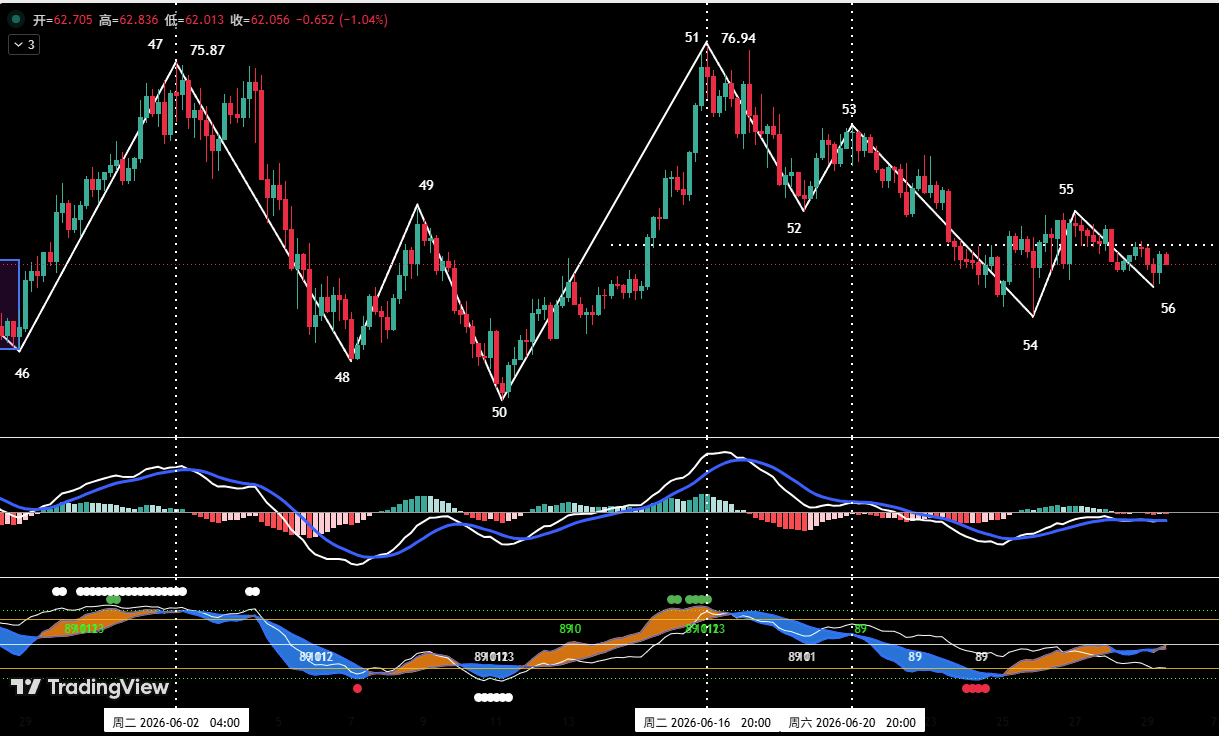
This week's short-term strategy is to “accumulate on dips, avoid chasing rallies.” When price stabilizes above $58.8 or in the $52-54 support zone, and both the spread trading model and momentum model trigger bottom signals, a light long position can be considered, with position size strictly capped at 30% and strict stop-loss adherence.
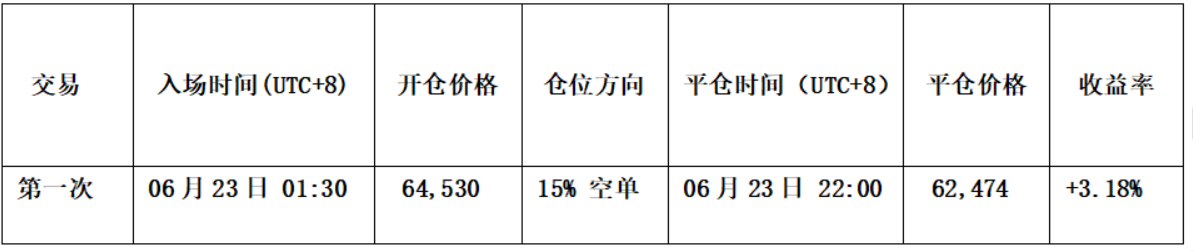
Last Week's Trade Review: Short Scalps Yield 6.21% Profit
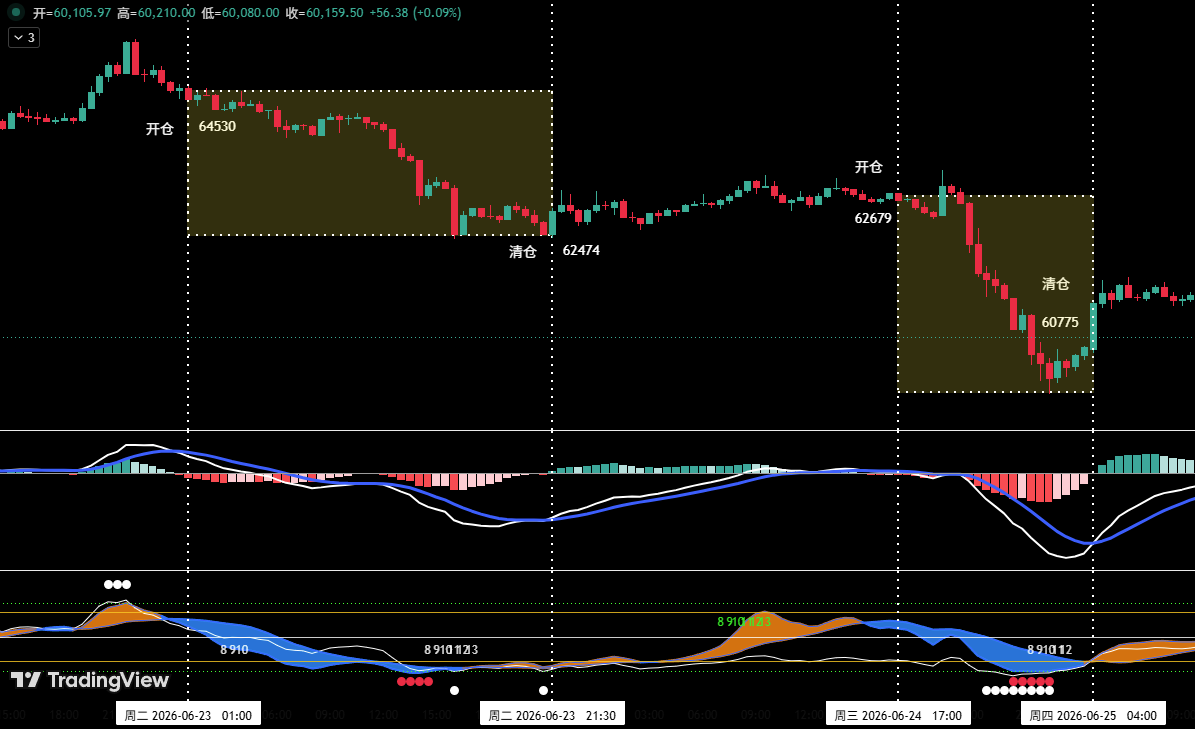
Operating strictly in accordance with the contingency plans and signals from the proprietary spread model and momentum model, the analyst executed two short-term short trades last week, both with 1x leverage, achieving a total profit of 6.21%. The first short was opened at $64,530 (15% position) and closed at $62,474, yielding a 3.18% gain. The second short was opened at $62,679 (15% position) and closed at $60,775, gaining 3.03%.
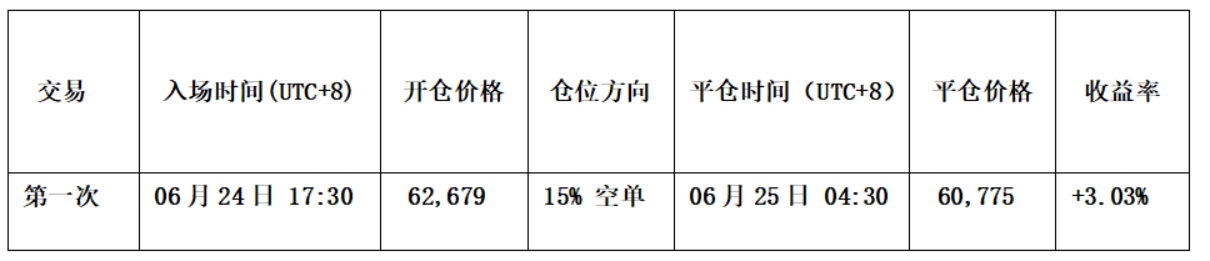
Risk Disclaimer: Financial markets change rapidly; all analysis and trading strategies require dynamic adjustment. This article reflects personal technical analysis and serves as a trading log only. It does not constitute investment advice. Market risk exists; invest with caution.