

By Ashrith Rao
Translated by Saoirse, Foresight News
Bitcoin climbed as high as $81,500 last week, lifting market sentiment with it. A closer read of the data in the source article points to a market leaning heavily on leverage, with little sign that a durable trend had taken hold.
Over seven days, total crypto market capitalization rose from $2.21 trillion to $2.64 trillion. ChainCatcher data cited in the piece showed daily trading volume surging from $40 billion to $162 billion. Bullish positioning also accelerated in options: BlackRock Bitcoin Trust call options traded more than 1 million contracts for three straight sessions and reached a record 1.58 million contracts. At the same time, 25-delta call skew turned positive for the first time since October 2025, reflecting a stronger bid for upside exposure.
That tone changed quickly. The article says Larak Island was attacked, and on Sunday Iran retaliated for a U.S. strike on Iranian rocket launch sites near the Strait of Hormuz by launching missiles at a U.S. military outpost in Jordan.
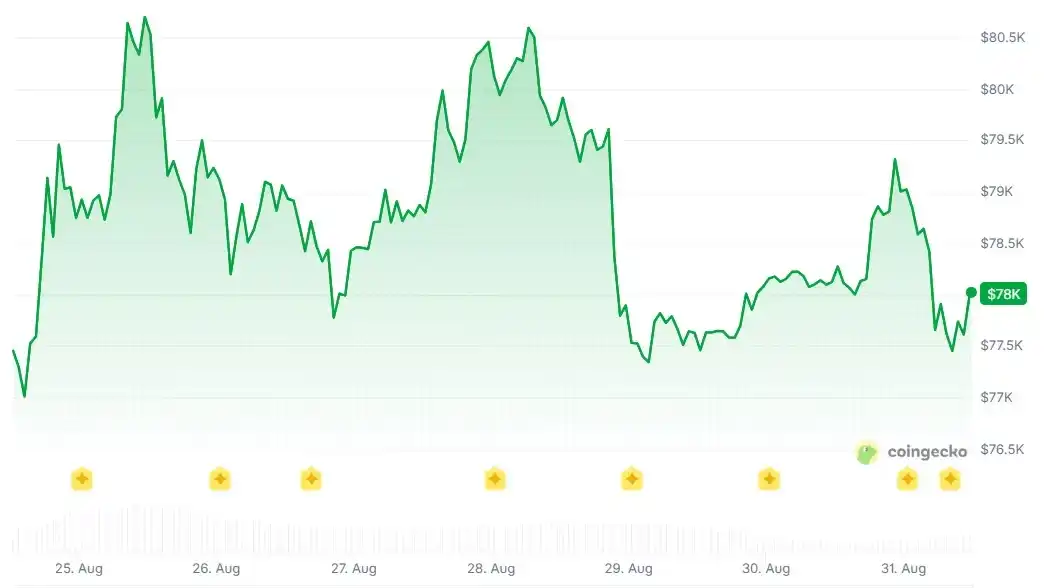
Bitcoin then dropped sharply from its Sunday high and fell below $77,000. The sell-off erased billions of dollars from overall crypto market value, and about $400 million in leveraged long positions were liquidated. In the article’s framing, geopolitics was the trigger on the surface, but not the deeper reason the move unraveled so fast.
Macro conditions were already turning hostile
Before the weekend conflict, the Federal Reserve outlook had already become less supportive. At the Jackson Hole Economic Symposium, Federal Reserve Chair Kevin Warsh signaled that additional rate hikes could not be ruled out if inflation failed to return to the 2% target.
Markets reacted hard. The probability of a September rate hike rose to 56.9%, and the 2-year U.S. Treasury yield climbed 12.8 basis points in a single session to 4.36%.
That kind of macro shift tends to weigh on risk assets on its own. The article argues that the Iranian attack landed on top of an already fragile backdrop. Concern over oil supply through the Strait of Hormuz pushed crude to $90 a barrel, inflation worries picked up again, demand for safe-haven assets increased, rate-hike expectations strengthened, and the U.S. dollar firmed. High-volatility crypto assets were hit first.
Stablecoin growth did not confirm the rally
Internal market structure was flashing warnings as well.
The article describes stablecoin market capitalization as the most reliable gauge of new fiat entering the crypto ecosystem. On that measure, little changed. Only USDC posted a modest increase. ChainCatcher data in the report contrasted that with the 2024-2025 bull market, when USDT market capitalization expanded from $120 billion to $196 billion.
The implication is central to the report’s argument: this rise was not driven by fresh capital coming into crypto, but by existing capital using leverage to rotate and rebuild positions.
Whales were buying while smaller holders were selling
Near the weekend, the Crypto Fear and Greed Index reached 62, placing it in greed territory. The article argues that after Bitcoin rebounded 31% from its low, aggressive long positioning near resistance left the market exposed.
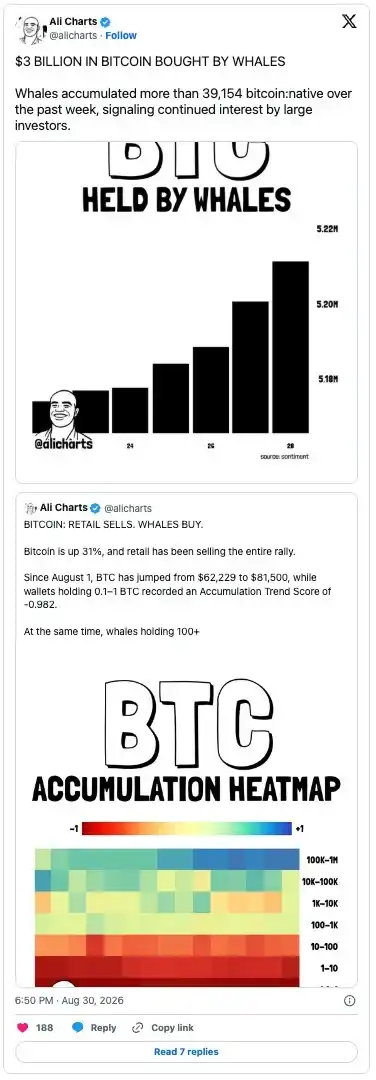
Behavior on the holding side was sharply split. In less than 60 days, large addresses accumulated 46,420 BTC, including about 39,000 BTC in just seven days. Smaller investors holding 0.1 BTC to 1 BTC, by contrast, posted an accumulation trend score of -0.982, close to full-scale selling.
In other words, whales kept accumulating while smaller holders were exiting. The article does not treat that as evidence of broad market strength. Its view is that the move higher reflected a whale-driven strategy aimed at shaking out later entrants and weaker hands.
The next test is ETF flow and the nearby support zone
At the time the original article was published, Bitcoin was trading around $77,600, according to CoinGecko.
TradingView data cited in the piece showed Bitcoin breaking below the $78,000-$82,000 zone, an area previously treated as an important resistance band. Near-term support was placed at $76,000 to $77,000. If that zone fails, the article said price could probe the $70,000-$72,000 area.
SoSoValue data showed demand for put options remained subdued, suggesting options traders had not fully turned defensive. Even so, the article says the real test comes after U.S. market open: whether spot Bitcoin ETFs can attract inflows again.
Spot Bitcoin ETFs had posted large net inflows for nine straight days before recording a $202 million net outflow last Friday. If that shift continues, the article argues, it would suggest institutional buying is not as strong as headline price action implies.
The report also says the current move is being led by leveraged derivatives rather than genuine spot demand. Average daily volume of $109 billion may look strong, but without a matching expansion in stablecoin supply, the increase in turnover does not carry the same weight. On that basis, the article sees the rally as more likely a short pulse than the kind of sustained advance backed by continuous capital inflows between August 2024 and October 2025.
Technical readings still lean bullish, but only slightly
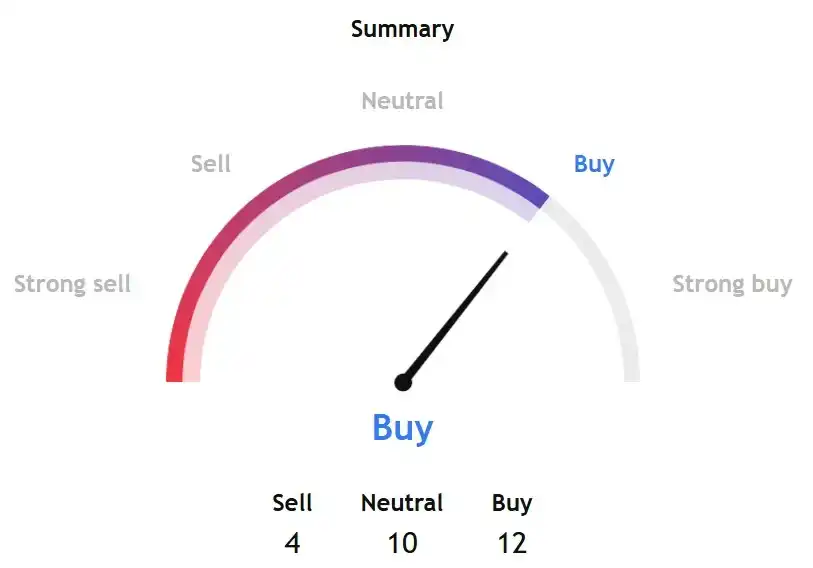
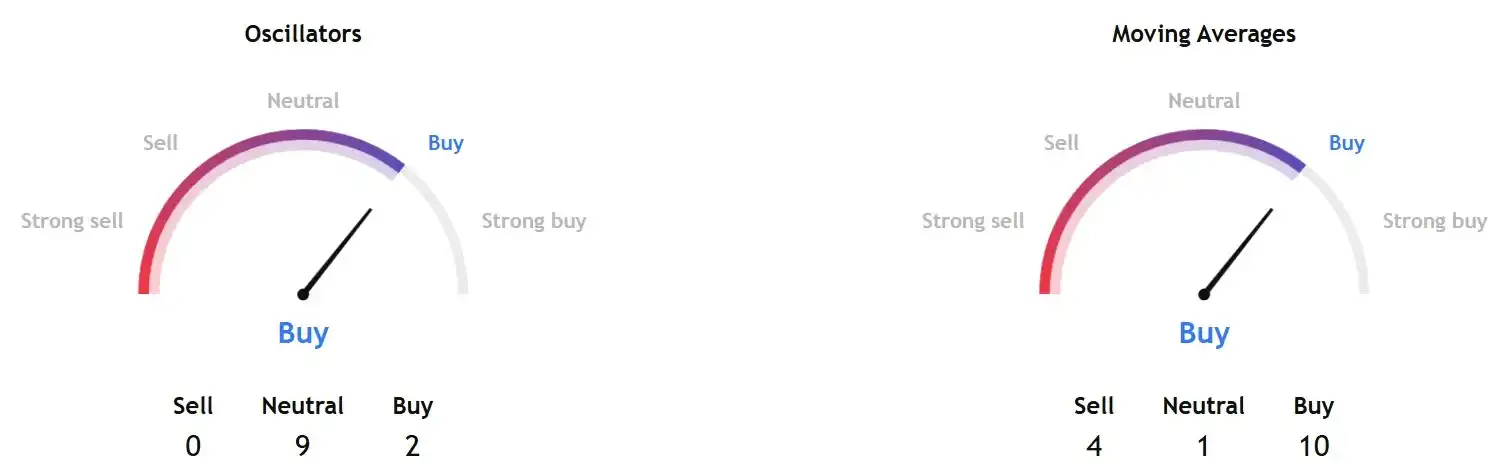
TradingView’s technical read for Bitcoin next week, based on moving averages, oscillators, and pivot points, remained an overall buy signal. Both short-term and long-term indicators also pointed to buy.
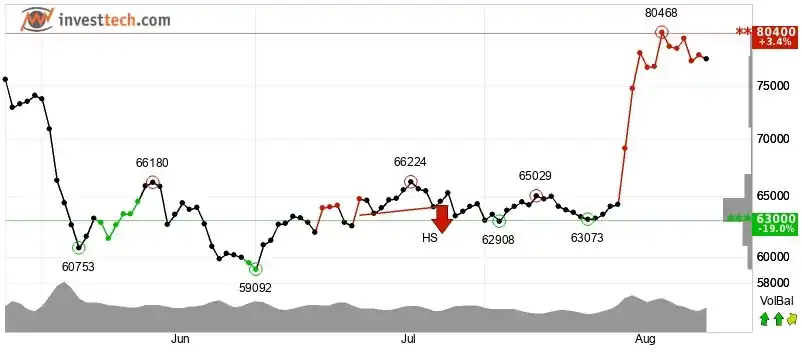
InvestTech gave Bitcoin an overall algorithmic rating of "positive," while its 1-6 week outlook was only "weak positive."
The firm said: "Bitcoin is moving in an approximately horizontal trading channel in the short term, indicating continuation in the current direction. Support is at $63,000 and resistance is at $80,400. Volume balance is positive, with higher turnover on up days and lower volume on down days, which supports the price. After the earlier sharp rise, the RSI has moved above 70."
InvestTech added: "The asset has sufficient upward momentum and may continue to rise. But for large-cap assets, a high RSI indicates overbought conditions and creates pullback risk. Taken together, the short-term technical picture is only slightly positive."
Across the indicators cited in the article, options sentiment and technical readings had not turned fully bearish. The decisive questions remained whether spot capital would return and whether Bitcoin could hold the $76,000-$77,000 support range.