

October has begun, and with it the crypto market’s familiar "Uptober" narrative. The label comes from Bitcoin’s historically strong October performance, while the just-finished September did not really live up to the old "Red September" reputation.
Bitcoin started the month at $83,823.14, up 0.28% on the day. September had nearly become the asset’s best September on record: with one trading day left in the month, BTC was up 7.33%, narrowly above the 7.29% mark set in September 2024. A late correction changed that outcome, and Bitcoin closed September with a 6.33% gain. It still finished in the green and still broke with the "Red September" pattern, but it was no longer a record-setting month.
October seasonality is strong, but not automatic
According to CoinGlass, October has delivered average returns of 19.92% and median returns of 14.71% for crypto investors since 2013. That track record is what keeps the "Uptober" trade alive each year.
Still, last year did not follow the usual script. October 2025 closed down 3.69%, making it only the third red October since 2013. That leaves this year’s setup open to debate, and the broader macro picture is shaping much of that discussion.
Fed policy and Treasury yields are a headwind
On Sept. 16, the Federal Reserve raised interest rates by 25 basis points to a target range of 3.75% to 4%. It was the first hike since July 2023, and the decision was unanimous. Higher rates tend to work against assets such as Bitcoin because tighter money conditions often push capital toward safer instruments, including U.S. Treasuries.
Fed Chair Kevin Warsh said inflation "remains elevated," and the Fed’s median projection points to one more 25-basis-point increase this year. The next rate decision is due on Oct. 28.
Bond markets reflected that shift. The 10-year Treasury yield ended September at 5.289%, while the 30-year yield finished at 5.632%. Both were 52-week highs. Because Bitcoin offers no yield, traders often treat rising Treasury rates as a direct competing alternative.
Equities also struggled after the rate move. The S&P 500 and the Dow both posted monthly losses in September as yields climbed. At the same time, the August PCE inflation print came in cooler than expected: headline PCE was 3.4% year-over-year against a 3.7% forecast, and core PCE was 3.0% versus an expected 3.3%.
ETF inflows lost momentum at month-end
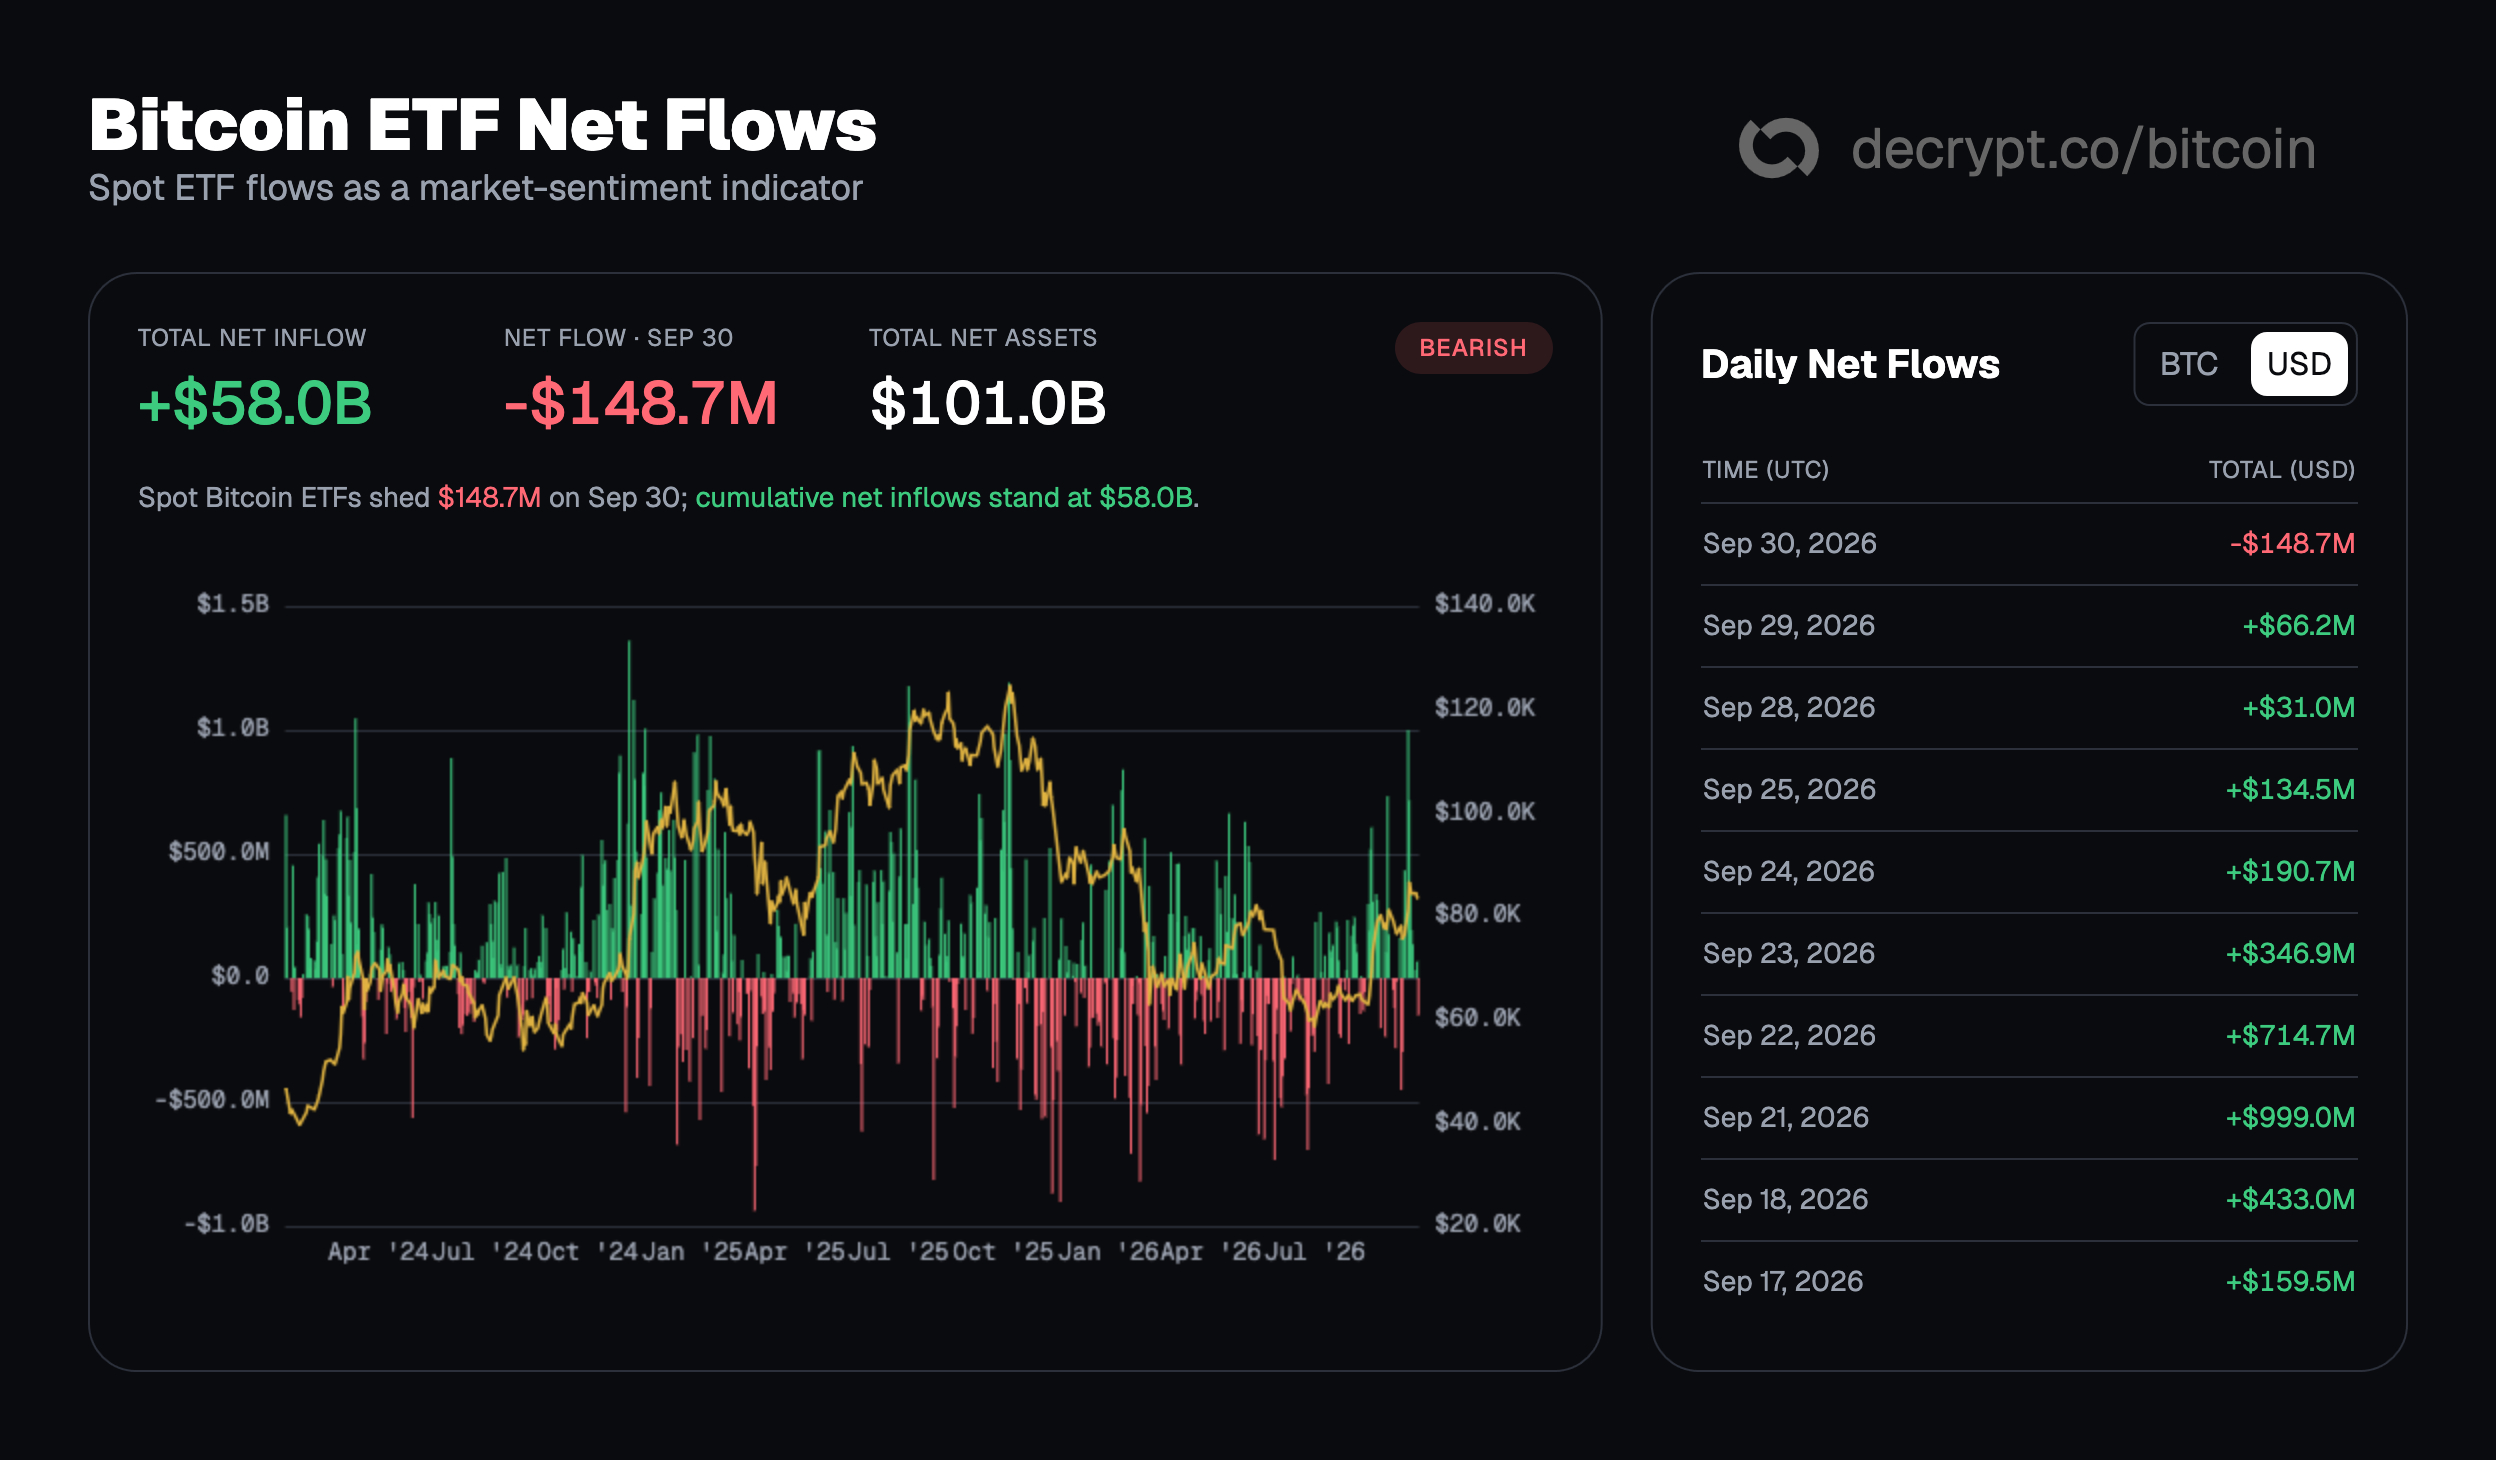
Spot Bitcoin ETFs brought in about $3.08 billion over nine straight days through Sept. 29. That streak ended on Sept. 30, when the products recorded $148.69 million in net outflows, according to Decrypt’s Bitcoin ETF tracker.
Total net assets across the category stand above $101 billion, though Decrypt noted that figures can vary by a few billion dollars depending on the tracking source.
On a weekly basis, the week of Sept. 21 saw roughly $2.4 billion in net inflows, including a single day with $999 million added. This week, by contrast, is showing net outflows of $51.42 million so far.
Prediction markets lean toward $85,000, not a record high
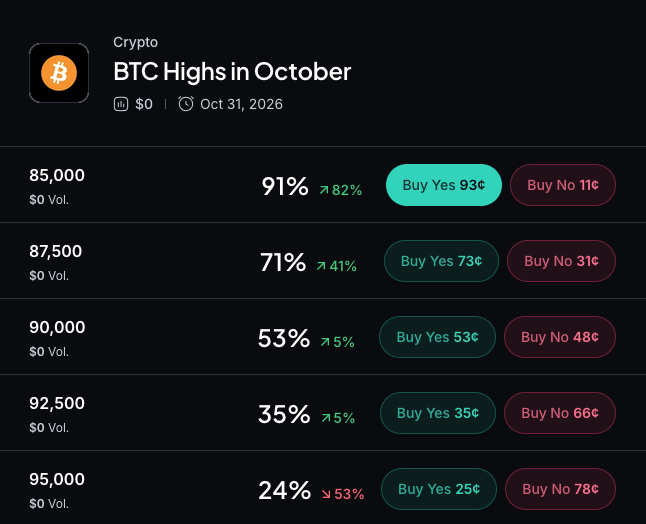
On Myriad, the prediction market operated by Decrypt parent company Dastan, traders are assigning 90% odds to Bitcoin reaching a high of $85,000. That is currently the highest-probability outcome among the listed ranges. Myriad odds also show a 70% chance of Bitcoin hitting $87,500.
In a separate market, traders give only 7% odds that Bitcoin will set a new all-time high before 2027. From current levels, that would require a move of roughly 50%, and the market is pricing that outcome as highly unlikely for now.
Technical picture: trend intact, momentum paused
On the chart, Bitcoin’s daily candle opened at $83,588.27 and traded in a range between $83,134.08 and $84,360.88. The price was sitting at $83,823.14, still within the pullback from the $87,354.33 swing high that followed a bounce from $74,977.57.
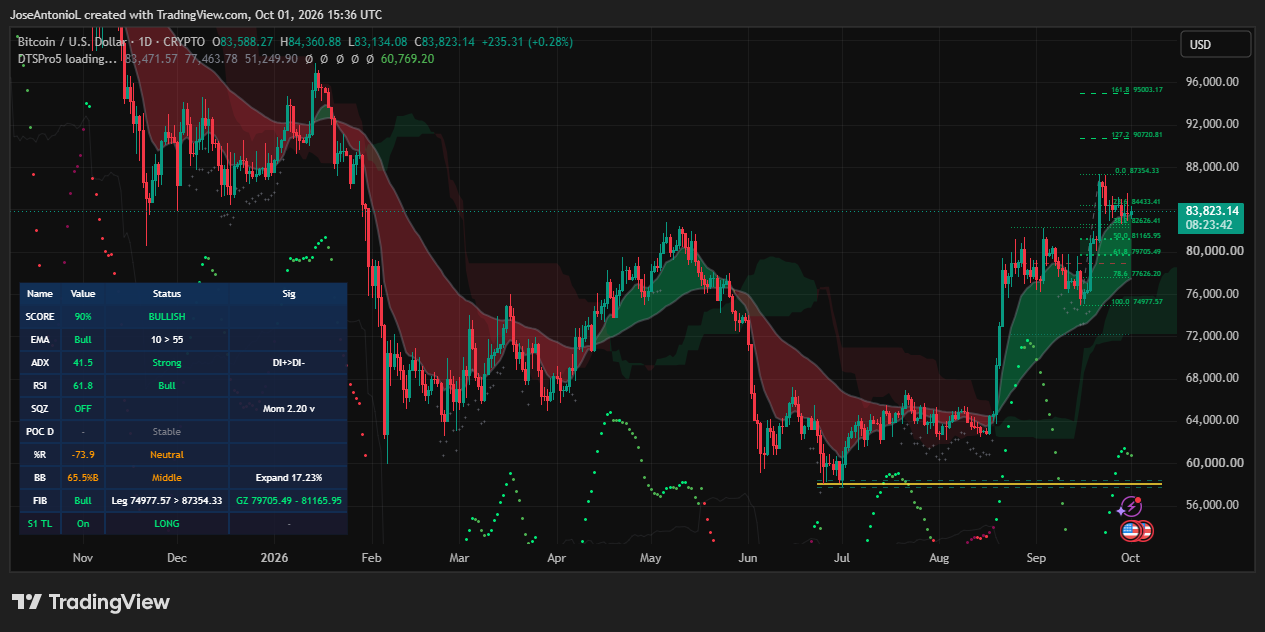
The Average Directional Index, or ADX, is used to measure trend strength regardless of direction. It stands at 41.5, comfortably above the 25 level that confirms a meaningful trend, while the positive directional line remains above the negative one. In practical terms, that points to buyers driving the trend rather than sellers.
Exponential moving averages tell a similar story. The 50-day EMA is above the 200-day EMA, a standard sign that the short-term trend remains upward.
The Relative Strength Index, or RSI, is at 61.8 on a 0-to-100 scale. That suggests bullish momentum is still present without crossing the 70 threshold where profit-taking often starts to build. The Squeeze Momentum Indicator is marked "off," meaning the earlier volatility compression has already been released, while Bollinger Bands are expanding, showing that price is moving farther from its average.
October calendar is crowded
Several macro events could shape trading this month. The September jobs report is due on Oct. 2, FOMC minutes arrive on Oct. 7, CPI is scheduled for Oct. 14, and the Fed’s next rate decision lands on Oct. 28.
Myriad’s October market closes on Oct. 31 at 11:59 p.m. ET.
Decrypt noted that the views expressed in the piece are for informational purposes only and do not constitute financial, investment, or other advice.