

Bitcoin had a macro catalyst to run and still failed to hold higher.

Decrypt reported Friday that U.S. employers cut 23,000 jobs in July, the first net decline since the pandemic-era recovery, sharply below economists’ expectation for a 95,000 increase. Markets took that as a sign the Federal Reserve may keep its hands off rates, and Treasury yields moved lower. Under a typical risk-on setup, that would have supported a bounce in crypto. Instead, Bitcoin’s latest daily candle reached the average price of the past 50 days and then rolled back below it.
The relative performance of the 10 largest crypto assets by market capitalization pointed in the same direction. Bitcoin was one of the steadier large-cap names over the past week, up 1.17% in seven days and trailing only BNB and Solana, yet it still could not close back above its own moving-average resistance. As the report put it, if the strongest macro tailwind in weeks cannot reverse a death cross, the market is sending a message.
Bitcoin remains pinned below a key chart level
Bitcoin was trading at $64,261, down 0.92% on the day, with price sitting just under $64,568. The market structure still carries a death cross, a chart formation widely treated by traders as a bearish signal.
Since the May peak near $80,000, when traders briefly had reason to think Bitcoin might consolidate into a golden cross, the opposite of a death cross, the asset has continued to print lower highs and lower lows. Through June and July, the move developed into a volatile base with a downward slope rather than a clean recovery.
The move from the $66,921 swing high to the $62,216 low shaped the current structure. Price bounced from that $62,216 floor and tried to reclaim the 50-day exponential moving average, or EMA, which marks the lower edge of the red EMA cloud, but the attempt stalled and reversed. The report described that bounce as looking much like a classic bull trap: enough to bring buyers in, not enough to hold. In a market with so little directional commitment, compression can last longer than many traders expect.
The average price of the last 50 days still sits below the 200-day moving average, which is what traders call a death cross. Exponential moving averages smooth price over a defined period. When the shorter-term average remains under the longer-term one, the medium-term path is still pointed lower. Bulls needed at least a daily close back above the EMA50 to begin changing that read, and they did not get it.
Momentum and trend gauges are not signaling a strong reversal
The Relative Strength Index, or RSI, stands at 50, a fully neutral reading. RSI tracks momentum on a 0 to 100 scale, with readings above 70 often considered overbought and below 30 considered oversold. A print at 50 shows neither buyers nor sellers in control, which fits a market that bounced and then quickly gave back the move.
The Squeeze Momentum Indicator is on and has been building for 22 days, while momentum has been ticking higher. A squeeze refers to volatility compressing into a narrow band. These setups often break in the direction of the prior trend, and in this case the prior trend is down. The report also noted that this is not always how it plays out, and that the indicator points to the possibility of a larger move rather than a firm directional call.
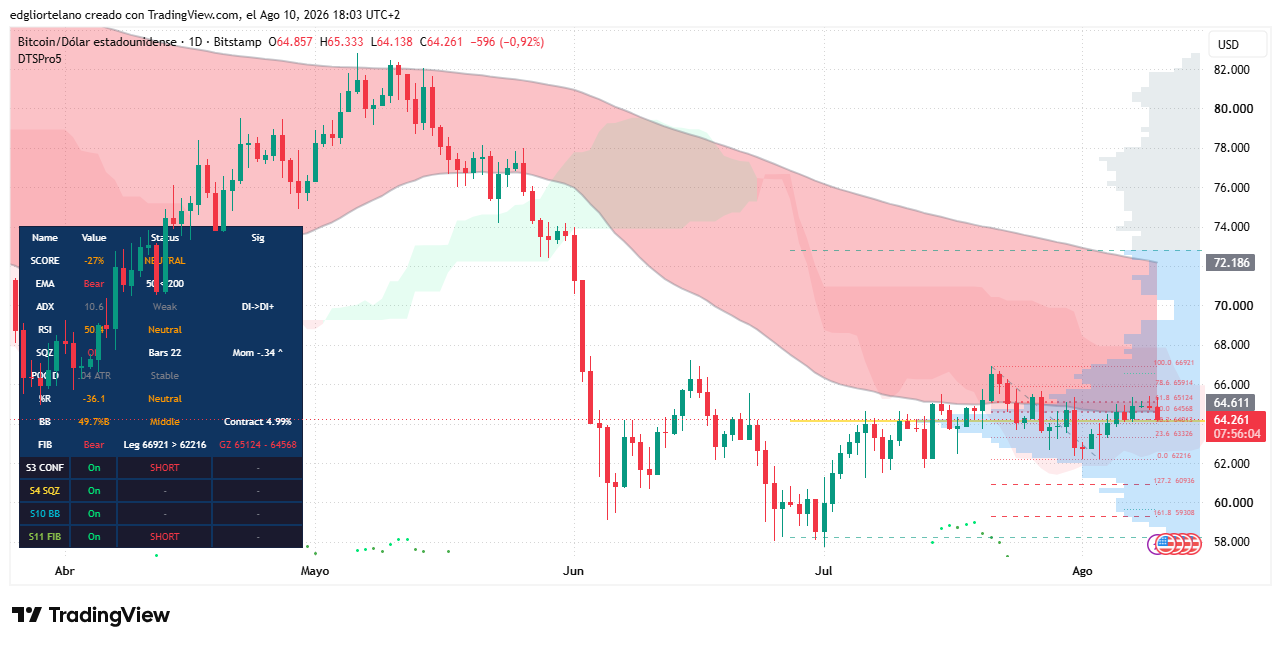
The Average Directional Index, or ADX, is at 10.6. ADX measures trend strength without regard to direction. Readings below 20 usually describe a market with no clear trend, where chop, false breakouts, and stop hunts are more common. At 10.6, trend conviction is weak, though the directional indicators still lean bearish, with DI- above DI+, in line with the failed push back through the EMA50.
Prediction markets suggest a guarded outlook
Prediction markets offered a second read and also leaned cautious. On Myriad, the prediction market built by Decrypt parent company Dastan, the contract on Bitcoin’s next move priced a drop to $55,000 at 64.6% odds, against 35.4% for a run to $84,000.
Monthly resolution markets added more detail. In the event titled BTC Highs in August, the $65,000 level had already resolved Yes after Bitcoin touched it earlier this month. Above that, the $67,500 level carried 48% odds, while higher levels faded quickly: $70,000 at 25%, $72,500 at 11%, and $75,000 at 5%.
That setup suggests traders in the market think most of August’s upside may already be behind Bitcoin. The more revealing book was BTC Lows in August. A dip to $60,000 was priced at 35%, while a deeper breakdown to $55,000 stood at only 8%, and $52,500 at 4%. In other words, the crowd appeared more concerned about a shakeout toward $60,000 than a full slide through $55,000.
Key levels for the bull and bear cases
The report said that view broadly matches the chart. The death cross and the failed reclaim of key EMA resistance argue against a quick return to $80,000. At the same time, support in the golden zone and relatively thin odds on $55,000 suggest the base around $62,000 is still doing meaningful work.
For the bullish case, Bitcoin would need a daily close back above the golden zone at $64,568, followed by a move above the EMA500 that capped the last bounce. That would reopen a path toward the $66,921 swing high. The report framed that as requiring the jobs-driven rate-cut narrative to do more than briefly lift BTC into the cloud.
For the bearish case, losing the $62,216 swing low would confirm the lower-low sequence and expose the round-number $60,000 level, followed by the $58,000 shelf below it. The death cross, negative Squeeze momentum, and failed EMA50 reclaim all point in the same direction. For now, the next leg does not appear to be higher.
Decrypt added that the views and opinions expressed by the author are provided for informational purposes only and do not constitute financial, investment, or other advice.