

This week’s core theme: Bitcoin’s daily chart structure has turned bearish, and the question remains whether the current rebound can effectively breach the upper boundary of the short-term descending channel. Meanwhile, has the seven-leg advance in HYPE reached its culmination? This article dissects the multi-timeframe structures, systematically maps out the current market formation, and outlines medium- and short-term trading strategies for the week ahead.
BTC Multi-Period Structure Analysis
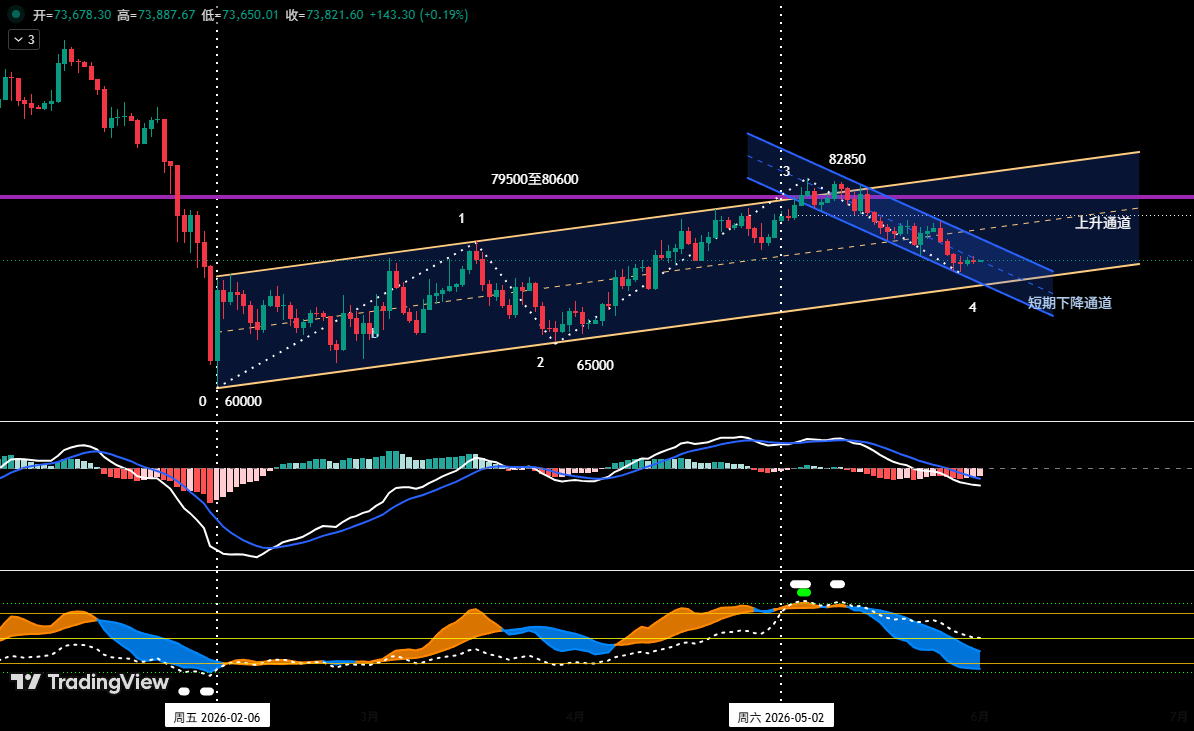
As shown in Chart 1, Bitcoin has been oscillating higher within an ascending channel since its February 6, 2026 low. The lower trendline connects the February 6 and March 29 troughs, while the parallel upper line runs through the March 17 peak. However, the price has already lost the channel’s midline and is now seeking stronger support at the lower boundary. Simultaneously, after touching a high of $82,850 on May 6, BTC entered a short-term descending channel, defined by connecting the May 14 and May 26 swing highs for resistance and the May 7 and May 23 swing lows for support. Currently, the price found momentary footing near $72,500 and is now staging a feeble bounce toward the descending channel’s upper rail. Overall, Bitcoin is caught between conflicting multi-period channels. The rebound is primarily an oversold repair rally, targeting the top of the short-term descending channel. However, with the break below the ascending channel’s midline, the broader technical structure has deteriorated. After this bounce exhausts, the most likely scenario is a resumption of the prior downtrend, with a retest of the ascending channel’s lower boundary support.
BTC 4-Hour Chart & Tactical Plans
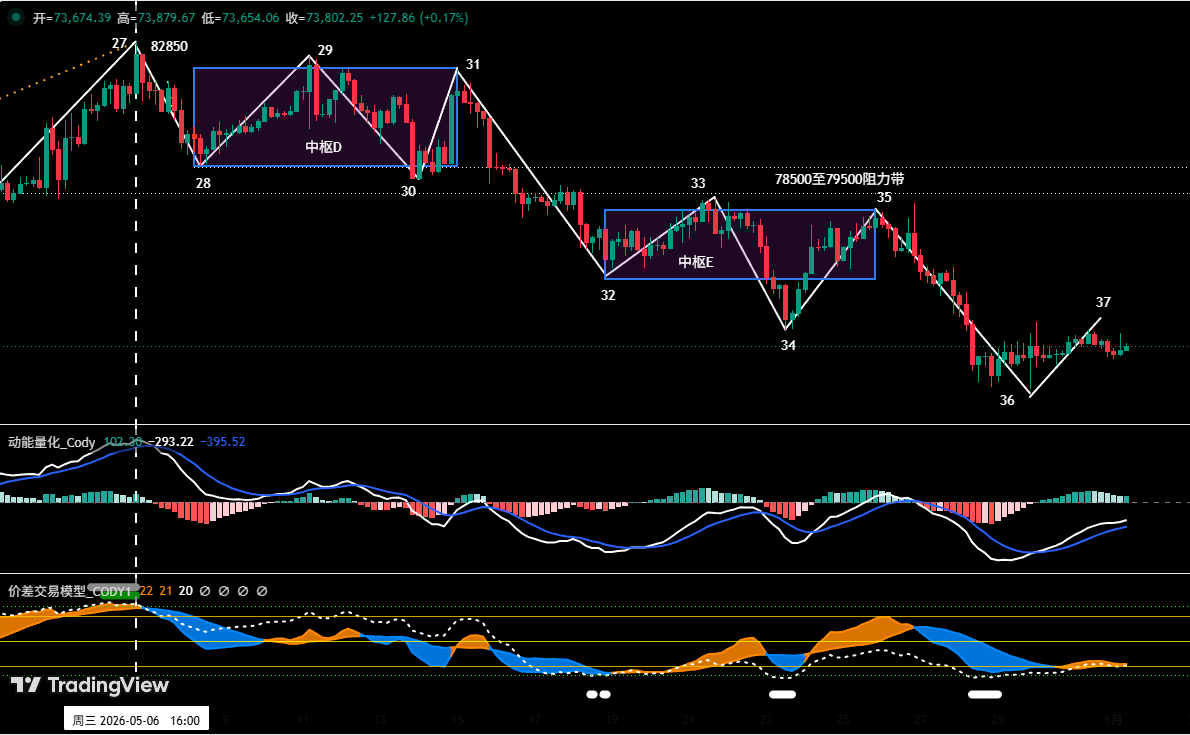
The 4-hour chart (Chart 2) reveals that since the $82,850 peak, the correction has unfolded as a ten-segment structure (waves 27-28 to 36-37) with two descending central zones. Central zone D is formed by the overlapping swings 28-29, 29-30, and 30-31; central zone E comprises swings 32-33, 33-34, and 34-35. The market is now navigating segment 36-37. Should this bounce stall in the $75,000–$76,000 area and fail to break higher, the path of least resistance remains downward, targeting the $69,500–$70,500 support band. Key resistance levels: first resistance at $75,000–$76,000 (near the lower edge of central zone E), second resistance at $78,500–$79,500 (the boundaries of the two central zones). Critical supports: $69,500–$70,500 and the $65,000 vicinity.
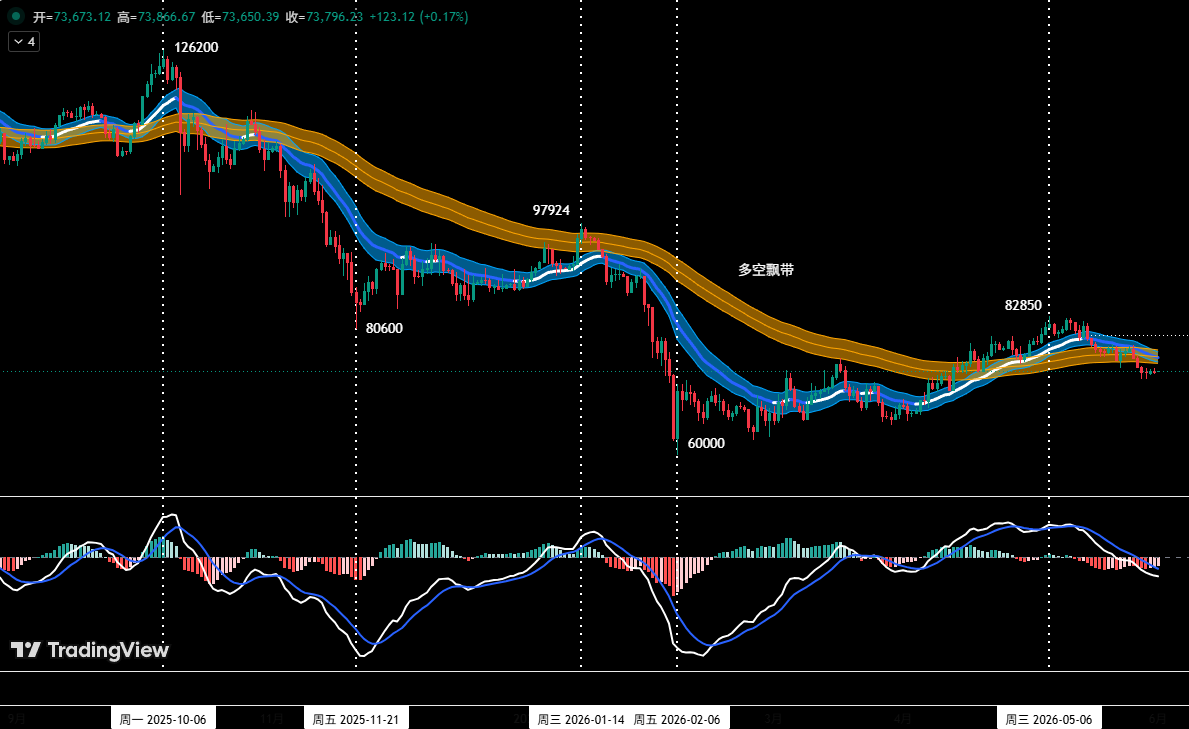
For short-term trades, we employ 30% of capital, using 30/60-minute timeframes to scalp around support and resistance levels. To adapt to evolving market conditions, we have scripted two contingent plans (A/B). Plan A: If the price rebounds into $75,000–$76,000 and meets resistance coupled with a top signal from the quantitative model, open a short position with no more than 30% allocation. Place the initial stop-loss above $77,000; close the position near significant support when model signals appear. Plan B: If the price decisively breaks below $69,500–$70,500 support and the model triggers a top signal, establish a short (again ≤30%). Set the stop above $72,000, and exit near the next major support with confirmation from the model.
HYPE 4-Hour Structure & Trading Outlook
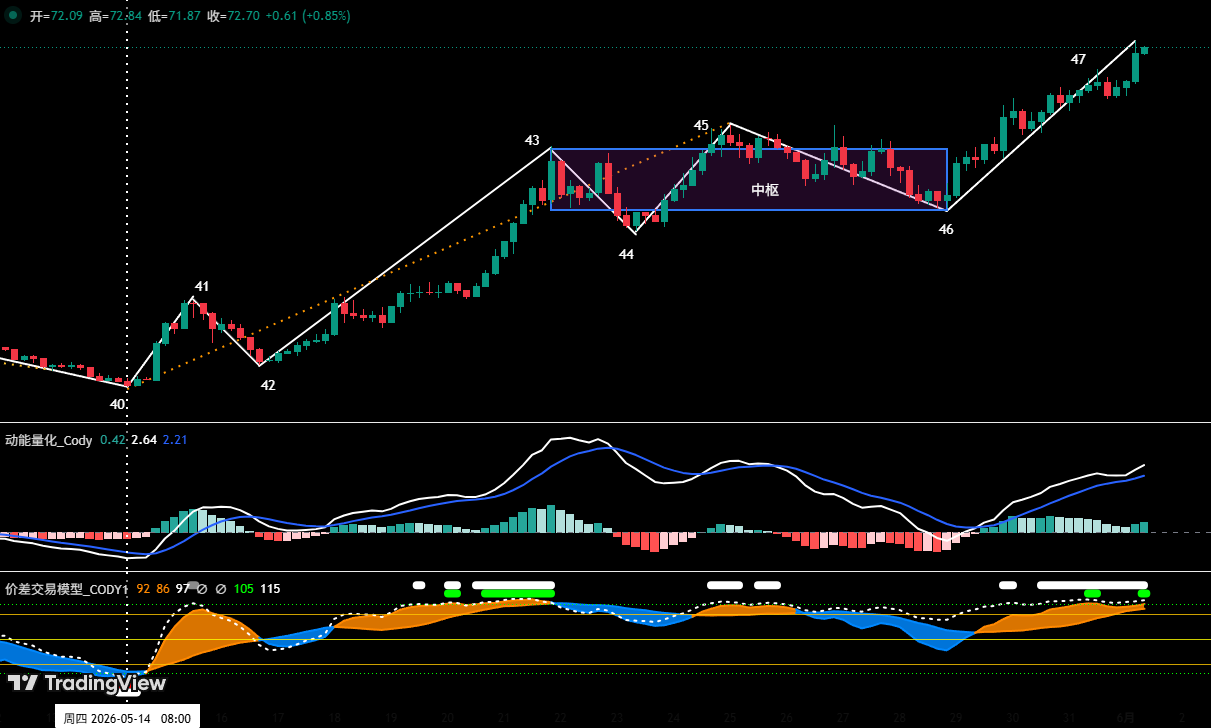
As illustrated in Chart 4, HYPE has built a clear seven-wave pattern (40-41 through 46-47) since the May 14 low of $38.14. Waves 43-44, 44-45, and 45-46 overlap to form an ascending central zone. Earlier weekly reviews flagged that “Endpoint 45” exhibited momentum divergence alongside a top-alert signal from our proprietary spread trading model – a confluence that pointed to a high-probability short-term peak. The market validated this view: price tumbled from $64.75 (Endpoint 45) to $56.30 (Endpoint 46), a 13.05% drawdown. Now, comparing the exit section (46-47) with the entry section (42-43), upside momentum appears exhausted, raising the odds of a bearish momentum divergence. Our in-house model has fired a strong top-warning signal (red + white dots) at “Endpoint 47.”
The key for this week: observe whether the momentum divergence materializes alongside the top signal at Endpoint 47. If so, and if the price subsequently breaks below the $62.5–$64.57 support zone, it would confirm Endpoint 47 as the terminus of the rally from the May 14 low. Short-term strategy revolves around “buying on dips, avoiding chasing highs.” The focal point is how price reacts upon testing the $62.5–$64.75 region. Should it halt, stabilize, and flash a bottom signal from both models, consider a light long position with total exposure capped at 30%, while strictly adhering to stop-loss discipline. Conversely, a convincing breakdown below this zone would escalate the pullback into a larger-degree (potentially daily) correction, extending both duration and depth, with the initial downside target at the $54–$56.3 area.
Last Week’s BTC Short Trade Recap
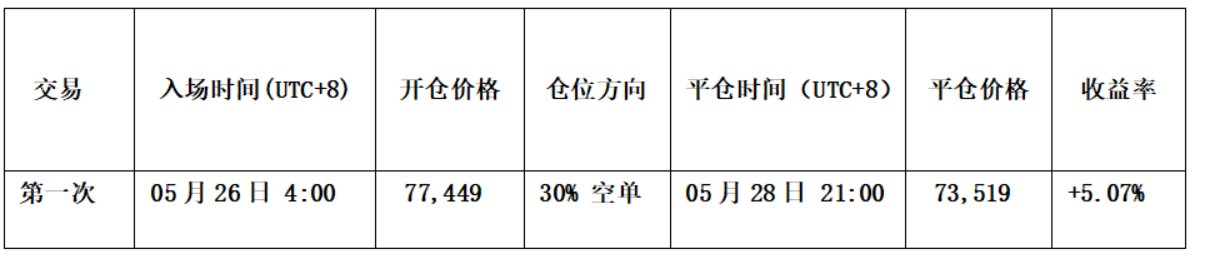
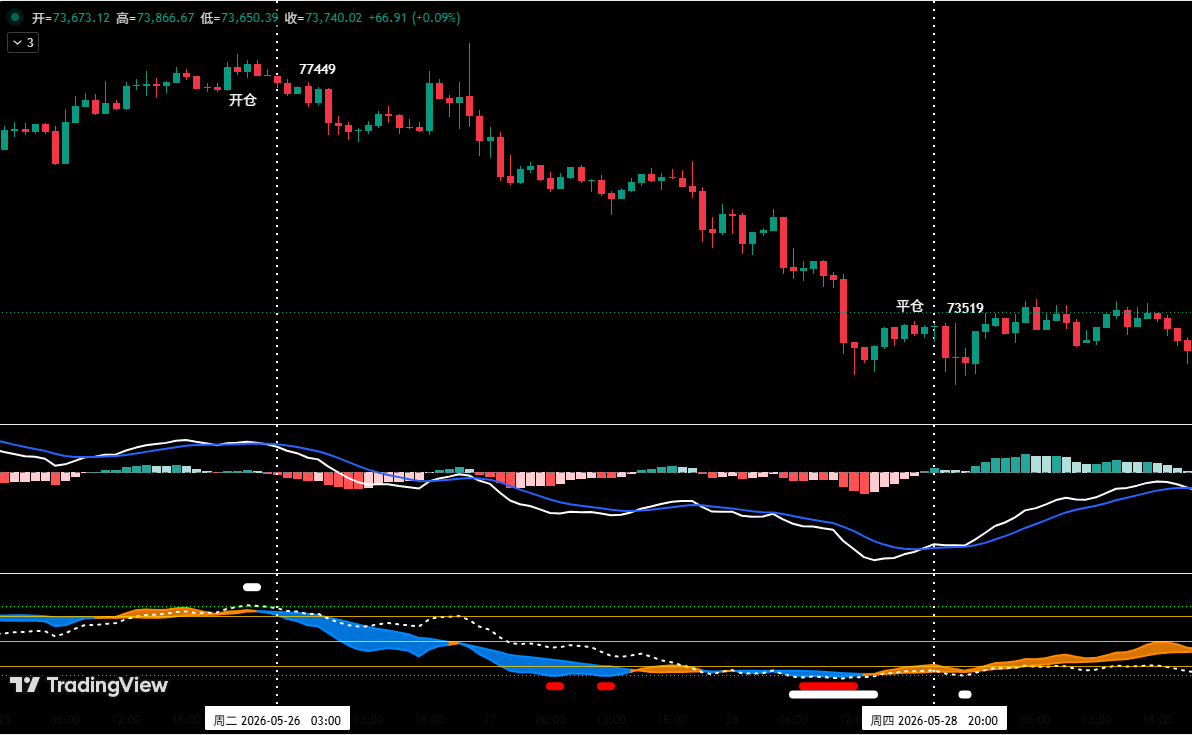
Acting strictly on model-generated signals, we executed one short-term short position last week, netting a gain of approximately 5.07% (see Table 1). Entry: the price approached the $78,000 area and exhibited rejection with a bearish “top fractal” candlestick pattern; the spread trading model triggered a white-dot top alert, while the momentum model flashed a bearish divergence signal. Consequently, we established a 30% short position at $77,449. Exit: around $73,000, the pair showed signs of exhaustion with a bullish “bottom fractal” pattern; the spread model fired a strong bottom warning (red + white dots) that resonated with a bottom signal from the momentum model. We closed the entire position near $73,519. Summary: the trade succeeded in locking in a ~5.07% profit.

Risk Management & Final Reminders
Set an initial stop-loss immediately upon opening a position. After gaining 1%, move the stop to the entry price to secure principal. At 2% profit, adjust the stop to lock in 1% gains. Thereafter, for every additional 1% of profit, trail the stop accordingly to dynamically protect accumulated gains. Financial markets are fluid; all analysis and trading plans require constant adaptation. The views, analytical models, and strategies presented herein derive solely from personal technical analysis and serve as a personal trading journal. They do not constitute investment advice or a basis for decision-making. Market risk exists; exercise caution and do not act on this information alone.