

Core focus this week: Bitcoin's daily structure has weakened. Can the short-term rebound effectively break above the descending channel's upper trendline? Has HYPE's seven-wave rally reached its terminus? In the following sections, we systematically review current market structures from multiple timeframes and devise mid-term and short-term trading strategies for the week ahead.
1. BTC Multi-Timeframe Structure Analysis
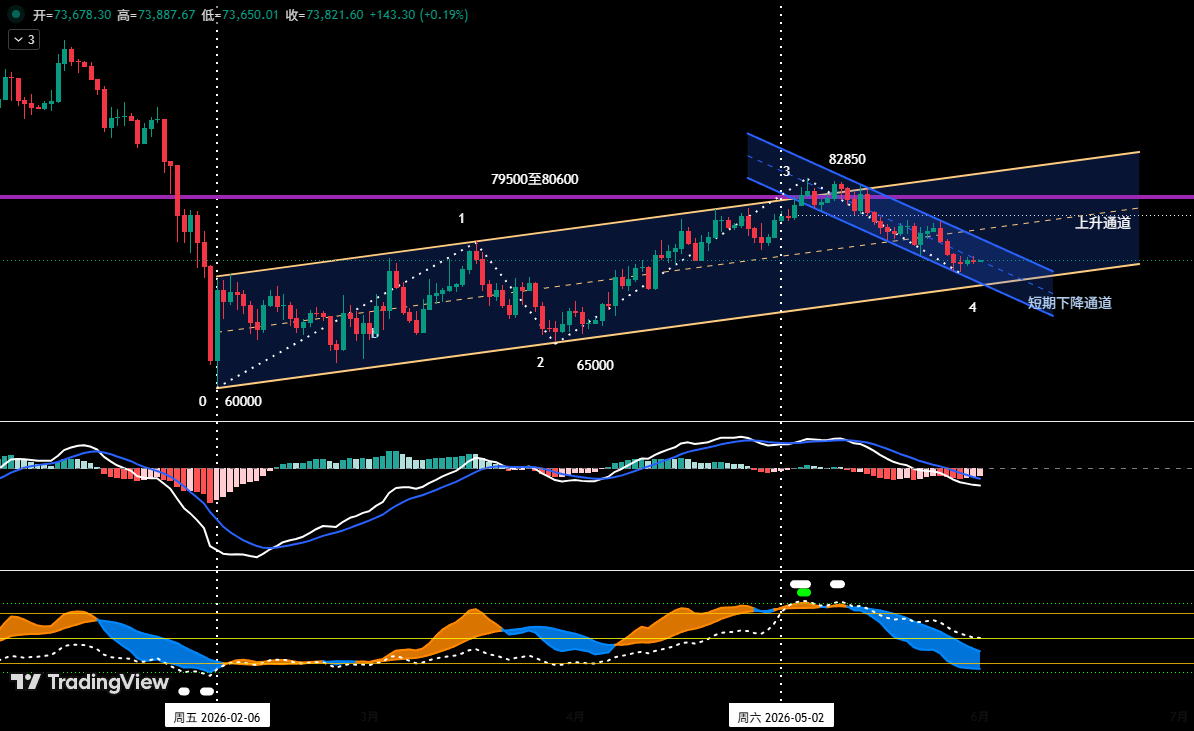
(Fig. 1) The ascending channel (yellow): Since the February 6, 2026 low, Bitcoin has oscillated upward inside an ascending channel. Its lower rail connects the February 6 and March 29 lows, while the upper rail runs parallel through the March 17 high. The short-term descending channel (blue): After peaking at $82,850 on May 6, Bitcoin has traded inside a descending channel. The upper rail links the May 14 and May 26 rebound highs; the lower rail connects the May 7 and May 23 correction lows. Based on the ascending channel, the price has lost the midline and is now seeking stronger support at the lower rail. From the descending channel perspective, the price briefly stabilized after testing the lower rail around $72,500 and is currently in a weak rebound cycle toward the channel's upper boundary.
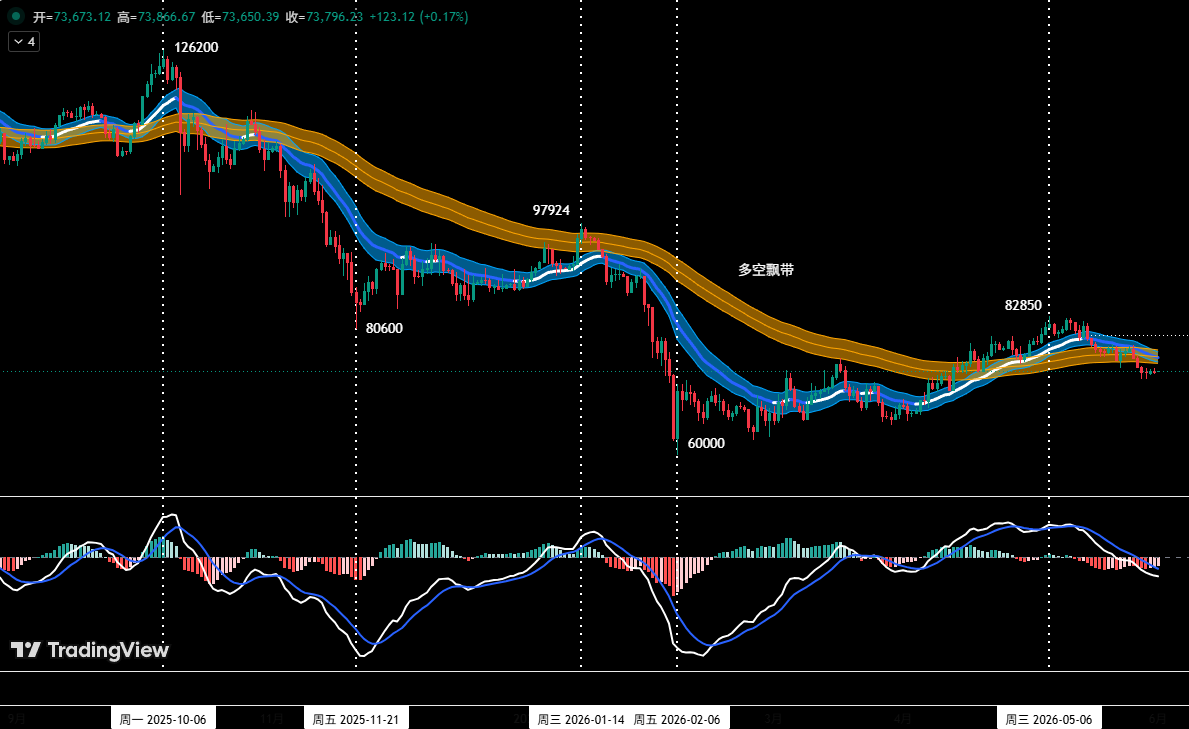
Overall assessment: The current rebound is primarily a repair of short-term oversold conditions, targeting the upper boundary of the short-term descending channel. However, since the price has already broken below the ascending channel's midline, the overall technical structure has turned weak. Once the rebound concludes, the price is likely to resume its prior downtrend and further test the support of the ascending channel's lower rail.
2. BTC 4-Hour Structure and Weekly Strategy
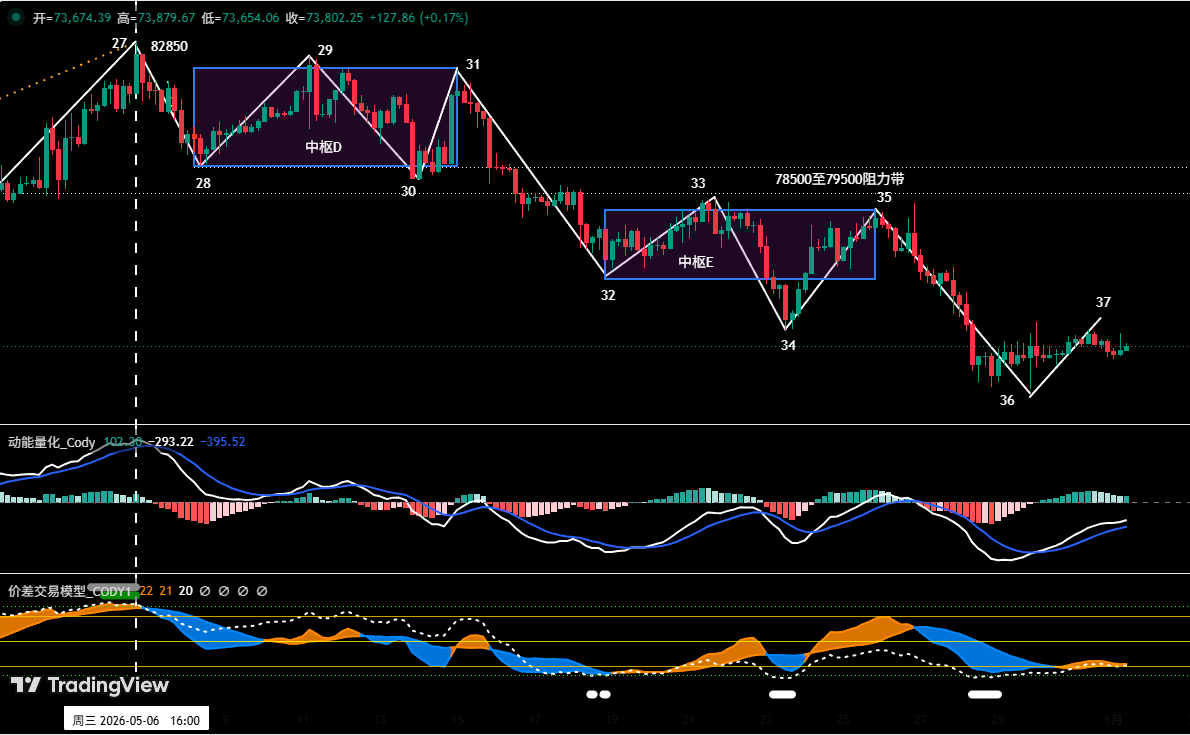
(Fig. 2) The 4-hour chart shows that since the $82,850 high on May 6, the correction can be subdivided into a 10-segment structure (27-28 through 36-37), containing two descending centers: Center D formed by overlapping segments 28-29, 29-30, and 30-31; Center E formed by overlapping 32-33, 33-34, and 34-35. The market is currently in the 36-37 rebound leg. If this leg encounters resistance and reverses between $75,000 and $76,000, the broader oscillating downtrend will likely continue, pushing toward the $69,500–$70,500 support zone. Key resistance levels: first resistance at $75,000–$76,000 (near the lower edge of Center E); second resistance at $78,500–$79,500 (around the upper and lower edges of both centers). Key support levels: first support at $69,500–$70,500; second support near $65,000.
3. BTC Short-Term Trading Plans
Short-term strategy: Use 30% of the position, trading the spreads based on support and resistance levels on the 30/60-minute timeframe. Two contingency plans (A and B) have been prepared. Plan A: If the price rebounds to the $75,000–$76,000 zone and stalls, accompanied by a top signal from the quantitative model, a short position of no more than 30% can be initiated with an initial stop-loss above $77,000; close the position near key support levels when model signals confirm. Plan B: If the price effectively breaks below the $69,500–$70,500 support area with a corresponding top signal, initiate a short position of no more than 30% with a stop-loss above $72,000; exit near supports upon model confirmation.
4. Review of Last Week's BTC Short Trade
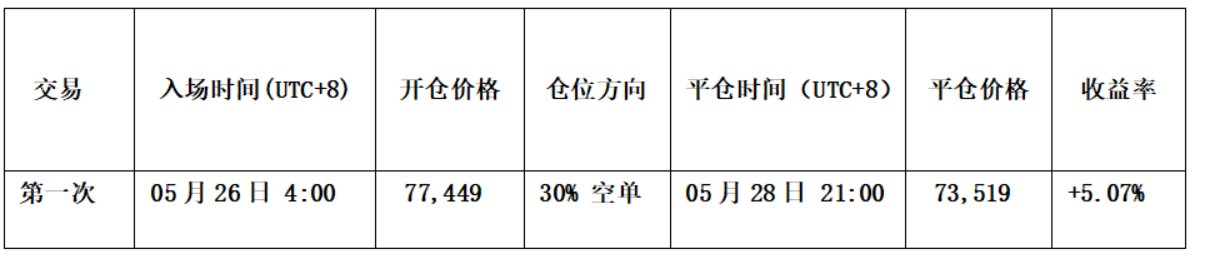
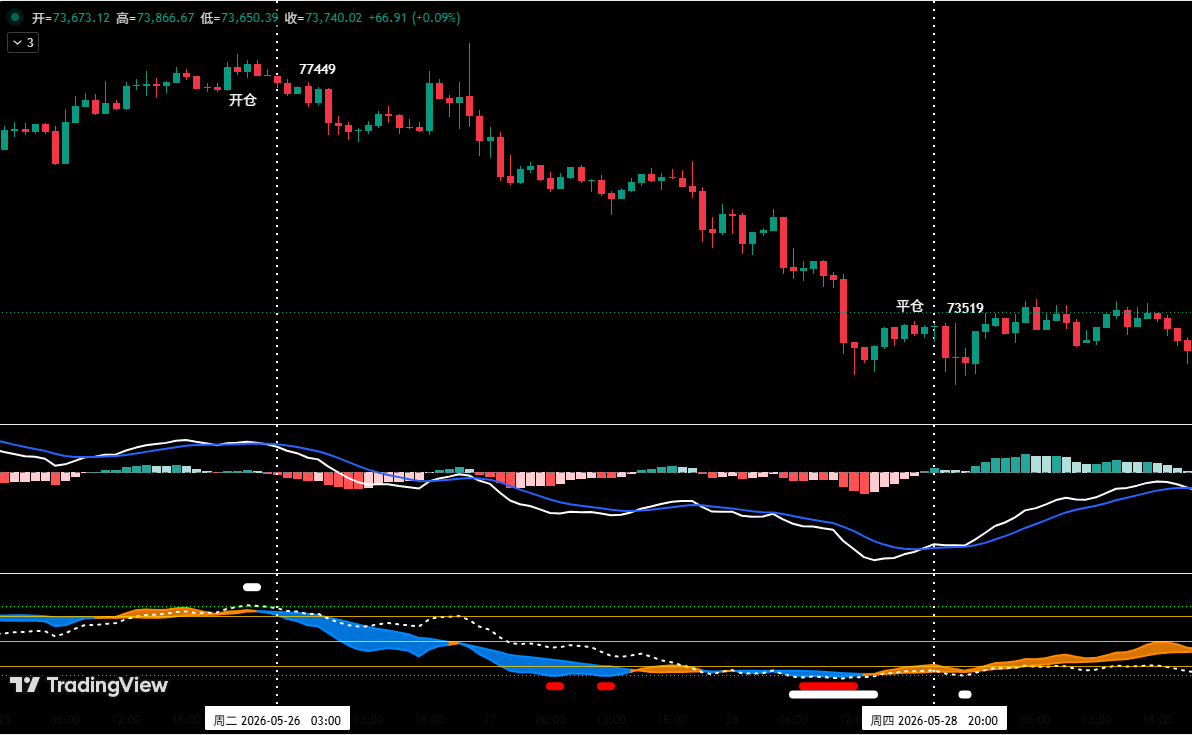
(Fig. 5) Following our models rigorously, we executed one short-term short trade last week. When the price approached the $78,000 resistance area with a bearish top formation (K-line top fractal), the spread trading model triggered a top warning, while the momentum quantification model indicated a bearish divergence. We opened a 30% short position at $77,449. As the price dropped to around $73,000 and stabilized with a bullish bottom fractal, both models issued a strong bottom resonance signal, prompting us to close the entire position near $73,519 for a profit of approximately 5.07%, validating the prior “sell on rallies” view.
5. HYPE Structure Analysis and Strategy
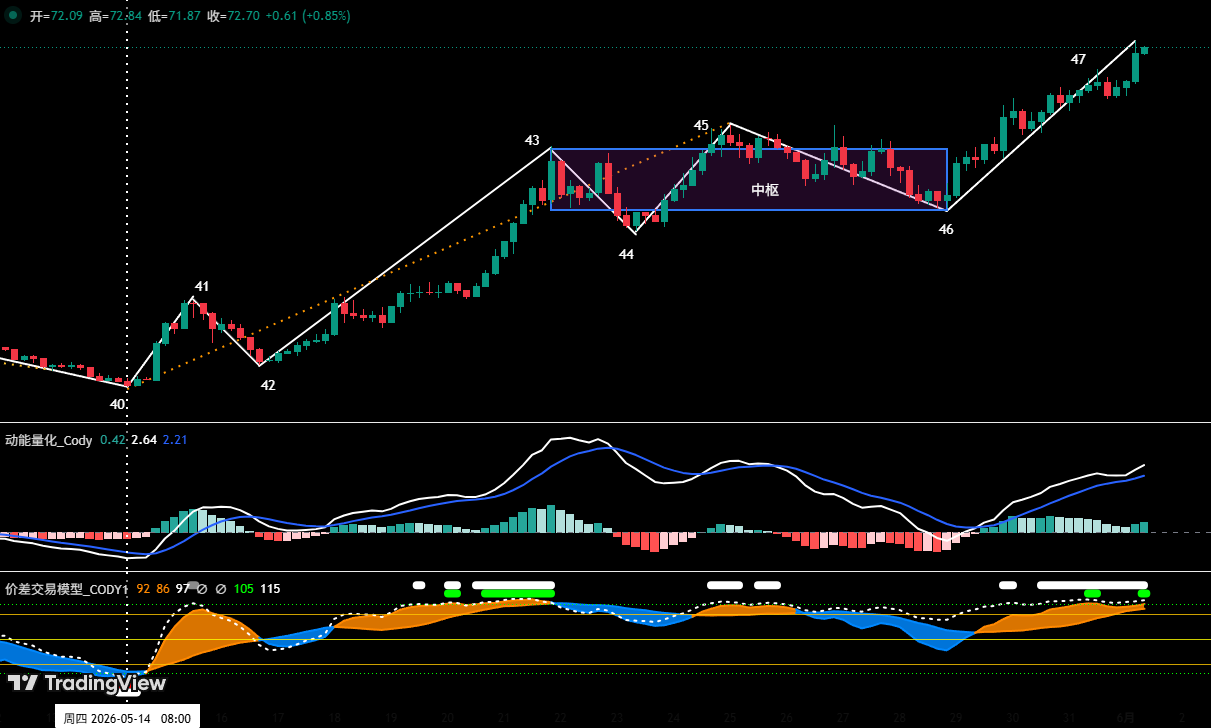
(Fig. 4) On the 4-hour timeframe, HYPE has constructed a seven-wave structure (40-41 to 46-47) since the May 14 low of $38.14, containing an ascending center formed by the overlaps of 43-44, 44-45, and 45-46. At end-point 45, a bearish momentum divergence and a top model warning already appeared, leading to a maximum correction of 13.05% to $56.30. Now, the center's exit leg (46-47) shows weakening momentum compared to the entry leg (42-43), suggesting a potential “momentum divergence.” End-point 47 has triggered a strong top warning signal (red + white dots). Core assessment: If end-point 47 confirms a top and the momentum divergence holds, a subsequent effective breakdown below the $62.5–$64.57 support zone would signify the end of the rally from the May 14 low. Short-term strategy: Favor dip-buying and avoid chasing rallies. Monitor the pullback test of the $62.5–$64.75 area: if the price stabilizes and shows bottom signals, consider a light long position (no more than 30%) with strict stop-loss discipline. However, if that zone is decisively broken, the correction will escalate to a larger degree (e.g., daily), with the next downside target at the $54–$56.3 region.

6. Risk Control Discipline
Immediately set an initial stop-loss upon opening a position. Once at 1% profit, move the stop to the entry price (breakeven). At 2% profit, move the stop to lock in 1% gain. For every additional 1% profit thereafter, trail the stop accordingly to dynamically protect and lock in profits. All analyses are derived solely from personal technical analysis and serve as a trading journal. They do not constitute any investment advice. Markets are risky; invest with caution.