

This week’s two focal points: after Bitcoin’s daily structure turned softer, can the short‑term rebound effectively break above the upper boundary of the descending channel? And has the seven‑wave advance in HYPE since the May 14 low run its course? The following analysis examines multi‑timeframe structures, maps out the current market posture, and presents actionable short‑ and medium‑term strategies.
Key takeaways: multi‑timeframe BTC structure analysis; this week’s BTC outlook and tactical plans; HYPE hourly structure assessment; HYPE strategy for the week; last week’s 1x short trade delivered a ~5.07% gain, validating the “sell on strength” bias.
BTC: Descending channel pressure and a fragile bounce
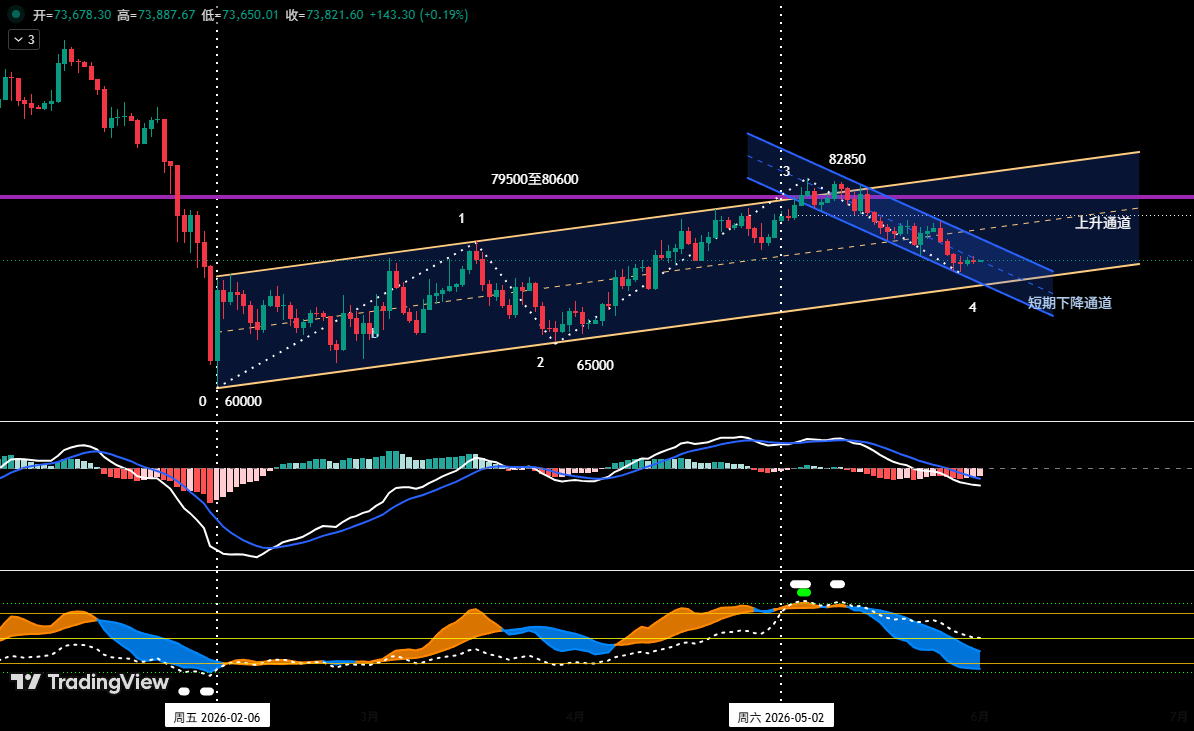
On the daily chart, Bitcoin has slipped below the mid‑line of the yellow ascending channel that began from the February 6 low and is now sliding towards the lower rail. Since the May 6 peak of $82,850, a shorter blue descending channel has taken hold; its lower boundary near $72,500 offered temporary support, triggering a feeble rebound that is now targeting the blue channel’s upper line.
Overall assessment: the bounce is only an oversold repair. With the yellow channel’s mid‑line lost, the broader structure is weak. Once the rebound fades, the price will likely revert to the existing downtrend and test the yellow channel’s lower rail.
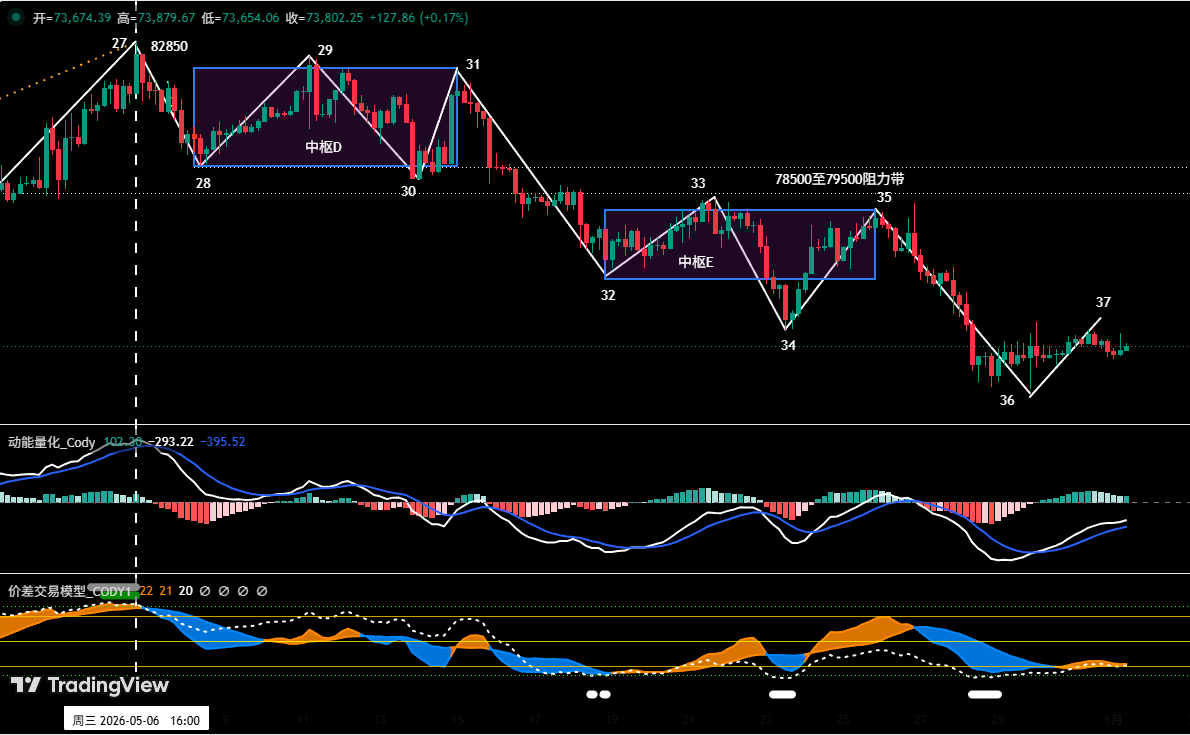
Zooming into the 4‑hour timeframe, the decline from $82,850 can be broken into a 10‑leg structure (“27‑28” to “36‑37”), containing two descending pivots, D and E. The market is currently in the 36‑37 rebound. If it stalls at the $75,000–$76,000 zone and cannot punch through, the downtrend will resume, bringing the $69,500–$70,500 support into play.
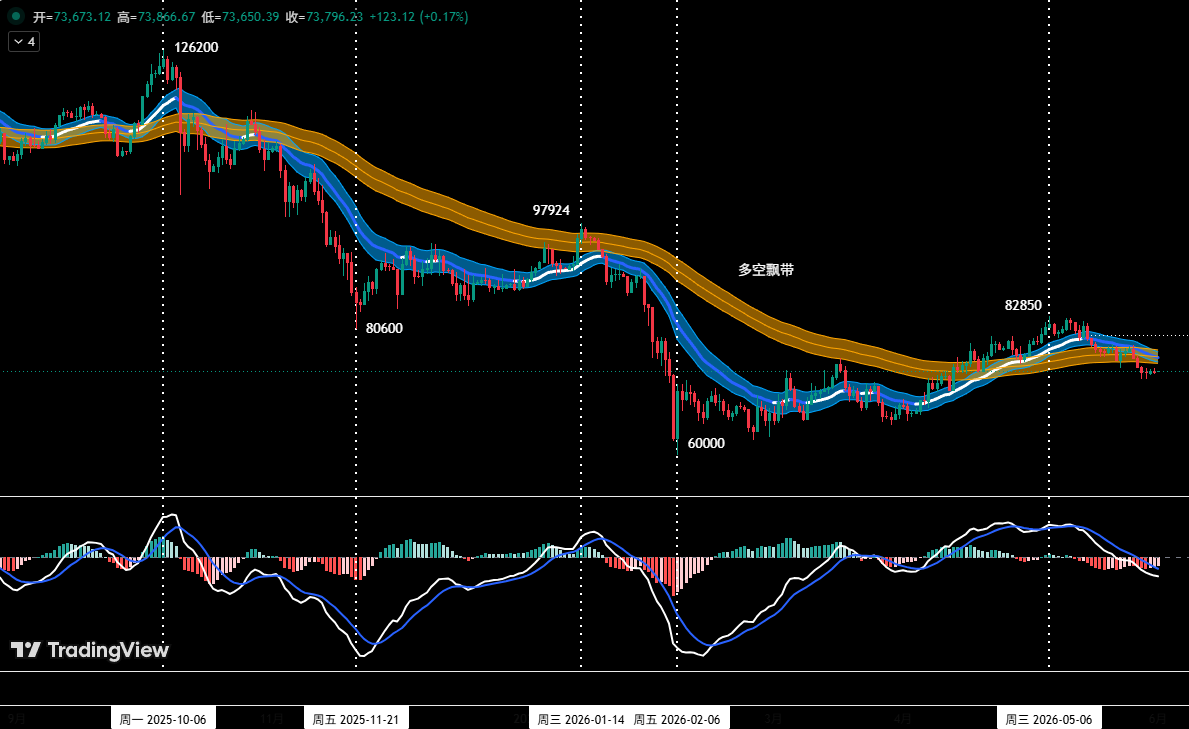
Key resistance: first zone $75,000–$76,000 (near pivot E lower boundary); second zone $78,500–$79,500 (around both pivots). Key support: $69,500–$70,500, then near $65,000.
BTC short‑term playbook: two plans for a fluid market
The near‑term bias remains “short the rips.” Use 30% of capital on a 30/60‑minute time frame, with hard stops.
Plan A: if price rallies into $75,000–$76,000, meets resistance, and the quantitative model prints a top signal, open a short ≤30% with an initial stop above $77,000. Gradually cover as the price approaches key supports and the model flashes exit signals.
Plan B: should the price decisively break below $69,500–$70,500, confirmed by a model top signal, initiate a similar short, stop above $72,000, and take profits near the next support tier.
HYPE: momentum exhaustion at the seven‑wave top
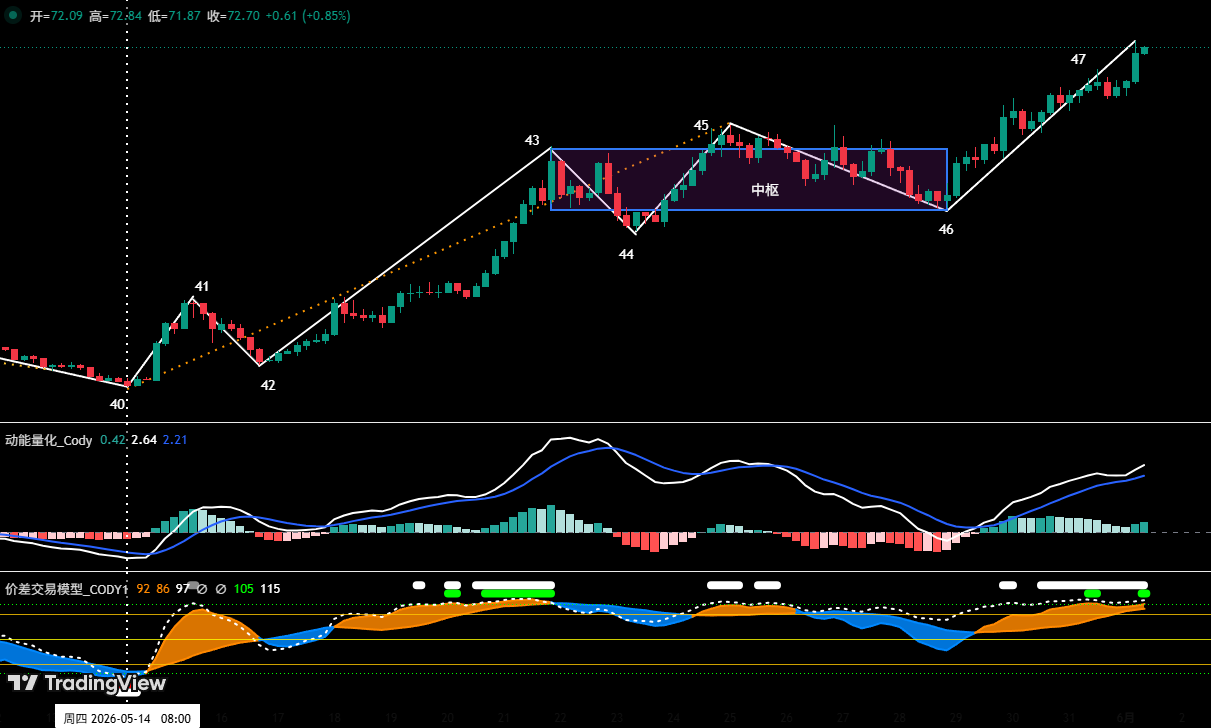
Since the May 14 low of $38.14, HYPE has traced a textbook seven‑leg structure (40‑41 to 46‑47) on the 4‑hour chart, with a central pivot formed by the overlapping 43‑46 waves. Last week’s review flagged the momentum divergence at endpoint 45, amplified by the spread‑trading model’s top alert; price subsequently dropped from $64.75 to $56.30, a decline of 13.05%.

Now, comparing the exit wave 46‑47 with the entry wave 42‑43, the upward momentum is visibly waning, making a momentum divergence likely. Additionally, the in‑house spread‑trading model is sounding a strong top alert at endpoint 47 (red dot + white dot). If the divergence is confirmed and the price subsequently breaks below the $62.5–$64.57 support band, endpoint 47 will mark the end of the rally that started on May 14.
This week’s approach is “buy on dips, avoid chasing.” If the price retraces to $62.5–$64.75 and shows signs of stabilization, accompanied by bottom signals from both models, a light long (under 30% position) can be attempted with strict stop‑loss discipline. A clean break below that zone would escalate the correction to a daily‑degree pullback, with downside targets first at $54–$56.3.
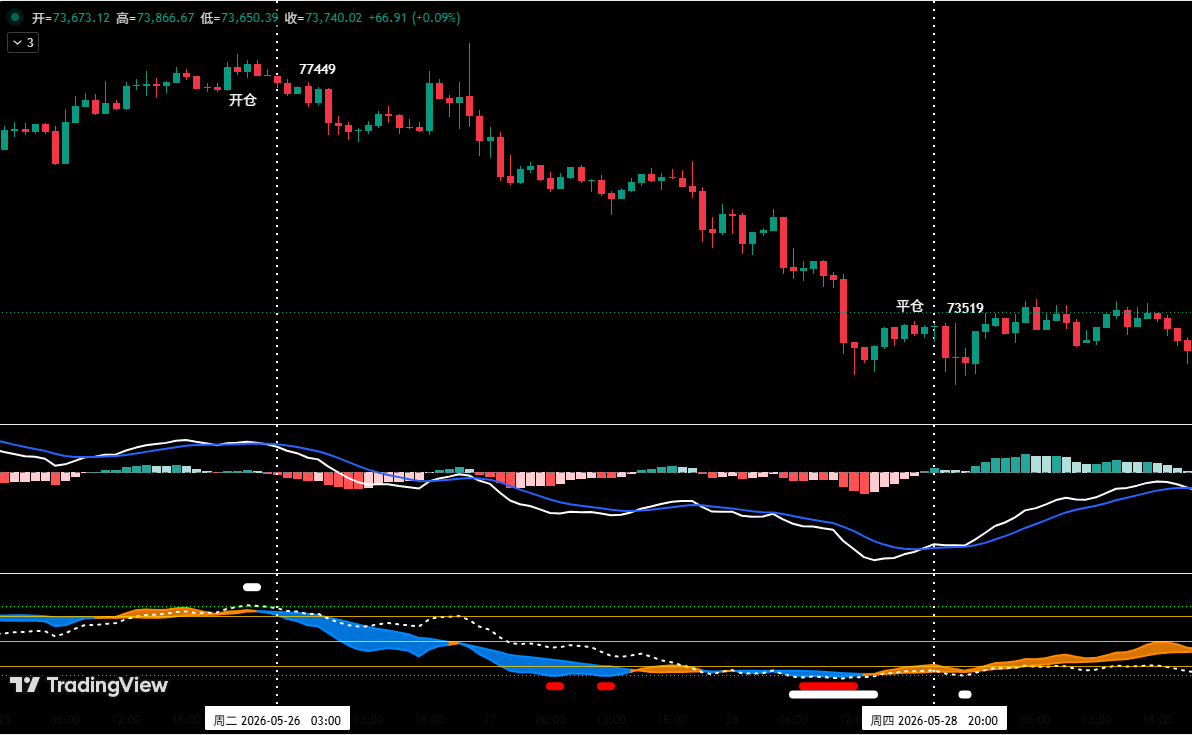
Last week’s trade recap: a 5.07% short and risk‑control rules
Following the playbook, a single short trade on Bitcoin was executed last week based on signals from the spread‑trading and momentum quantification models. Entry rationale: price stalled near $78,000, forming a bearish top fractal on K‑lines; the spread model issued a top warning (white dot); the momentum model showed a bearish divergence. A 30% short was opened at $77,449.
Closing logic: price fell to around $73,000, displayed a bottom fractal, and the spread model fired a strong bottom alert (red dot + white dot) that resonated with the momentum model. The full position was exited near $73,519, netting a roughly 5.07% profit.

Risk‑management discipline: set a stop immediately upon entry; move the stop to breakeven at +1% profit; trail it to lock in 1% at +2%, thereafter advancing the stop by 1% for every additional 1% gain, dynamically protecting profits.
(Disclaimer: All views are the author’s personal technical log and do not constitute investment advice. Markets are fluid; exercise due caution.)