

This week, Bitcoin’s daily chart structure has turned bearish, and the short-term rebound is still capped by the upper boundary of its descending channel. HYPE’s seven-wave rally is displaying signs of momentum exhaustion and a pronounced top signal. The following analysis walks through multi-timeframe structures and outlines both medium- and short-term trading strategies.
BTC Multi-Timeframe Channel Structure: Lost Midline, Bounce Questionable
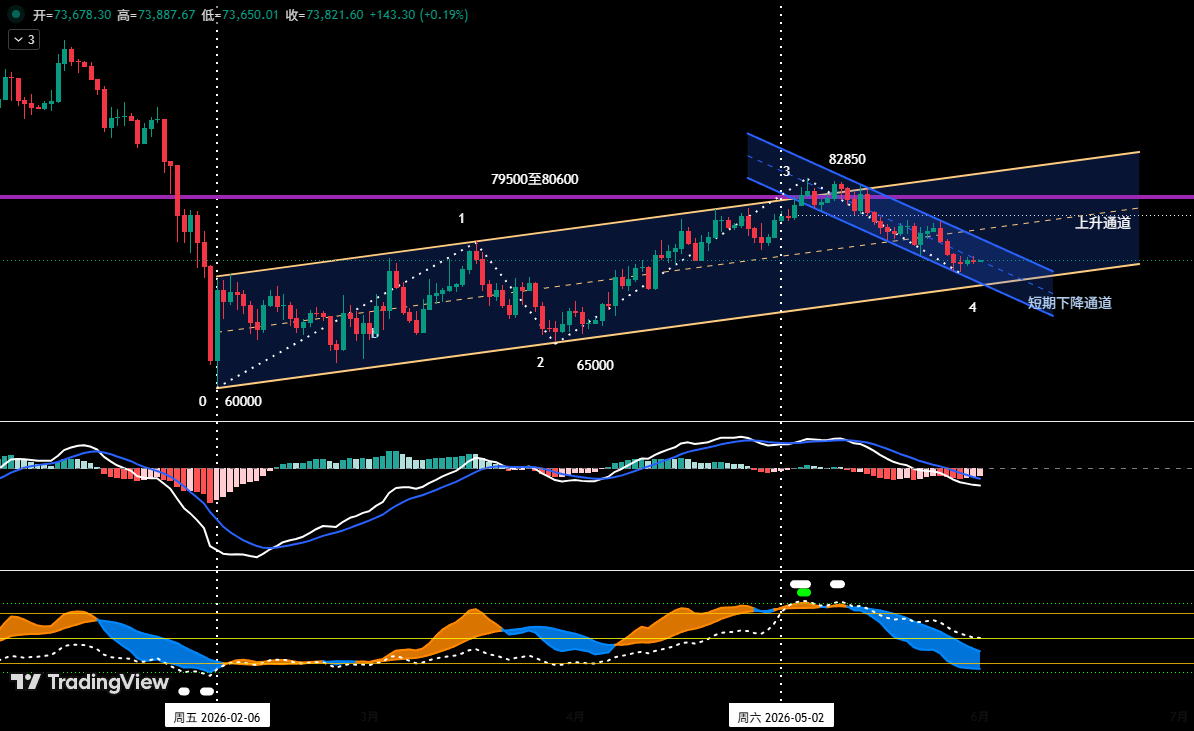
As shown in Figure 1, since the February 6, 2026 low, Bitcoin has oscillated higher within an ascending channel, with the lower trendline connecting the February 6 and March 29 lows, and the upper trendline drawn parallel from the March 17 high. After hitting the $82,850 high on May 6, the price entered a short-term descending channel—upper boundary formed by the May 14 and May 26 peaks, and lower boundary by the May 7 and May 23 lows. Currently, the price has broken below the midline of the ascending channel and is seeking stronger support at its lower rail. At the same time, after a brief bounce near the descending channel’s lower rail (~$72,500), a weak recovery toward the upper rail is underway.
Overall, Bitcoin is being squeezed by dual-channel dynamics. The current bounce mainly corrects short-term oversold conditions, targeting the descending channel’s upper rail, but because the price has already lost the ascending channel midline, the broader structure is turning weak. Once the bounce ends, the downtrend is likely to resume, testing the ascending channel’s lower boundary.
BTC 4-Hour Chart: A Ten-Segment Correction and Key Levels
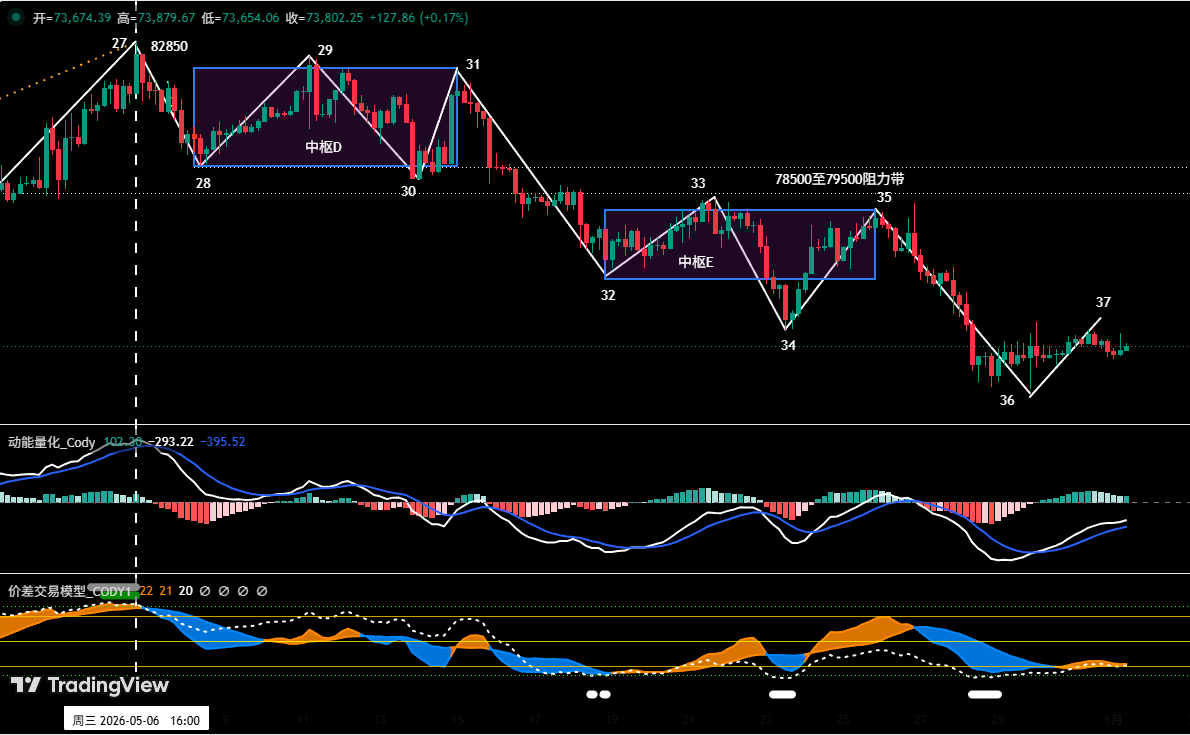
On the 4-hour chart (Figure 2), the decline from the May 6 high of $82,850 can be broken into ten segments, dubbed 27-28 through 36-37, which incorporate two consolidation pivots: Pivot D (overlapping 28-29, 29-30, 30-31) and Pivot E (32-33, 33-34, 34-35). The rebound 36-37 is now in progress. If it stalls at the $75,000–$76,000 resistance zone and fails to break through, the market will likely extend the descending structure and test support at $69,500–$70,500. Key resistance zones are $75,000–$76,000 (near the lower bound of Pivot E) and $78,500–$79,500 (across both pivots), while crucial support lies at $69,500–$70,500 and $65,000.
Short-term trading plan: Use 30% of the position on 30/60-minute charts to capture swings around these levels. We have prepared two plans: Plan A – short upon rejection at $75,000–$76,000 when the quantitative model confirms a top signal, with a stop above $77,000 and partial exits near support. Plan B – short when the price convincingly breaks below $69,500–$70,500 with a top signal, stop above $72,000, and scale out as support levels are hit.
HYPE Seven-Wave Structure and Top Signals
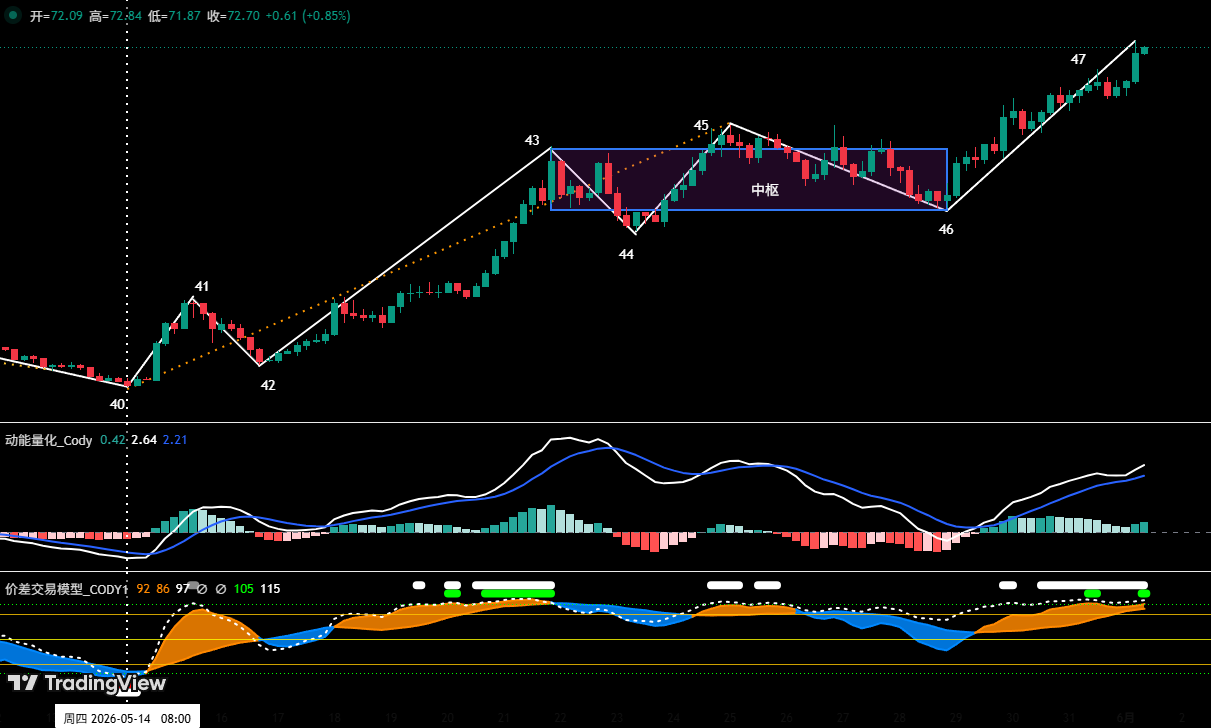
As shown in Figure 4, HYPE’s 4-hour chart shows a seven-wave advance from the May 14 low of $38.14, with a consolidation pivot formed by overlapping waves 43-44, 44-45, and 45-46. Earlier weekly reviews already flagged that endpoint 45 (at $64.75) exhibited bearish momentum divergence alongside the price-action model’s top warning, making a short-term peak likely. The market confirmed this: the drop from endpoint 45 to endpoint 46 ($56.30) produced a maximum loss of 13.05%. Now, the exit wave 46-47 shows weaker momentum than entry wave 42-43, hinting at a potential bearish divergence, and the proprietary “spread trading model” has triggered a strong top signal (red+white dots) at endpoint 47.
The key this week is whether endpoint 47’s top signal coincides with a confirmed momentum divergence. Should the price subsequently break below the $62.5–$64.57 support zone, endpoint 47 would likely mark the termination of the entire rally from May 14. Short-term HYPE trading should follow a “buy on dips, avoid chasing rallies” approach. Watch the $62.5–$64.75 region: if a stable rebound appears alongside bottom signals from the models, a light long position (below 30%) can be considered, with strict stops. A decisive breakdown, however, would upgrade the pullback to a larger degree—targeting the $54–$56.3 area.
Last Week’s Short Trade Review and Risk Discipline
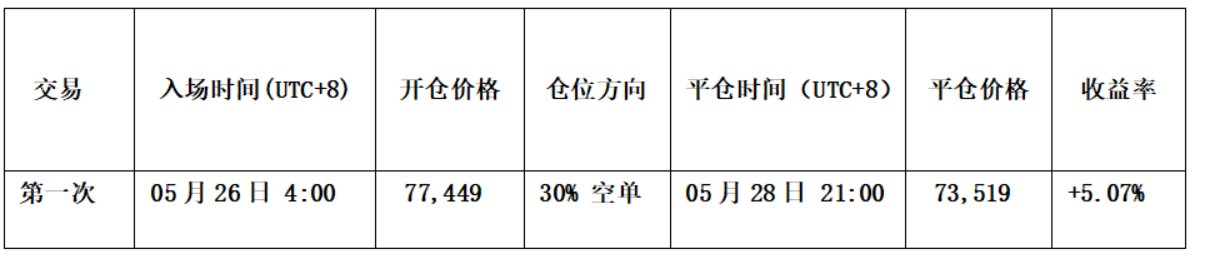
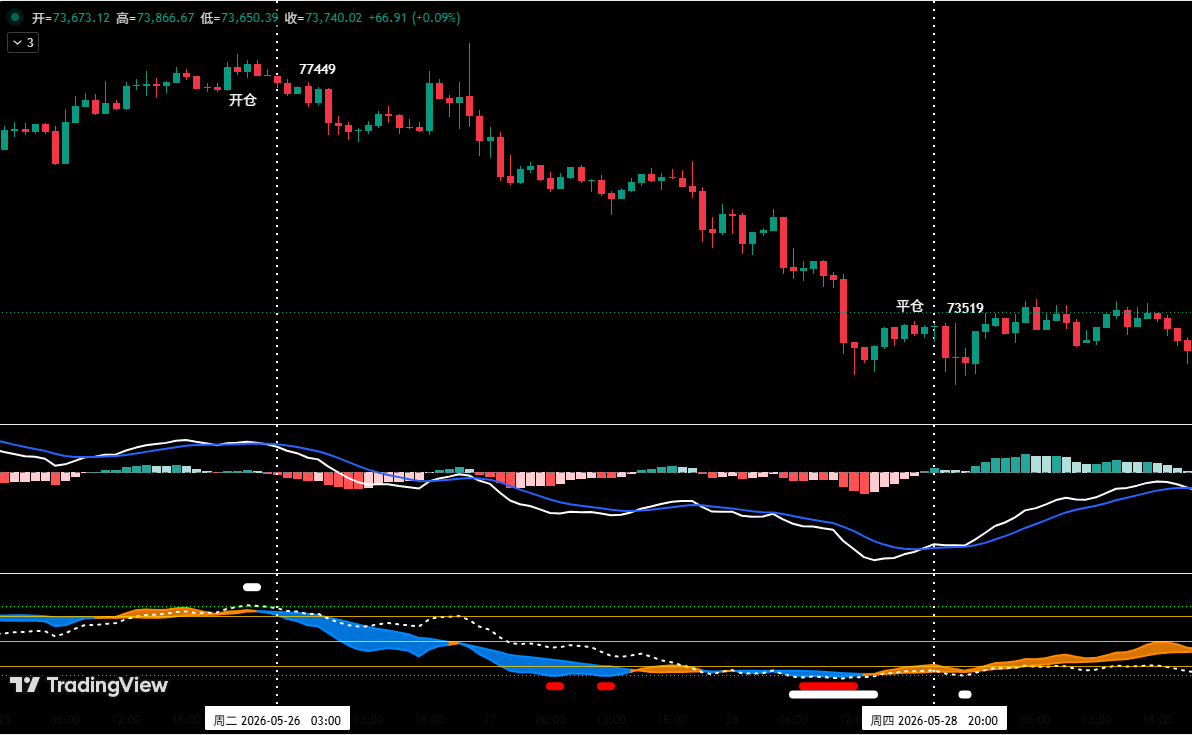
Last week, using the proprietary models, we executed one short BTC trade (1x leverage) with a profit of about 5.07%. Entry logic: the price stalled near $78,000 with a bearish Doji pattern, the spread model issued a top warning (white dot), and the momentum model confirmed divergence—resulting in a 30% short at $77,449. Exit logic: near $73,000 the price stabilized with a bullish Doji, and both models simultaneously flashed bottom signals, leading to a full close near $73,519.
Risk rules are non-negotiable: set a stop immediately upon entry; at +1% profit, move stop to breakeven; at +2%, move stop to lock in 1% profit; thereafter, trail the stop by 1% for every additional 1% gain.

Financial markets move fast. All views herein are based on personal technical analysis and serve only as a trading journal; they do not constitute investment advice. Market risks are real—trade cautiously.