

BTC Daily: Ascending Channel Breached, Short-Term Descending Channel Dominates
Since the February 6, 2026 low, Bitcoin has oscillated upward within an ascending channel (yellow), defined by a lower trendline connecting the Feb 6 and Mar 29 lows and an upper parallel through the Mar 17 high. Recently, however, the price fell below the midline of this channel and is now heading toward its lower support. Meanwhile, after peaking at $82,850 on May 6, BTC entered a short-term descending channel (blue). The upper line of this channel connects the May 14 and May 26 rebound highs, while the lower line links the May 7 and May 23 correction lows. The price briefly stabilized around $72,500—the blue channel's lower support—and is currently in a weak recovery phase aiming for the channel's upper band.
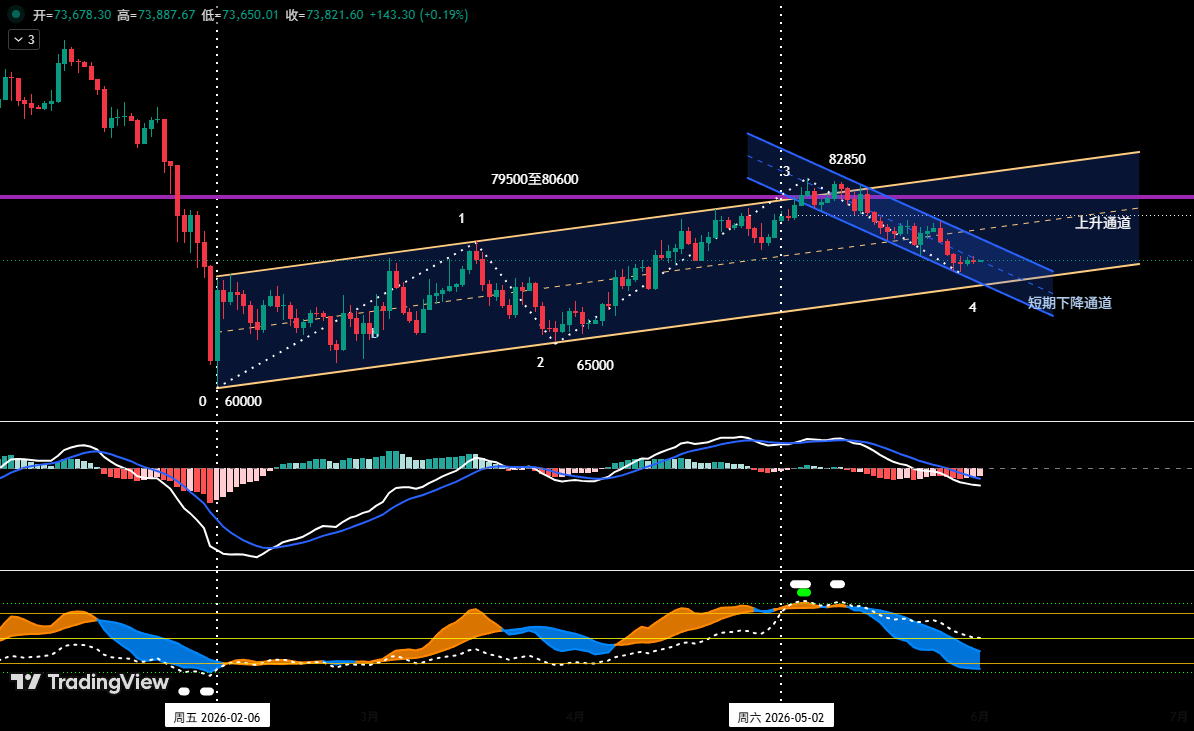
Overall, BTC is caught between these two channel frameworks. The current rebound is primarily a relief from short-term oversold conditions, targeting the blue channel's upper resistance. Yet, the loss of the yellow channel's midline has weakened the broader structure, suggesting that once this bounce fades, the downtrend is likely to resume and test the lower yellow channel support.
4-Hour Structure: 10-Segment Correction and Short-Term Tactics
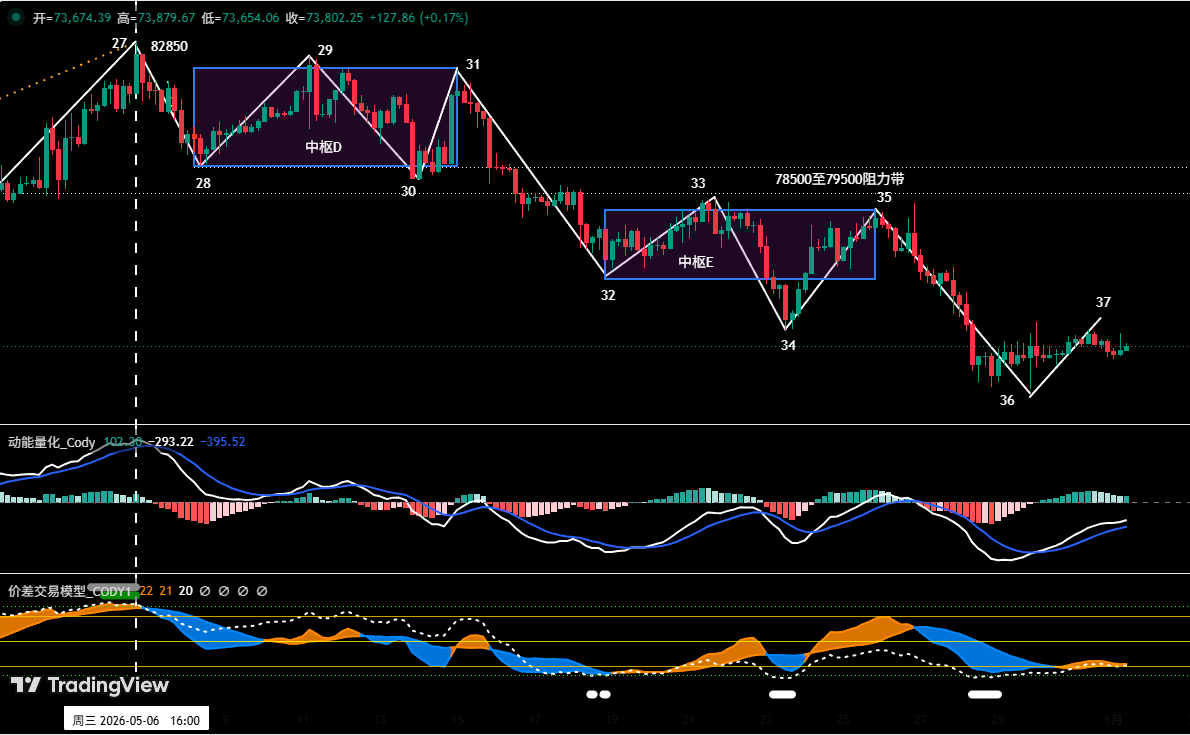
On the 4-hour timeframe, the decline from the $82,850 high can be decomposed into ten segments labeled “27-28” through “36-37,” encompassing two consolidation zones. Central D is formed by the overlapping segments 28-29, 29-30, and 30-31; Central E is formed by 32-33, 33-34, and 34-35. The market is currently in segment 36-37, a rebound. Should this rally stall and fail to break through the $75,000–76,000 zone, the broader corrective structure will likely persist, with the next test lying at the $69,500–70,500 support area.
Key resistance levels are $75,000–$76,000 (near the lower boundary of Central E) and $78,500–$79,500 (around the edges of both central zones). On the support side, the first floor sits at $69,500–$70,500, with a second at about $65,000.
For short-term operations, we deploy up to 30% of capital to capture price swings around these levels. To adapt to market conditions, two plans have been pre-set. Plan A: If the price encounters resistance in the $75,000–76,000 range and quantitative models issue a top signal, establish a short position of up to 30% with an initial stop above $77,000; gradually exit as the price approaches key support. Plan B: Upon a confirmed breakdown below $69,500–70,500 accompanied by model top signals, open a short of similar size with a stop above $72,000, and take profits as the decline reaches major supports.
HYPE: Seven-Segment Structure Displays Top Signals
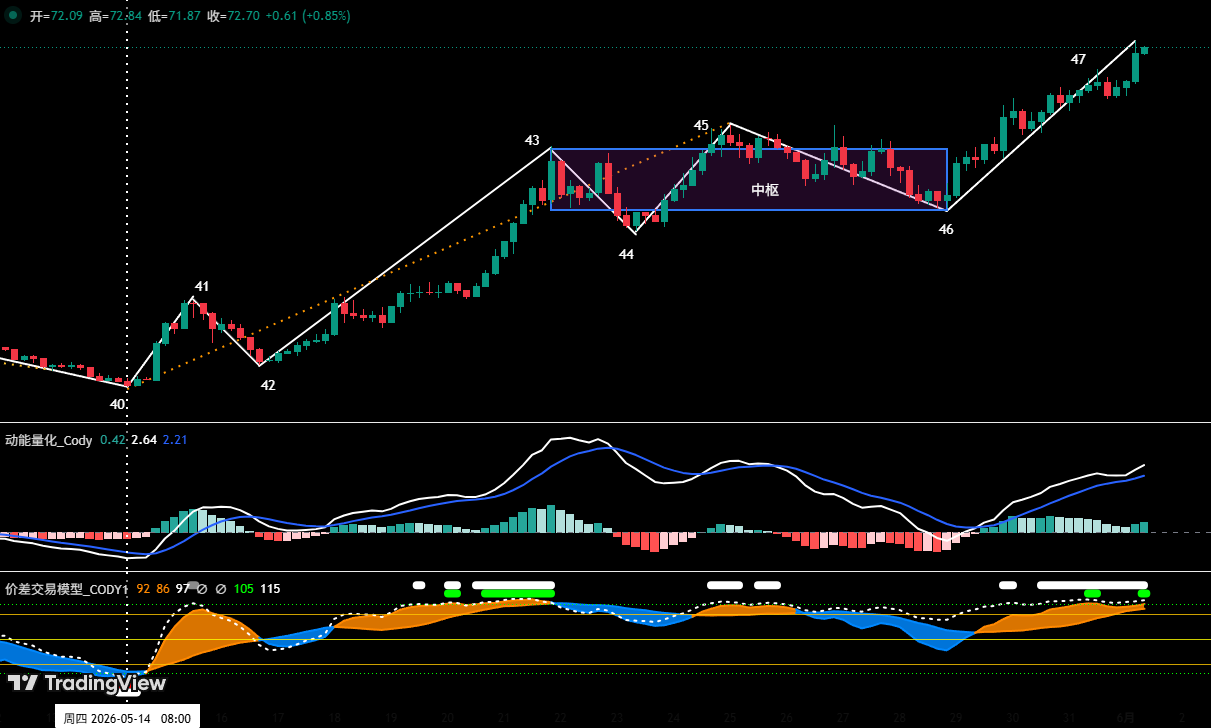
On the 4-hour chart, HYPE has built a clear seven-segment structure (40-41 through 46-47) since its May 14 low at $38.14. Segments 43-44, 44-45, and 45-46 overlap to form an ascending central zone. Earlier analysis warned that a momentum divergence at Point 45, coupled with a top alert from our price-difference trading model, pointed to a high probability of a short-term peak. Indeed, the market corrected from $64.75 to $56.30, a maximum drop of 13.05%.
Now, comparing the exit segment 46-47 with the entry segment 42-43, upward momentum appears exhausted, setting up a potential momentum divergence. At the same time, our model has triggered a strong top warning (red dot + white dot) at Point 47. If the top signal is confirmed and the divergence holds, a subsequent break below the $62.5–64.57 support zone would identify Point 47 as the terminal high of this rally. This week’s short-term strategy is to “buy on dips, avoid chasing highs.” The focus is on how price reacts to the $62.5–64.75 region: a bullish setup with model bottom signals would allow a light long position (≤30%), while a clear breakdown would escalate the correction to the daily scale, targeting $54–56.3 next.
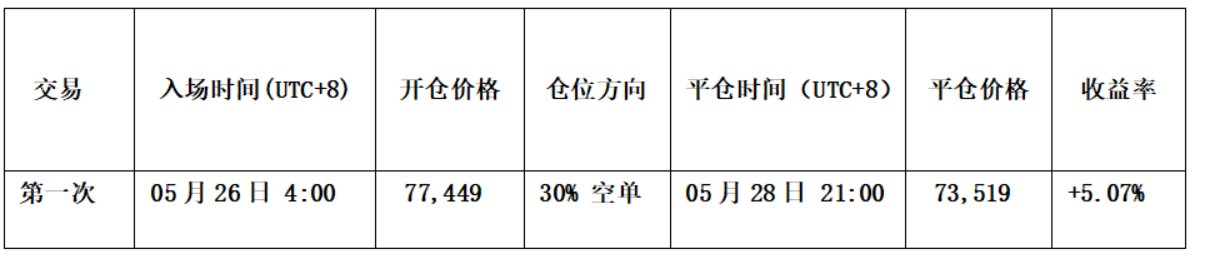
Last Week’s Short Trade Review: 5.07% Gain
Last week, we executed a disciplined short based on model signals. Entry conditions: a bearish top reversal pattern around $78,000, a top alert from the price-difference model, and a momentum divergence signal from the quantitative momentum model—leading to a 30% short position at $77,449. Exit conditions: a bottom reversal pattern near $73,000 combined with converging model buy signals, resulting in a full close at $73,519. The trade achieved roughly 5.07% profit.
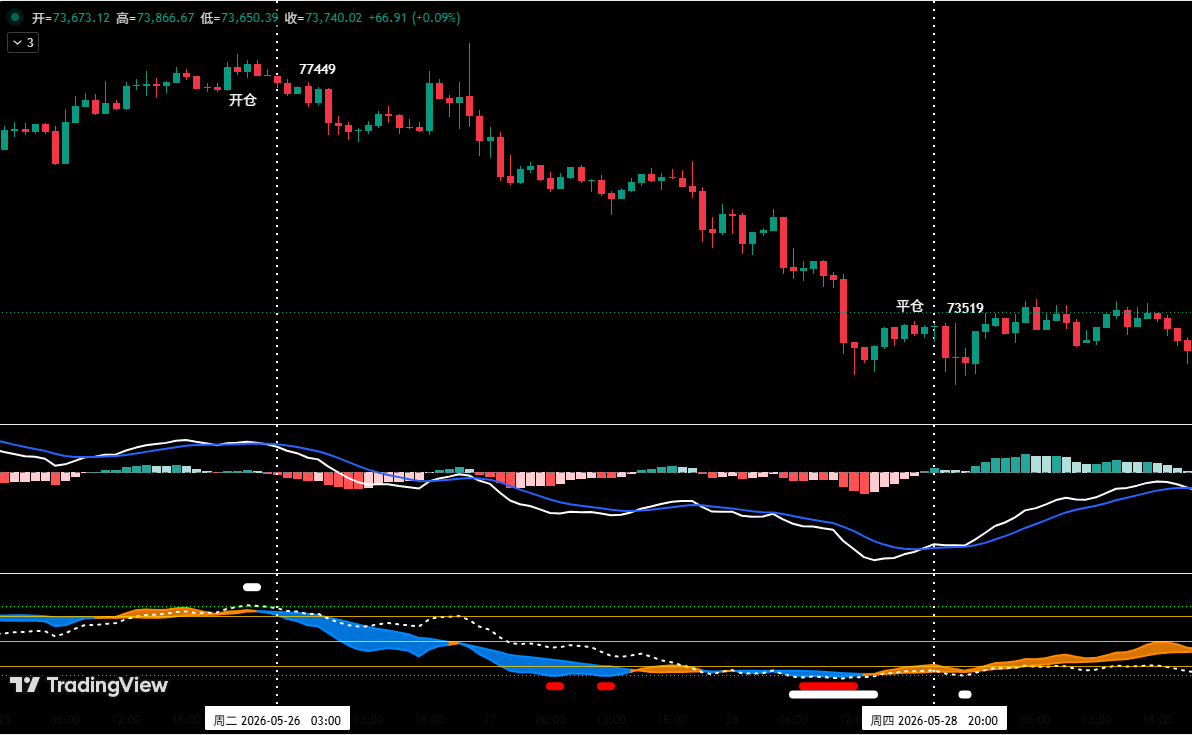
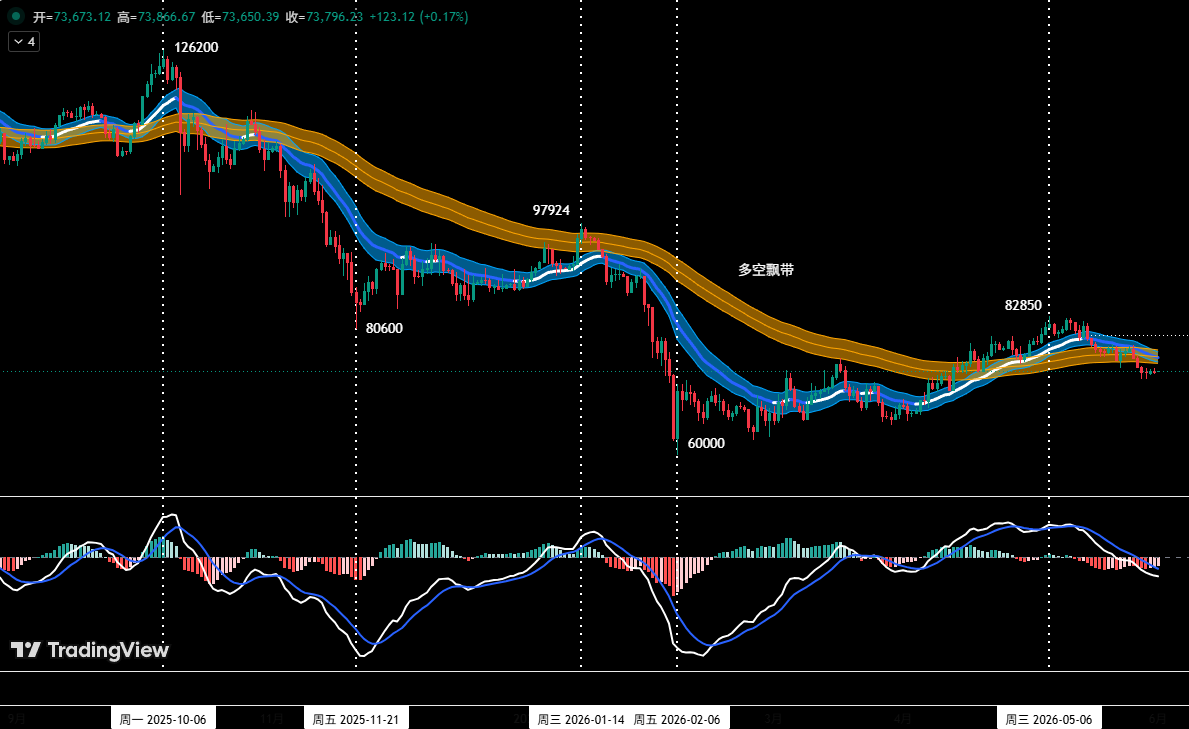
Additional technical charts used in this analysis are shown below:
Risk management rules remained in force: place a stop immediately upon entry; move stop to breakeven once the trade gains 1%; lock in 1% profit when up 2%; and then trail the stop by 1% for every subsequent 1% gain, safeguarding capital dynamically.

Disclaimer
All views and strategies herein are based on personal technical analysis and serve only as a trading journal. They do not constitute investment advice. Markets change rapidly; adjust your approach accordingly and always manage your own risk.