

Bitcoin's recent rebound from the 72,500 zone has done little to alter the broader bearish technical structure. The cryptocurrency has lost the mid-line of its ascending channel (in yellow) originating from the February 6 low, and remains dominated by a shorter-term descending channel (in blue) that started from the May 6 high at 82,850. The ongoing recovery is viewed as a weak correction within an overall downward framework, with upside capped by the upper boundary of the short-term channel.
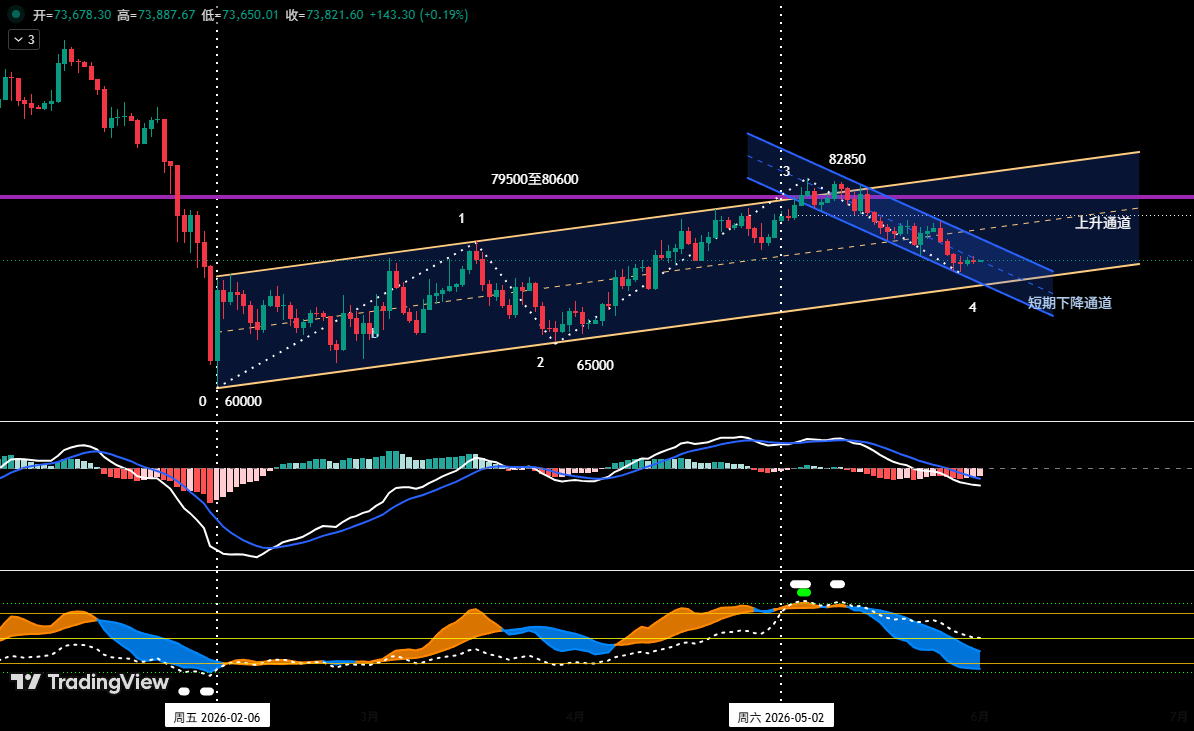
BTC Multi-Timeframe Structure: Dual Channels and Consolidation Hubs
On the 4-hour chart, the decline from 82,850 has unfolded as a 10-leg corrective structure (waves 27-28 through 36-37), containing two consolidation hubs (D and E). The current wave 36-37 rebound is targeting the 75,000–76,000 region, which coincides with the lower boundary of hub E and serves as the first resistance zone. A second resistance area stands at 78,500–79,500. Should the rebound falter at these levels, the market is likely to resume its downward trajectory, testing support at 69,500–70,500 and then the 65,000 vicinity.
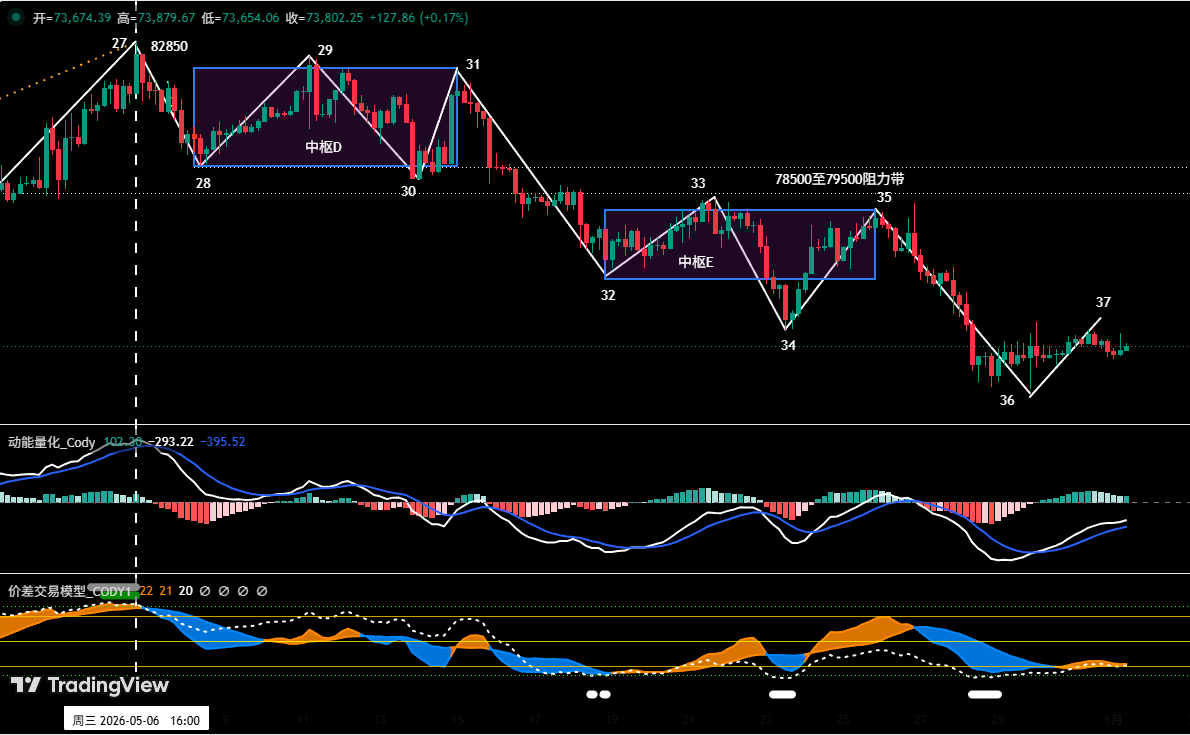
The yellow ascending channel’s support line connects the February 6 and March 29 lows, while its upper rail is drawn parallel through the March 17 high. The blue descending channel is defined by the May 14 and May 26 rebound highs (upper rail) and the May 7 and May 23 lows (lower rail). Price briefly stabilized at the blue channel’s lower rail, yet the bounce has lacked the strength to challenge the dominant downtrend.
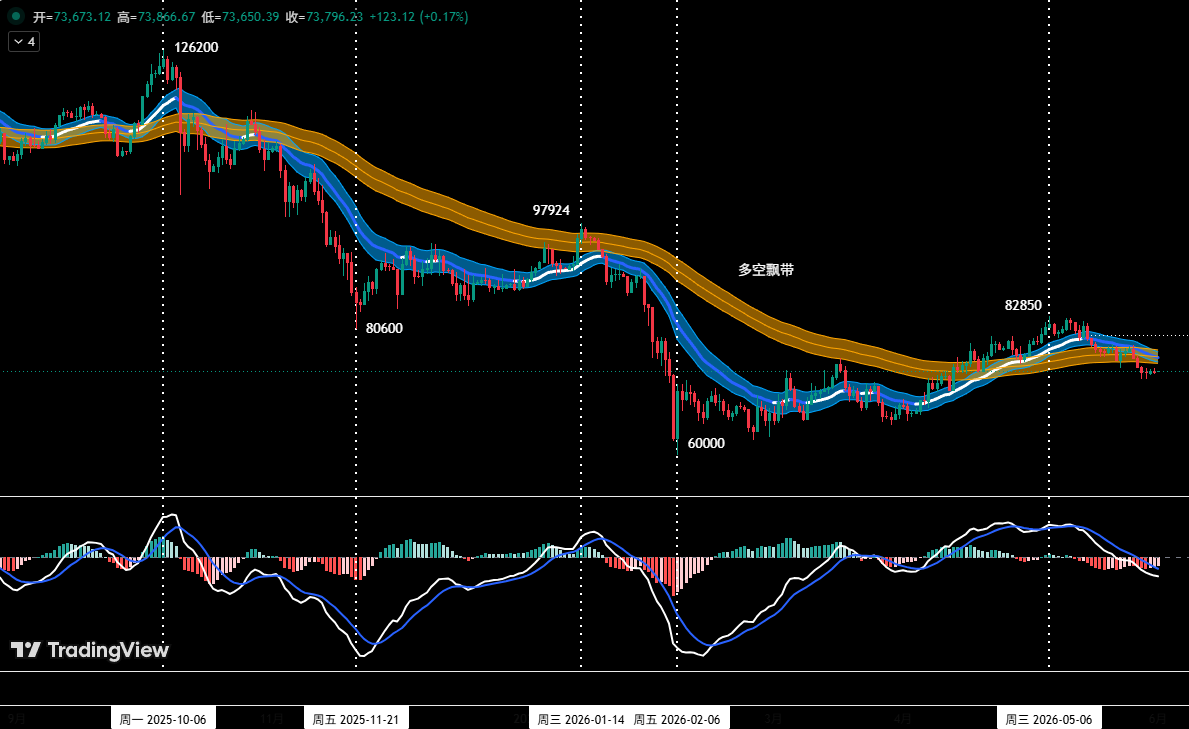
BTC Short-Term Strategies: Two Short Plans
With only 30% of capital allocated to swing trades, two scenarios are prepared. Plan A: if price meets resistance in the 75,000–76,000 range and model-based top signals appear, initiate a short position (30% or less) with a stop loss above 77,000. Plan B: if price decisively breaks below the 69,500–70,500 support zone, enter a short position with a stop above 72,000. In both cases, positions are scaled out as price reaches key support levels.
HYPE Structure: Seven-Leg Rally Meets Momentum Divergence
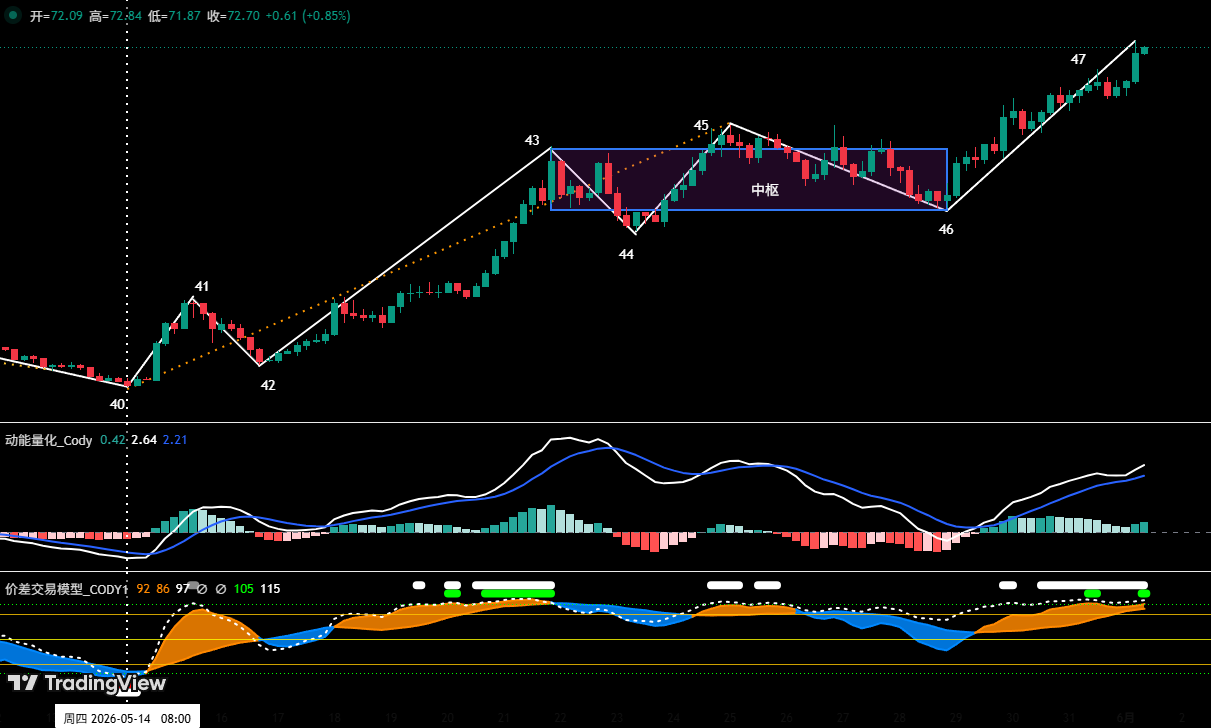
HYPE’s 4-hour structure since the May 14 low at 38.14 has formed a clear seven-leg advance (40-41 to 46-47) with an ascending hub between legs 43-46. A prior momentum divergence at point 45, confirmed by model top alerts, already caused a 13.05% correction from 64.75 to 56.30. Now, the exit leg (46-47) shows distinctly weaker momentum than the entry leg (42-43), and the proprietary “spread trading model” has triggered a strong top signal (red dot + white dot) at point 47. If the momentum divergence is confirmed and price subsequently breaks below the 62.5–64.57 support zone, the entire rally from 38.14 may have ended.
HYPE Short-Term Play: Buy Dips, Avoid Chasing
The core tactic this week is to let HYPE pull back to the 62.5–64.75 zone and wait for stabilization signals. If the price holds this zone and bottom signals from both models coincide, a light long position (below 30% capital) can be considered with strict stop-loss discipline. However, a breakdown below this zone would escalate the correction to a daily-level swing, with initial downside targets at 54–56.3. Patience is emphasized over chasing any sudden strength.
Last Week’s Trade Recap: 5.07% Short Profit
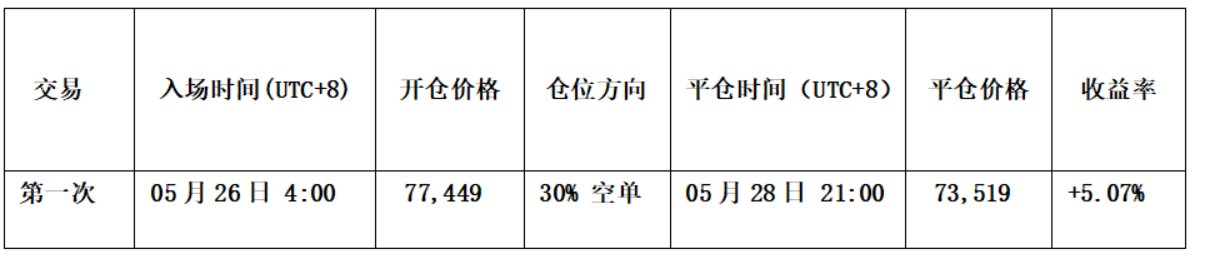
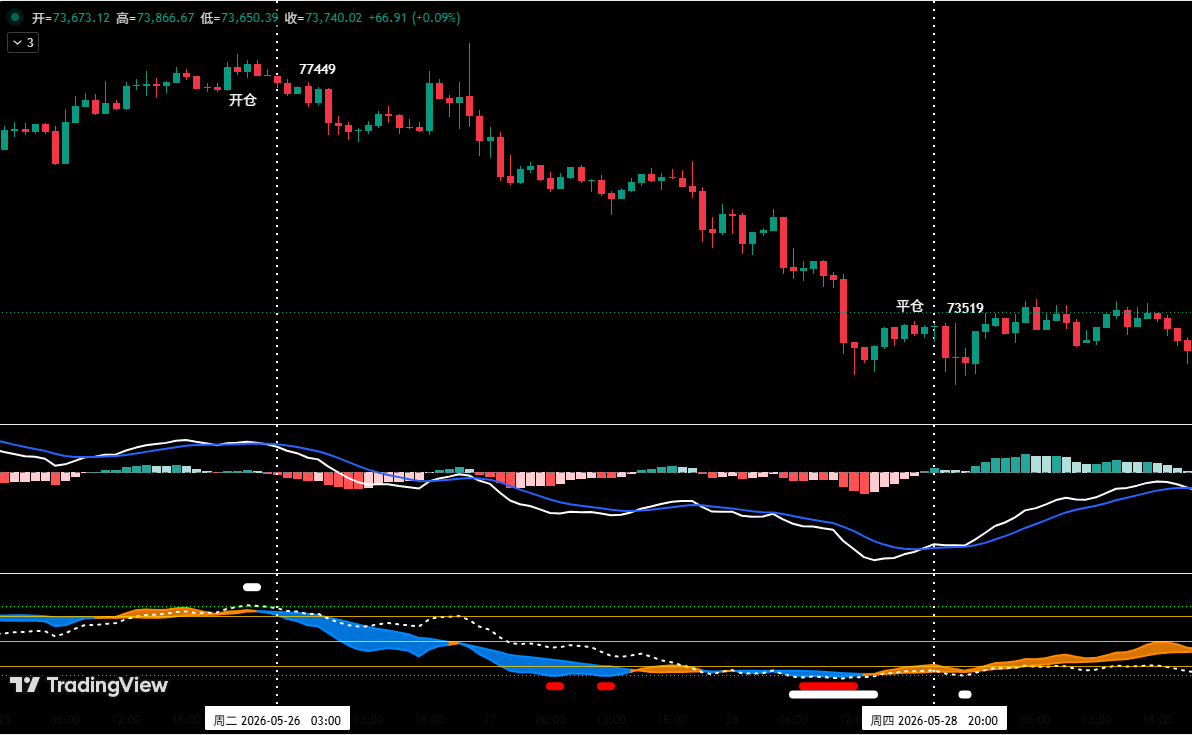
Executing precisely on model signals, the team entered a 30% short position in Bitcoin at 77,449 when a bearish top consolidation pattern appeared alongside top warnings from both the spread trading model and the momentum quantization model. The position was fully closed at 73,519 after formation of a bullish bottom pattern and coincident bottom-signal resonance. The trade resulted in a net gain of 5.07%.

Trailing stop discipline was strictly applied: an initial stop was set upon entry; once a 1% profit was achieved, the stop was moved to breakeven; at 2% profit, the stop was trailed to lock in 1% gain; thereafter, every additional 1% gain was accompanied by a 1% upward adjustment of the stop, systematically defending profits.