

Bitcoin continues to drift within a corrective pattern this week, with the daily structure turning weak and the current rebound resembling more of a technical repair of short-term oversold conditions. Meanwhile, HYPE's extended rally is showing signs of exhaustion, with top signals already flashing. This article dissects the multi-timeframe structures of both assets and delivers concrete short-term and swing trading plans for the week ahead.
BTC Multi-Timeframe Structure: Caught Between Two Channels, Limited Upside
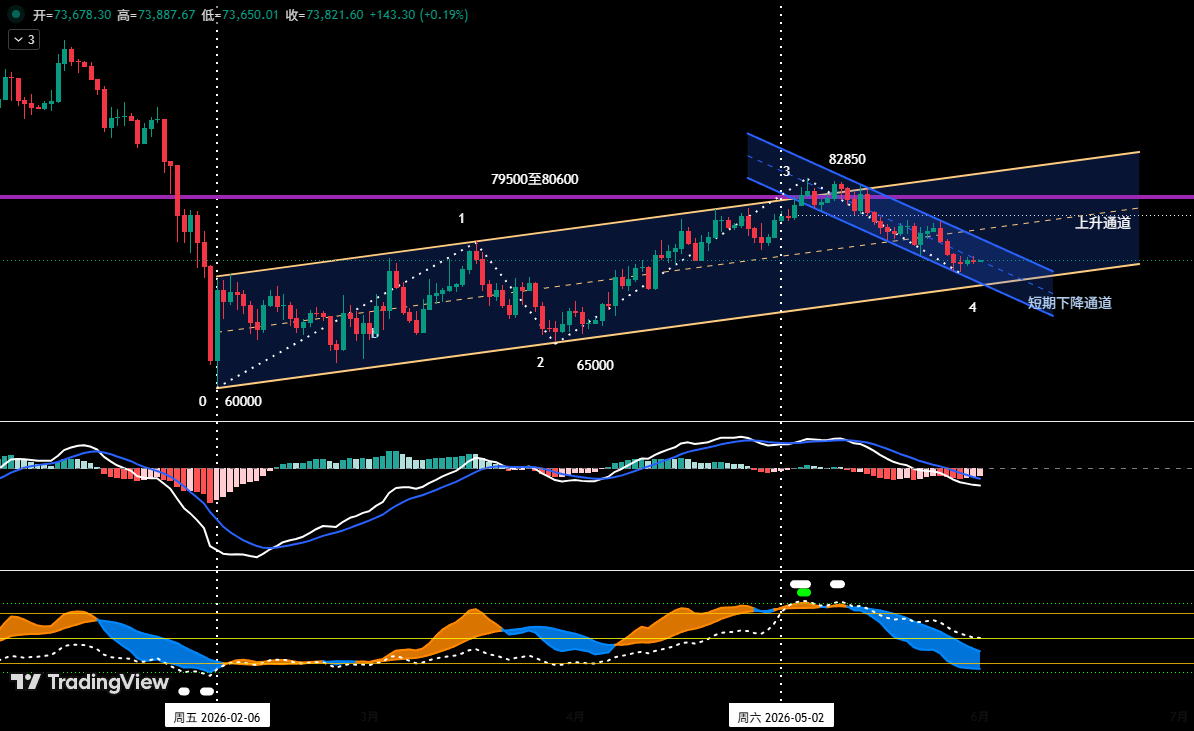
Since the February 6, 2026 low, Bitcoin has been traveling within a relatively gentle ascending channel (yellow), with the lower boundary formed by the lows of February 6 and March 29, and the upper boundary drawn parallel to the March 17 high. But the price has now lost the channel's midline and is drifting toward the lower edge for stronger support. Simultaneously, after peaking at $82,850 on May 6, BTC entered a short-term descending channel (blue), bounded by the reaction highs of May 14 and May 26 on the top and the corrective lows of May 7 and May 23 on the bottom. Having briefly found support near the blue channel's lower trendline around $72,500, the price is now staging a weak bounce toward the blue channel's upper boundary.
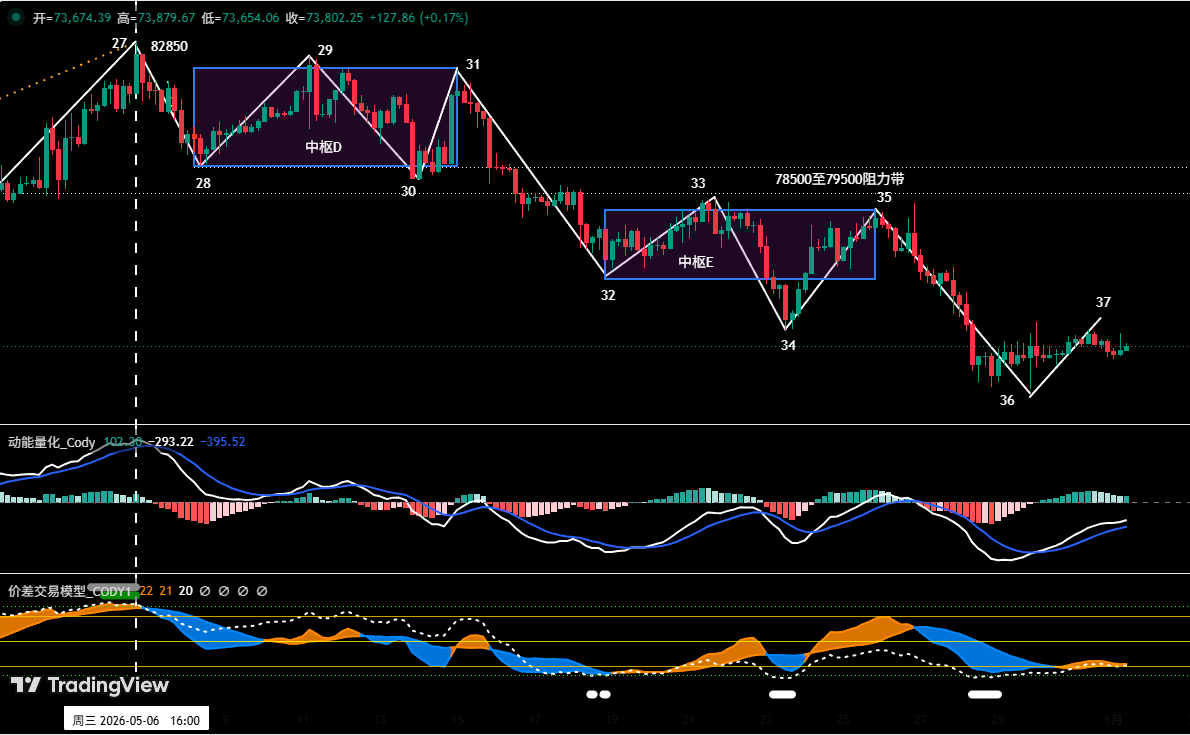
On the 4-hour chart (Figure 2), the correction from $82,850 can be subdivided into a 10-segment structure, featuring two overlapping consolidation zones: Pivot Zone D formed by segments 28-29, 29-30, and 30-31, and Pivot Zone E formed by segments 32-33, 33-34, and 34-35. The market is now in the 36-37 rebound segment. If the price stalls and reverses from the $75,000–$76,000 area (near the lower boundary of Pivot Zone E), the prevailing downtrend is likely to resume, targeting the $69,500–$70,500 support zone, with further support near $65,000. Key resistance levels are layered at $75,000–$76,000 and $78,500–$79,500.
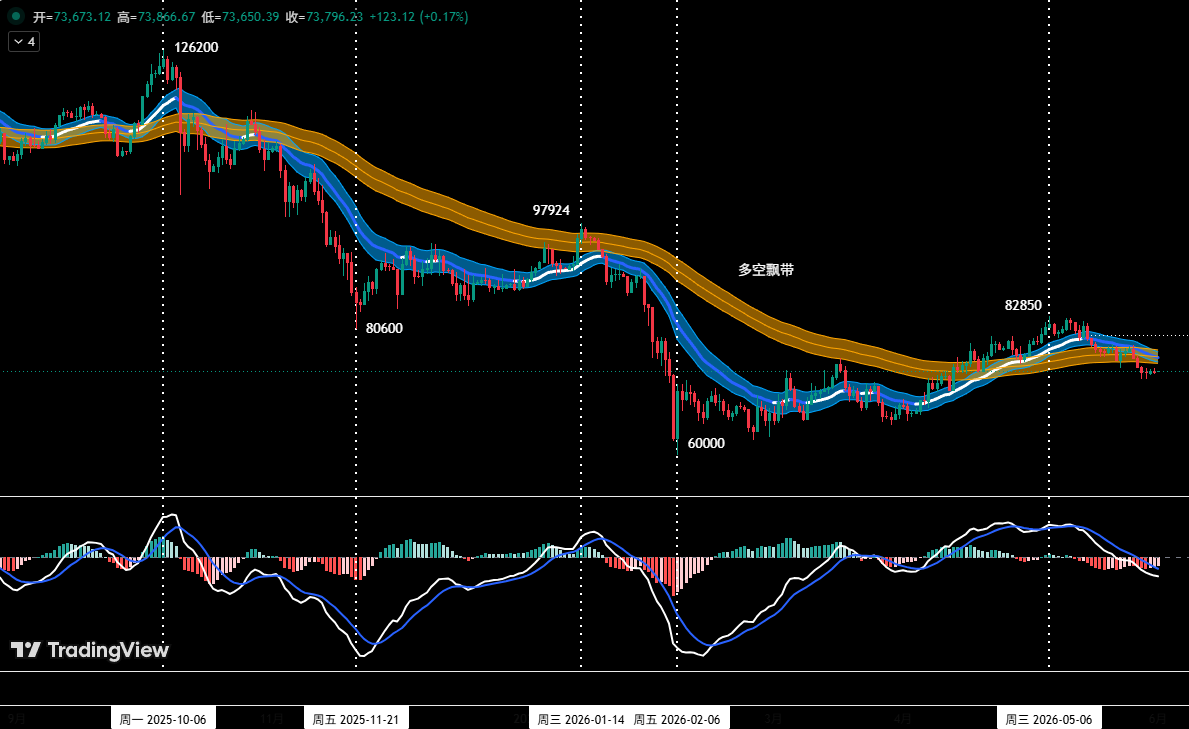
BTC Weekly Strategy: Short-on-Rally Approach with Two Contingency Plans
The core mid/short-term strategy remains "sell rallies." Using 30% of capital, traders can look for spread opportunities on 30-minute or 60-minute charts. Two specific plans have been prepared:
Plan A — Fade the bounce: When price consolidates in the $75,000–$76,000 resistance zone and the quantitative model generates a top signal, initiate a short position with up to 30% exposure, placing an initial stop-loss above $77,000. Take profits gradually near key support levels as model signals confirm.
Plan B — Breakdown follow-through: If price breaks decisively below the $69,500–$70,500 support area accompanied by a model top signal, establish a short position of ≤30% with a stop above $72,000. Liquidate in stages when the model triggers at lower support zones.
HYPE Structure: Seven-Wave Rally Nears Exhaustion, Top Divergence Intensifies
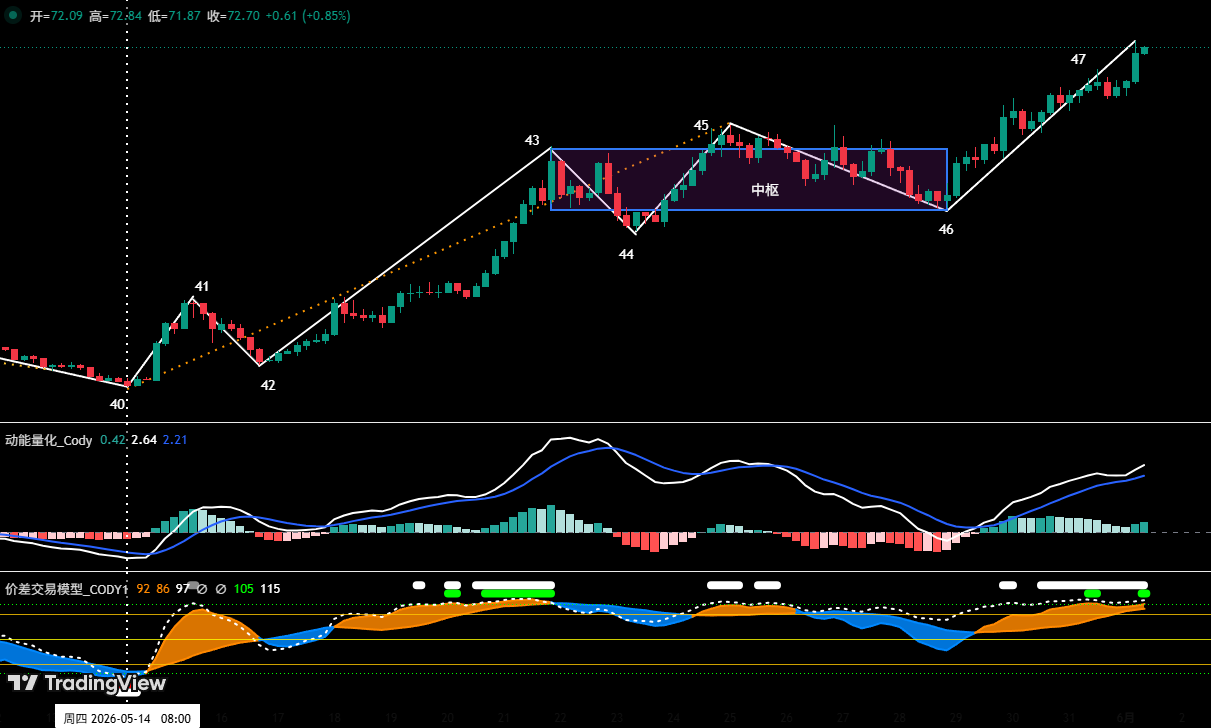
On the 4-hour timeframe, HYPE's ascent since the May 14 low of $38.14 has unfolded as a clean seven-wave structure containing a rising consolidation zone. Segments 43-44, 44-45, and 45-46 overlap to form the central pivot. Our prior weekly commentary flagged the bearish divergence at endpoint 45 combined with the proprietary spread model's top warning, a resonance that subsequently produced a 13.05% drop from $64.75 to $56.30 — precisely confirming the signal's validity.
Now, the exit segment 46-47 is showing clear momentum fatigue when compared to the entry segment 42-43, implying a high probability of momentum divergence. The in-house spread trading model has issued a strong top alarm (red + white dots) at endpoint 47. Should momentum divergence materialize and price subsequently break below the $62.5–$64.57 support band, endpoint 47 would mark the terminal high of the rally that began on May 14. Thus, the near-term tactic is to "buy dips, avoid chasing rallies." If price retraces to the $62.5–$64.75 zone and prints a bullish reversal signal with model bottom confirmations, a light long of less than 30% exposure can be considered with strict stop-loss discipline. A decisive break below this zone would escalate the correction to a higher-degree (daily) adjustment, targeting the $54–$56.3 region.
Trade Review and Risk Management Reminder
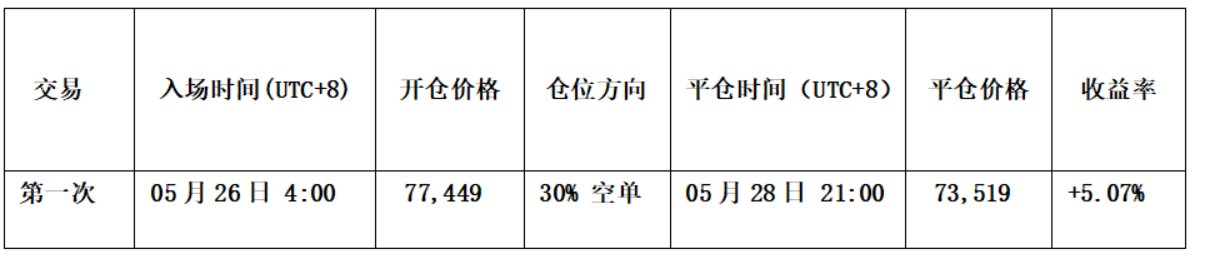
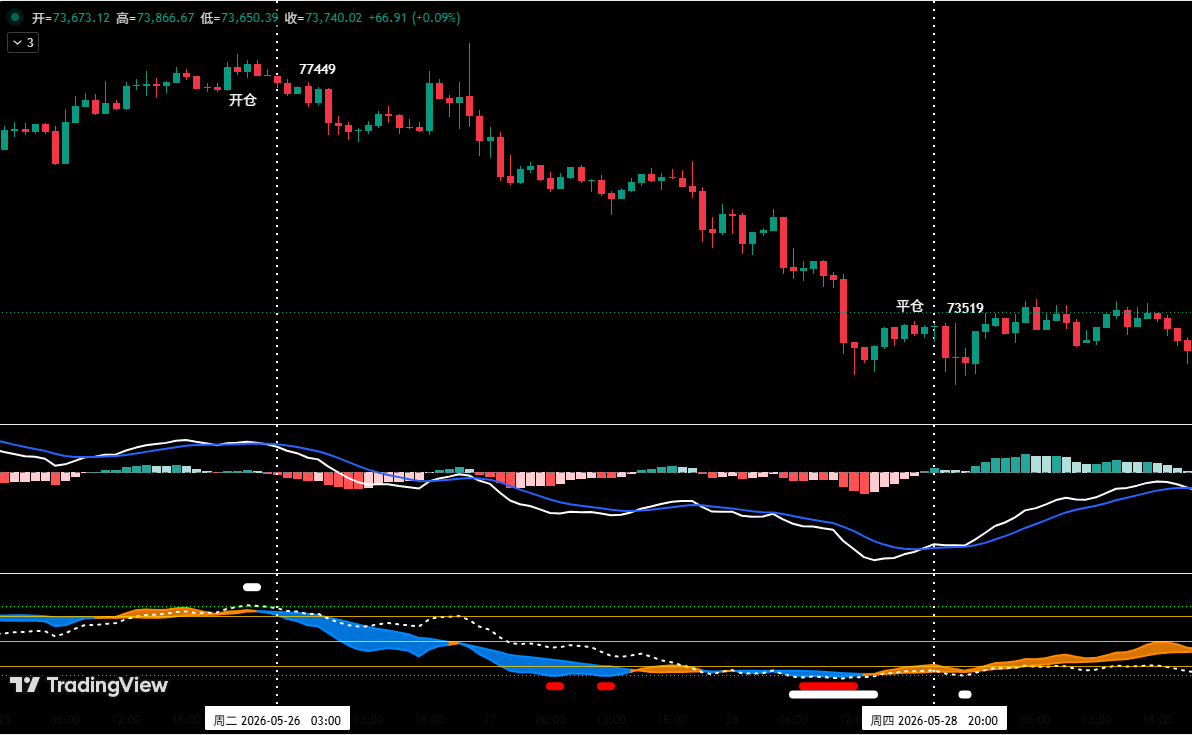
Last week, following the coordinated signals of our spread trading model and momentum quantification model, we executed one short-term short trade. The entry signal arrived as price approached $78,000, with a bearish top candle pattern, a white-dot top alert from the spread model, and a momentum divergence from the quantification model. We shorted at $77,449 with 30% position sizing. As price slid toward $73,000, a bottom candle formation emerged, and both models simultaneously issued strong bottom resonance signals (red + white dots), prompting a full exit near $73,519 — netting a profit of approximately 5.07%.

On capital management, an initial stop-loss must be set immediately upon entry. Once profit reaches +1%, move the stop to breakeven. At +2%, lock in 1% by moving the stop accordingly. Thereafter, for each additional 1% gain, shift the stop up by an equal amount, progressively protecting profits and securing capital. Markets are dynamic; all analyses and strategies derive from personal technical logs and should never be interpreted as investment advice. Exercise caution and make decisions independently.