BTC Multi-Timeframe Structure Weakens
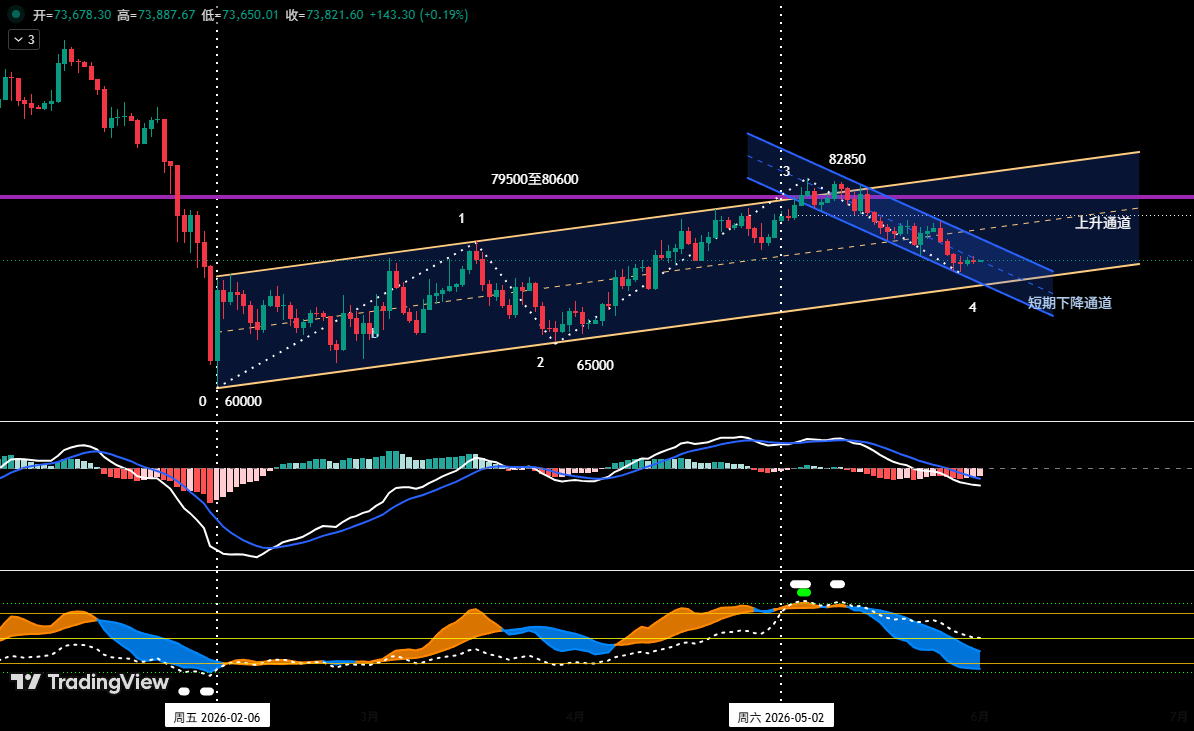
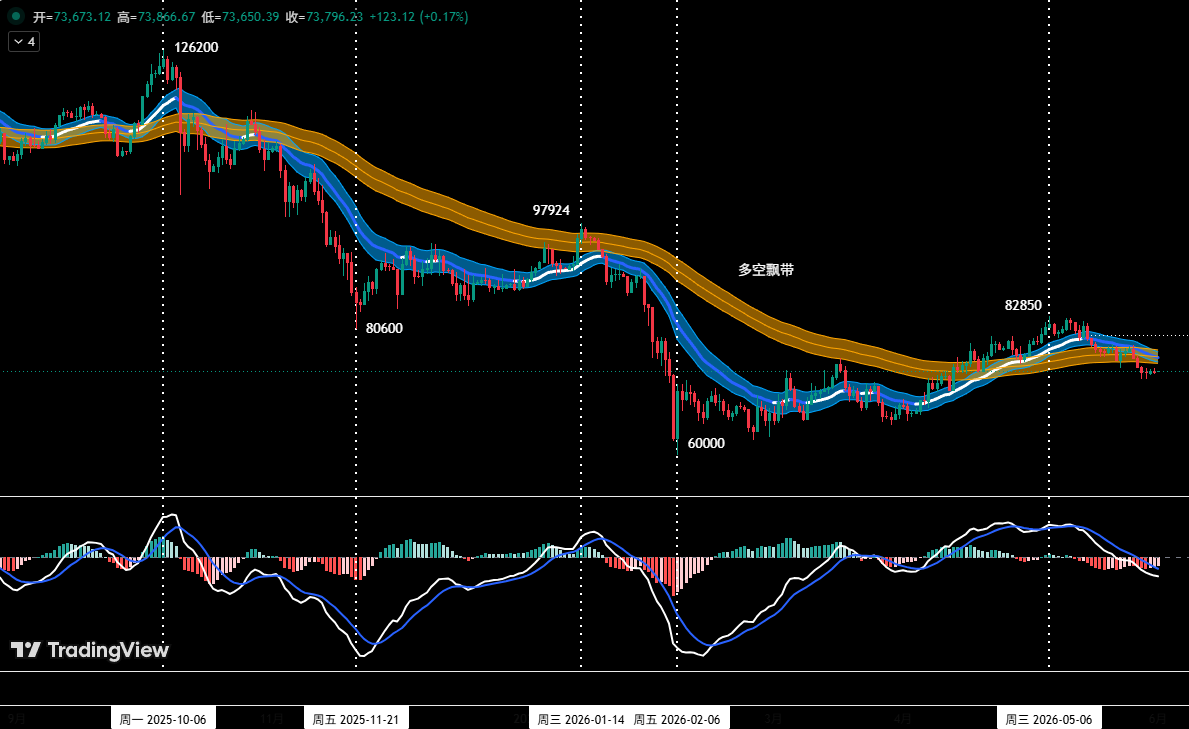
Since touching $82,850 on May 6, Bitcoin has been moving within a short-term descending channel (blue). The upper boundary connects the rebound highs on May 14 and May 26, while the lower boundary links the correction lows on May 7 and May 23. After testing the lower boundary near $72,500, BTC found temporary support and is now in a weak rebound aimed at the upper boundary of the blue channel. However, viewed within the larger ascending channel (yellow) that began from the February 6 low, price has already lost the channel's midline and is trending toward the lower support line. This deterioration in overall structure suggests the current bounce is merely an oversold repair. Once the rebound meets resistance, the price is likely to resume the downtrend and test the lower boundary of the yellow ascending channel.
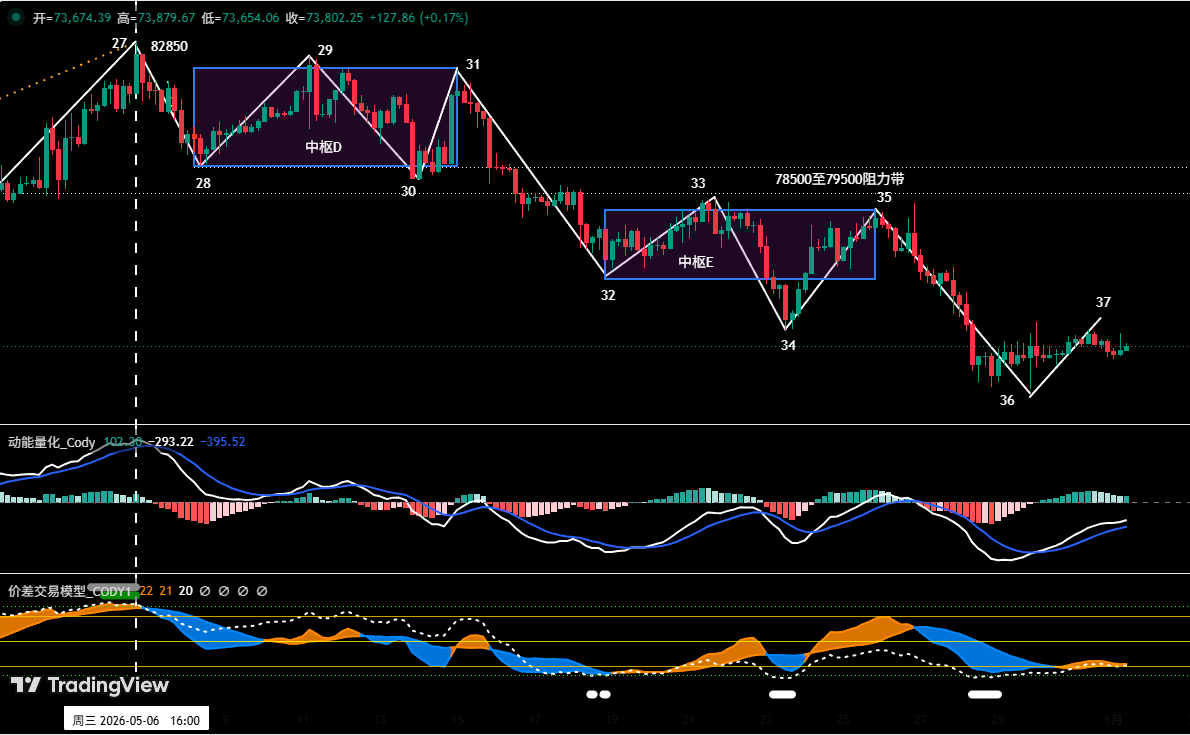
On the 4-hour timeframe, the decline from $82,850 can be subdivided into a 10-leg structure, with two descending consolidation zones D and E formed along the way. Currently, the 36–37 rebound leg is underway. Should the price reach the $75,000–$76,000 area (near the lower boundary of consolidation E) and fail to break through, the market will likely continue its downward oscillation, targeting the $69,500–$70,500 support zone, and possibly extending to the $65,000 region. The second resistance area lies at $78,500–$79,500.
HYPE Seven-Wave Rally Ends with Resonance Warning
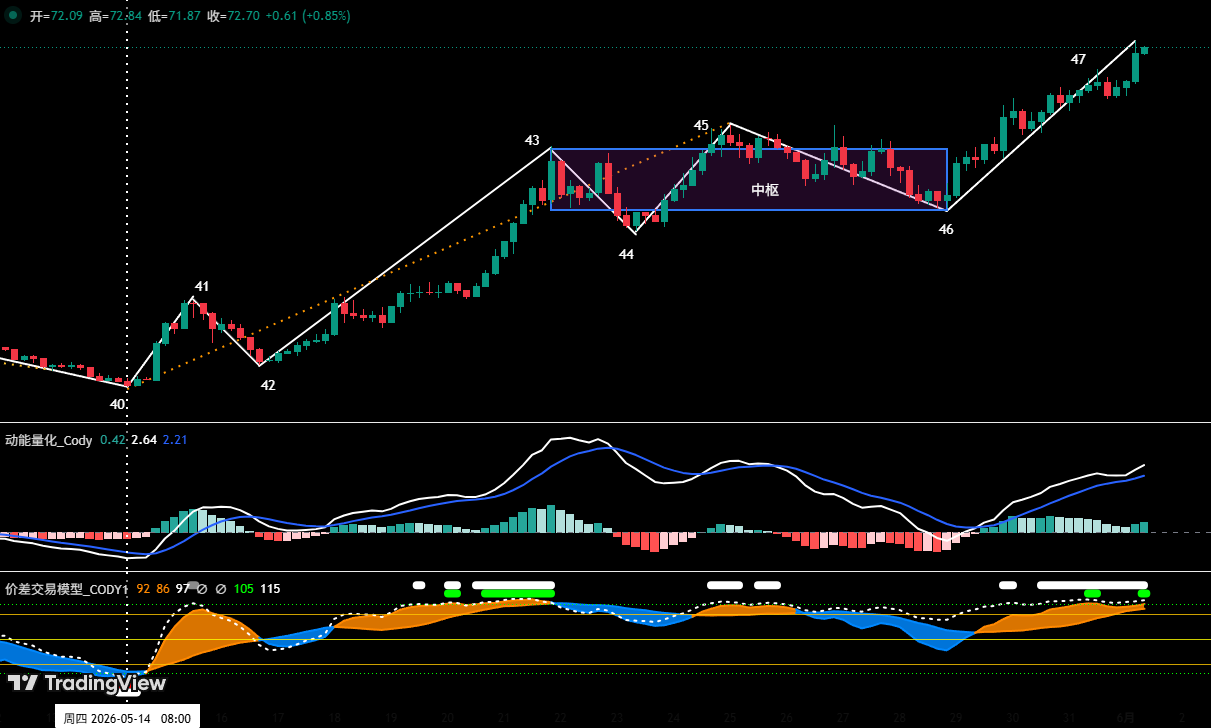
On the 4-hour chart, HYPE's advance from the May 14 low of $38.14 has clearly formed a seven-wave structure (40–41 through 46–47), with overlapping waves creating an ascending consolidation. Last week's review already flagged the momentum divergence and quantitative model top signal at wave 45, which led to a sharp decline from $64.75 to $56.30 (a 13.05% drop), confirming the high-risk environment.
Now, the breakout leg 46–47 shows clear weakening momentum compared to the entering leg 42–43, forming a potential bearish divergence. Moreover, our proprietary "spread trading model" has triggered a strong top warning (red dot + white dot) at wave 47. If the divergence is confirmed and the price later breaks below the $62.5–$64.57 support area, wave 47 will likely mark the end of the rally that began on May 14. This would lead to a larger-degree correction (e.g., daily level), with an initial downside target of $54–$56.3.
Weekly Trading Strategy and Short-Term Review
For Bitcoin, the short-term plan favors "shorting rallies." Two predefined plans (A & B) are in place: Plan A opens a short position of up to 30% if the price rebounds to the $75,000–$76,000 zone and encounters resistance confirmed by the model's top signal, with a stop-loss above $77,000. Plan B enters a short if the price breaks below the $69,500–$70,500 support, with a stop-loss above $72,000. Both plans aim to take profit near key support levels. For HYPE, the strategy is "buying dips and avoiding chasing highs." Watch for the $62.5–$64.75 area; if a stabilization signal appears and the models flash a bottom resonance, a light long position (≤30%) may be considered. A breakdown would signal a transition to a larger-degree correction.
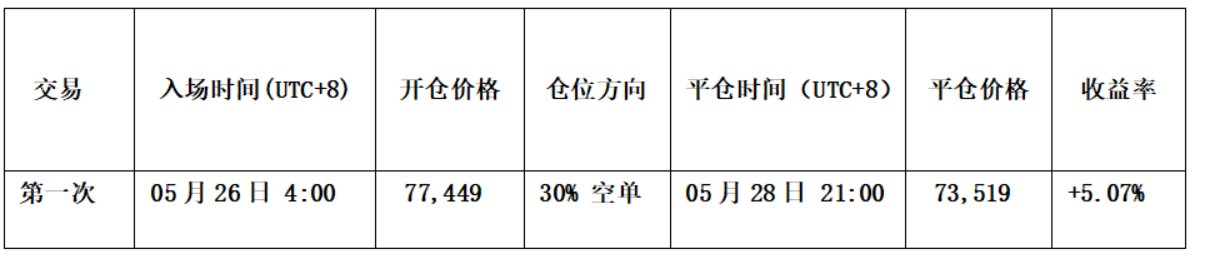
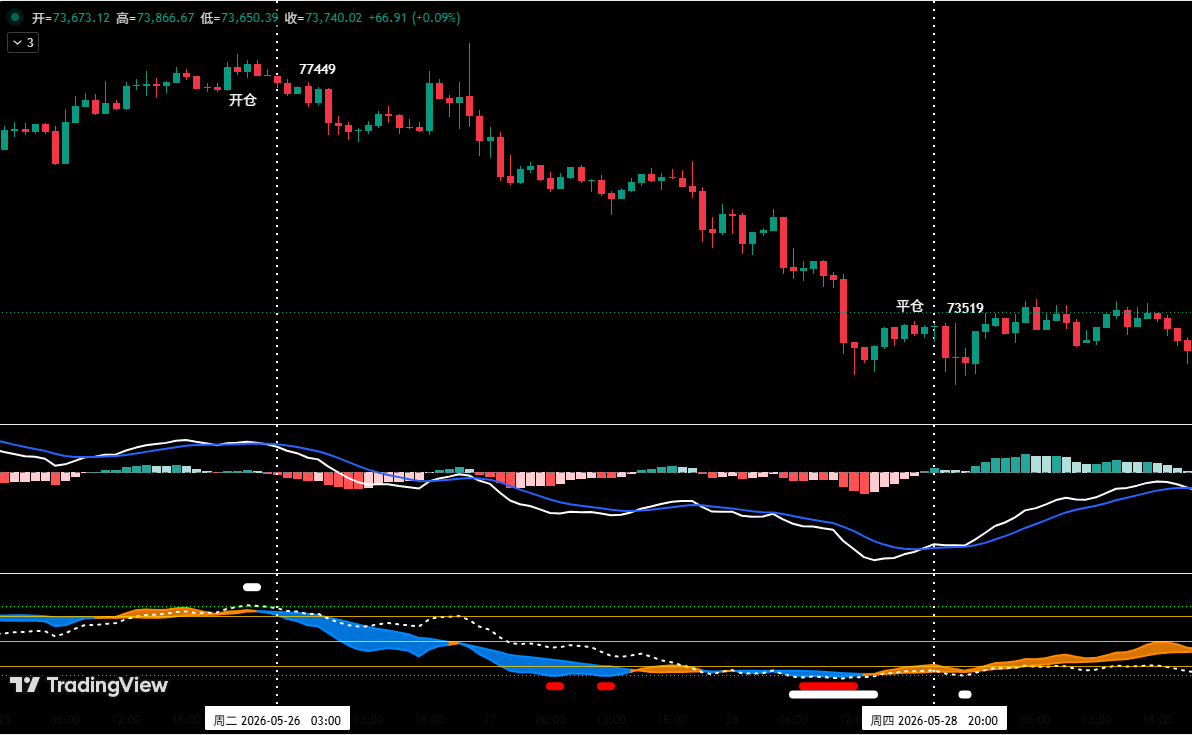
Last week, a successful short trade was executed: based on the spread model's white-dot top signal and the momentum divergence signal, a 30% short was opened at $77,449. When the price dropped to near $73,000 and formed a bottom reversal pattern, combined with a strong bottom resonance (red + white dots) from the models, the entire position was closed at $73,519, yielding a profit of approximately 5.07%. The trade strictly followed the plan for entry, moving stop-loss, and partial profit-taking.
Risk Control and Discipline
All positions must be immediately protected with an initial stop-loss. After a 1% gain, move the stop to breakeven; thereafter, for every additional 1% profit, trail the stop by a corresponding 1% to lock in gains. Financial markets are fast-changing. This analysis is based solely on personal technical models and serves as a trading journal, not as investment advice. Trade with caution.