On the macro front, marginal shifts in Federal Reserve policy expectations continue to steer the pricing of risk assets, and the crypto market is seeing concentrated divergence between bulls and bears at critical price levels following recent consolidation. This weekly review employs a multi-timeframe structure analysis framework combined with quantitative model signals to assess BTC and HYPE for the week ahead, and outlines concrete short-to-medium-term trading plans. It should be emphasized that all content is personal technical analysis and not investment advice; market risks must be managed independently.
BTC: 4-Hour Structure Backtest Confirmation, Support Levels Under Threat
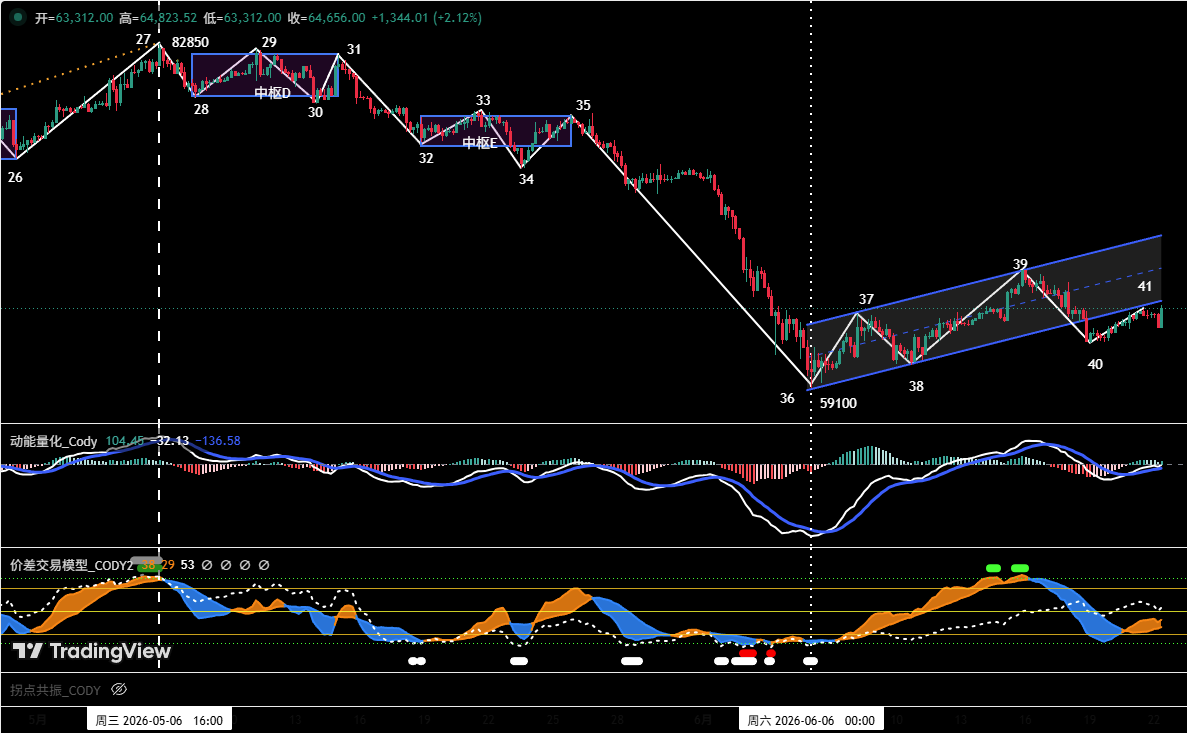
On the 4-hour chart, BTC’s rebound from the June 5 low of $59,100 can be subdivided into a five-wave structure. A short-term rising channel has formed, with its upper trendline connecting peaks 37 and 39, while the lower trendline connects troughs 36 and 38. Price has already broken below the lower channel rail at wave 40, and the current 40-41 rally is a backtest of that breakdown. If wave 41 fails to hold above the channel rail, the probability of a retest of the $59,100 support increases significantly. Key support lies at $59,000–$60,000, with secondary support near $55,000.
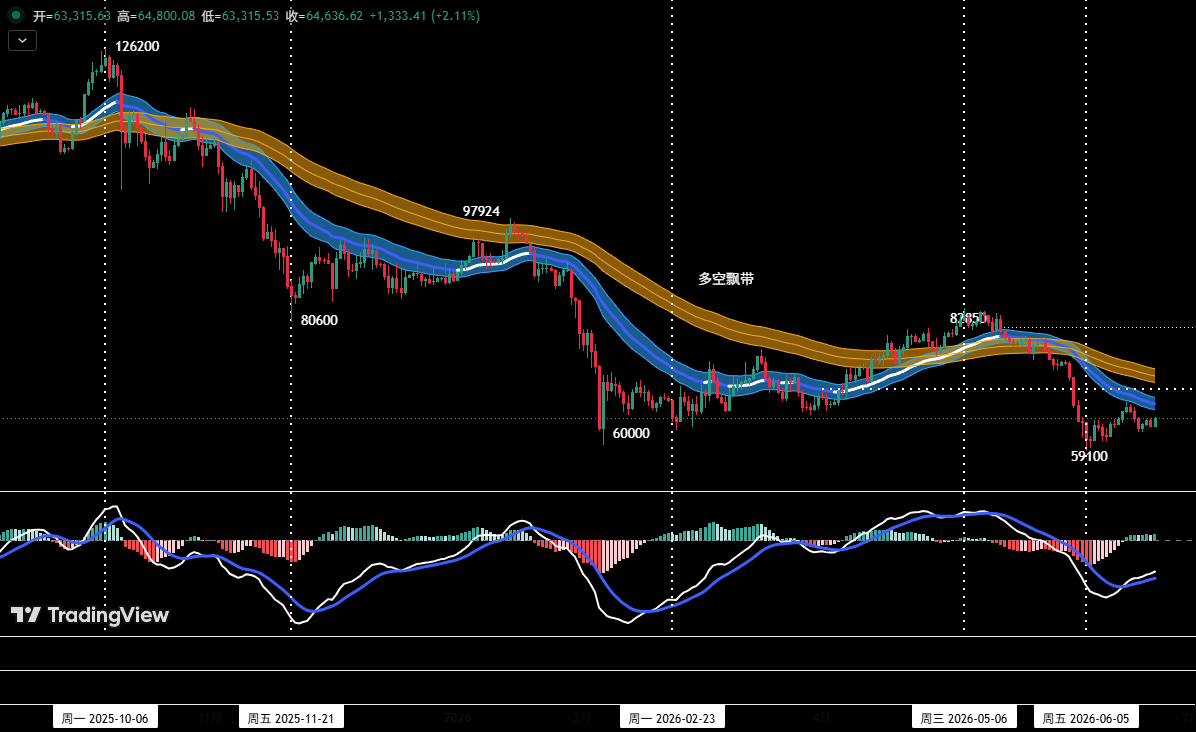
Regarding trading, the position monitoring model indicates price has decisively breached the “bull-bear channel,” confirming a bearish dominance shift. Short positions were initiated last week near $64,500 with initial midline exposure of about 20% of total capital, with strict stop-loss discipline awaiting additional entries. For short-term moves, 30% capital is allocated for spread trades based on support and resistance levels, using 30-minute/60-minute timeframes. Three specific contingency plans (A/B/C) have been pre-drafted to respond dynamically to market complexity.

HYPE: Three-Wave Correction, Key Support Zone Remains
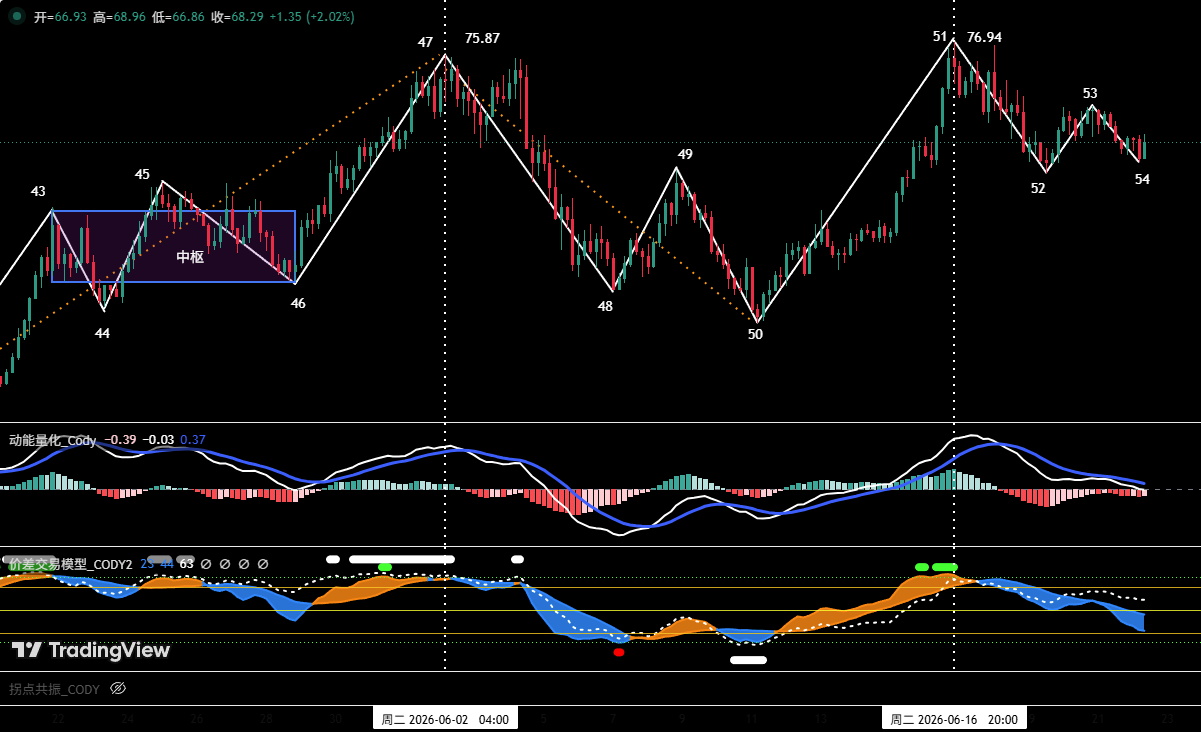
On the 4-hour timeframe, HYPE began correcting from its June 2 high of $75.87 and found support at $52.62 on June 10 after about nine trading days. A strong bullish wave then pushed price to a new high of $76.94 in just six sessions, demonstrating robust upward momentum. The subsequent decline has unfolded as a clear three-wave correction (51-52, 52-53, 53-54), bringing price back to the critical support zone of $64–$66.

Key resistance levels are around $77 and the $80–$82 region. In terms of operation, if HYPE retests the $64–$66 zone or deeper support at $52–$54 and shows signs of stabilization, combined with bottom signals from two models, a light long entry could be considered with position size strictly under 30% and strict stop-loss discipline. Financial markets change rapidly; all analysis requires dynamic adjustment and should not be followed blindly.