

Bitcoin leverage on exchanges has entered one of its most extreme historical zones, according to a July 15 note from CryptoQuant analyst Crazzyblockk, who argued that deleveraging is no longer a matter of probability but a mathematical necessity. The call came with BTC trading near $60,000 after sliding from a record high of about $126,000 reached in October last year, a drop of nearly 50% over roughly six months, even as on-chain data showed leverage had not shrunk alongside price.
Leverage pulse points to an overheated market
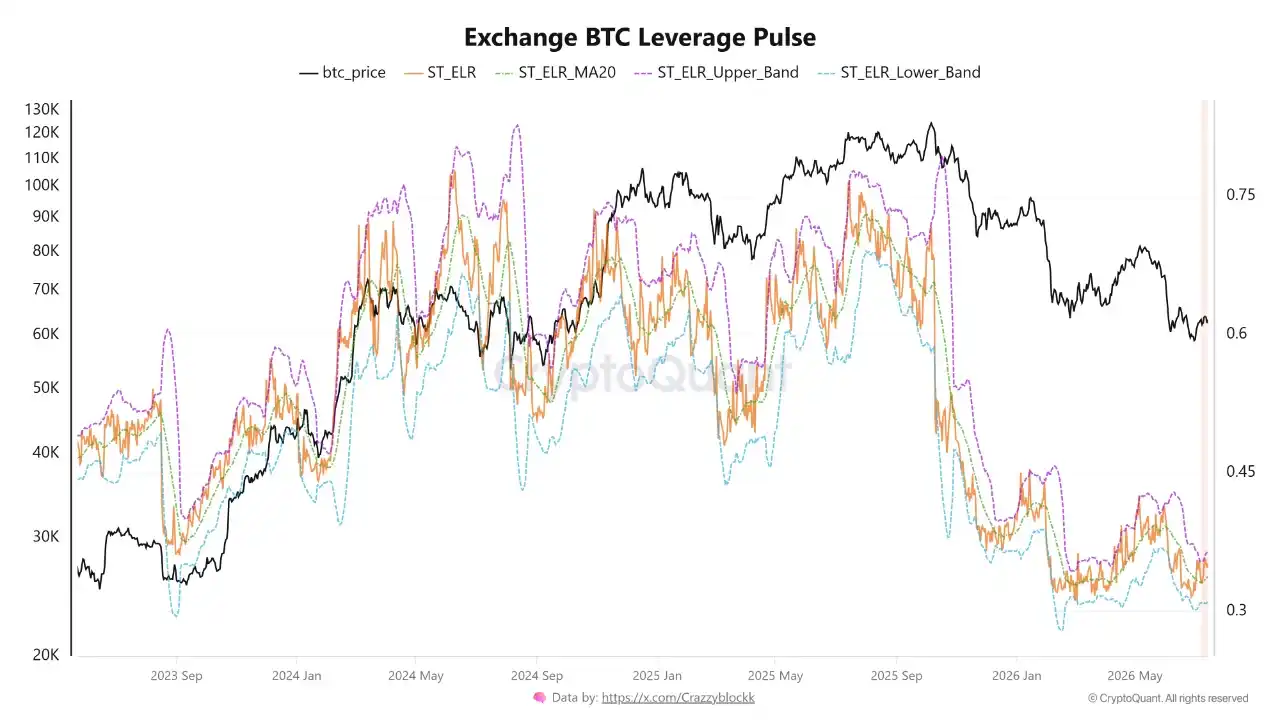
The key metric in Crazzyblockk’s analysis is the Exchange BTC Leverage Pulse, a ratio that divides exchange open interest by exchange stablecoin reserves.
Open interest reflects the total size of leveraged positions already deployed in the market. Stablecoin reserves, by contrast, represent the pool of capital on exchanges that can be used to buy spot BTC or absorb selling pressure. When the ratio rises too far, it shows that borrowed money in the system is growing much faster than the spot liquidity available to catch a sell-off.
Crazzyblockk said the indicator recently broke above its historical upper risk threshold and was still sitting far above its long-term average when he published the note. In his view, the current rebound has been built on borrowed margin without enough spot liquidity underneath it, leaving traders, as he put it, “running on fumes.”
Charts shared in the analysis show that in both 2024 and 2025, BTC suffered sharp pullbacks after the indicator repeatedly pushed into its upper band. During the sell-off from October 2025 into early 2026, the metric fell from elevated levels to near its lower band as BTC dropped from $126,000 to $60,000.
A bullish surface, a fragile foundation
Crazzyblockk said this leverage structure creates a dangerous psychological trap. Rising prices can make the market look risk-on and pull retail traders into new long positions, but the stablecoin base underneath remains too thin. That imbalance can become the trigger for a fast unwind.
He said market makers and institutional capital can see the same top-heavy order-book structure. When leverage is stretched well above normal and capital support is missing, price tends to correct lower and liquidate those extended positions.
His advice was blunt: cut leveraged positions, protect spot holdings, and wait for the leverage indicator to cool before looking for a new entry. “Don’t become someone else’s exit liquidity.”
U.S. spot BTC ETFs posted a record monthly outflow in June
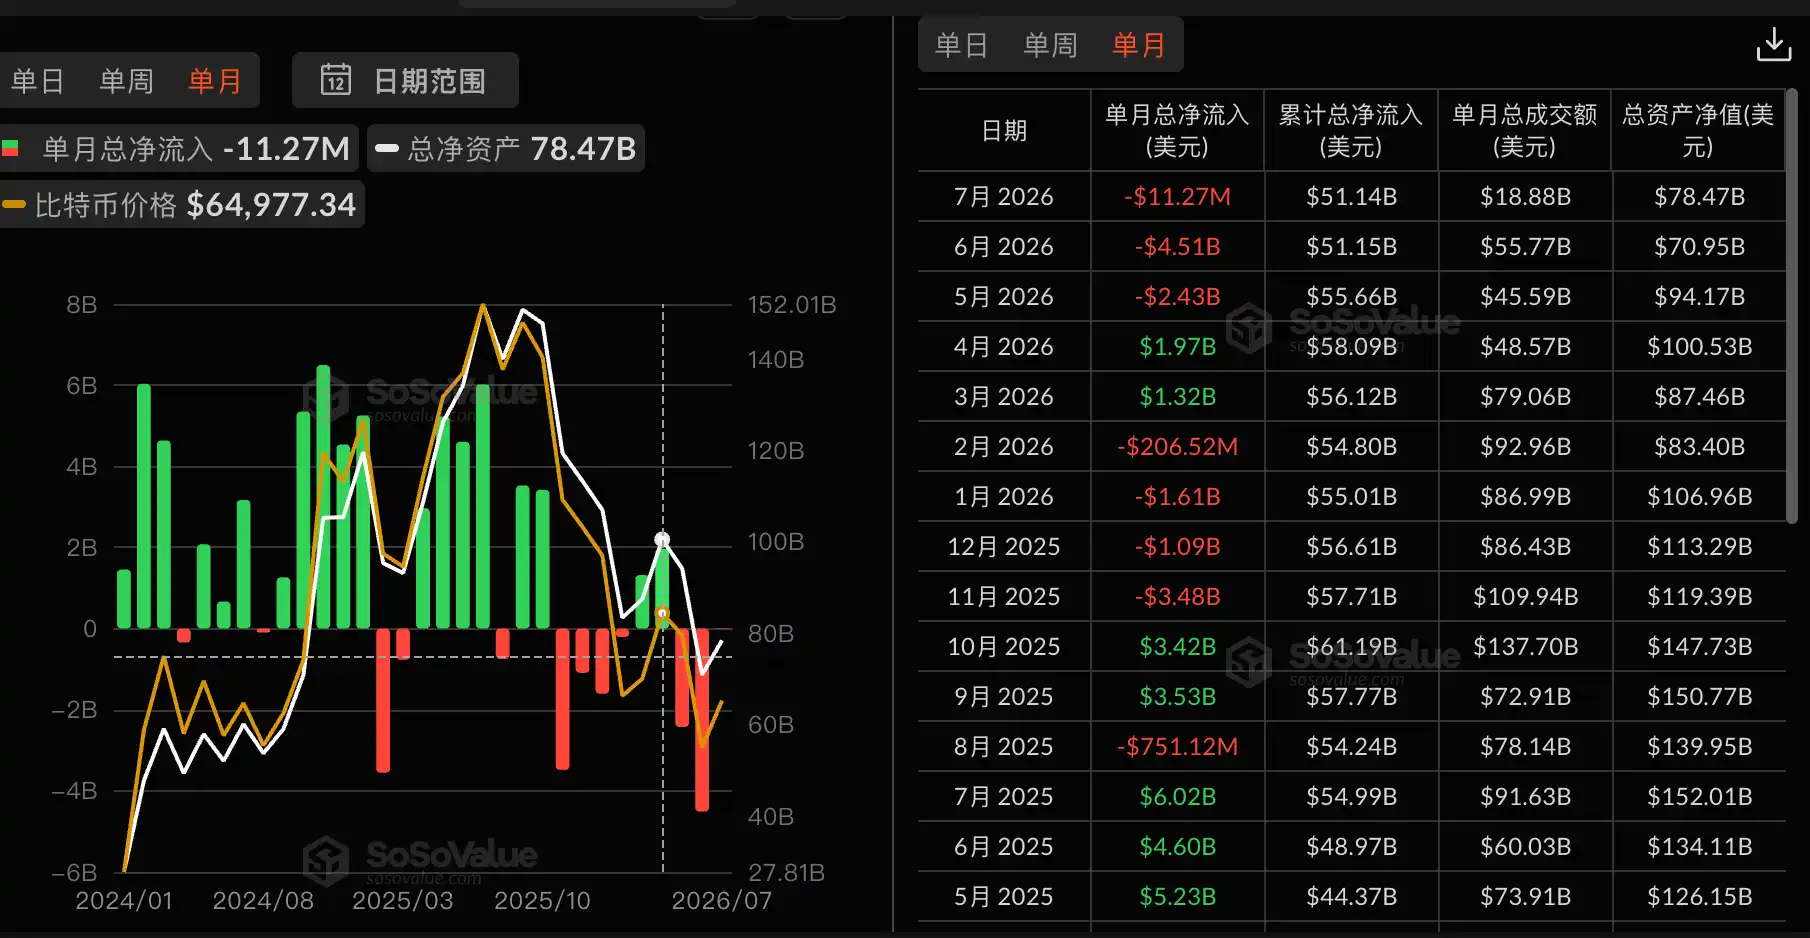
The leverage signal was not presented as a standalone warning. The article notes that U.S. spot Bitcoin ETFs recorded their largest monthly outflow since launch in January 2024, with $4.51 billion leaving in June 2026 alone.
That stretch of withdrawals lasted for eight straight weeks and totaled more than $8.2 billion before briefly pausing in early July. From July 2 to July 6, the funds logged net inflows of $510 million across three trading days, including a single-day contribution of $209 million from BlackRock’s IBIT. Even so, the article described the rebound as small relative to about $5.4 billion in net outflows for the year to date.
The pressure from ETF outflows comes from the mechanics behind them. When institutional investors redeem ETF shares, authorized participants have to sell the underlying BTC in the spot market to raise cash. Research cited in the article estimates that ETF flows now explain about 45% of weekly BTC price moves. In that framework, sustained redemptions are not just a sentiment signal; they become rule-based selling pressure in the underlying market.
Glassnode data cited in the piece put the average entry price for spot BTC ETF buyers at around $83,800. With BTC trading near $64,000, the typical ETF holder is sitting on an unrealized loss of more than 23%. Investors in that position are more likely to sell into rebounds than add exposure, which in turn limits the market’s ability to attract fresh inflows.
Derivatives are recovering faster than spot
A July 9 analysis from Crypto Times said BTC leverage rebounded quickly from a June 30 low of 0.156 to 0.25, the highest level in the observed period. Derivatives conditions also looked firmer, with open interest no longer falling and funding rates turning positive, pointing to a mild long bias.
Spot demand has not kept pace. Stablecoin inflows and ETF flows remain below levels seen in earlier bull-market phases, leaving the market more exposed to volatility shocks.
That lines up with a structural concern Crazzyblockk had already flagged in late May. Based on Binance trading data, he said derivatives accounted for 88.65% of BTC trading while spot had shrunk to less than 15%. In a market with such thin spot liquidity, even relatively modest spot selling can set off liquidation chains and amplify price swings.
Fed meeting on July 28-29 is the next major variable
The article says BTC is now boxed in near $60,000 between a clearly defined floor and a falling resistance line. Support is placed around $58,000, while resistance sits near $63,800. Until the Federal Reserve’s July 28-29 meeting forces a directional choice, the expected path is for range-bound trading with a weak bias.
Markets are assigning about a 70% probability to no rate change on July 29, while tail risk points more to a hike than a cut. Under that kind of monetary setup, the article says, BTC as a high-beta risk asset is left with little room to breathe.
Near a bottom is not the same as at a bottom
There is, however, a more constructive reference point in another CryptoQuant data series. BTC’s realized profit and loss ratio has fallen to -0.35, its lowest level since the FTX collapse in December 2022. Similar readings marked cycle bottoms in 2022, 2019 and 2015, according to the article.
Bitwise Chief Investment Officer Matt Hougan was also cited as saying that the June 25 plunge had already flushed out excess leverage and that the market was getting close to a bottom.
The article’s central point, though, is that “close to a bottom” and “at the bottom” are not the same thing. Crazzyblockk’s leverage pulse suggests the market may still need one more violent reset before the indicator can move back toward balance. For traders still holding exposure, that leaves open the risk that any rebound before leverage cools is only a temporary appearance.