

Crypto’s rebound in 2026 has brought money back faster than it has brought users back.
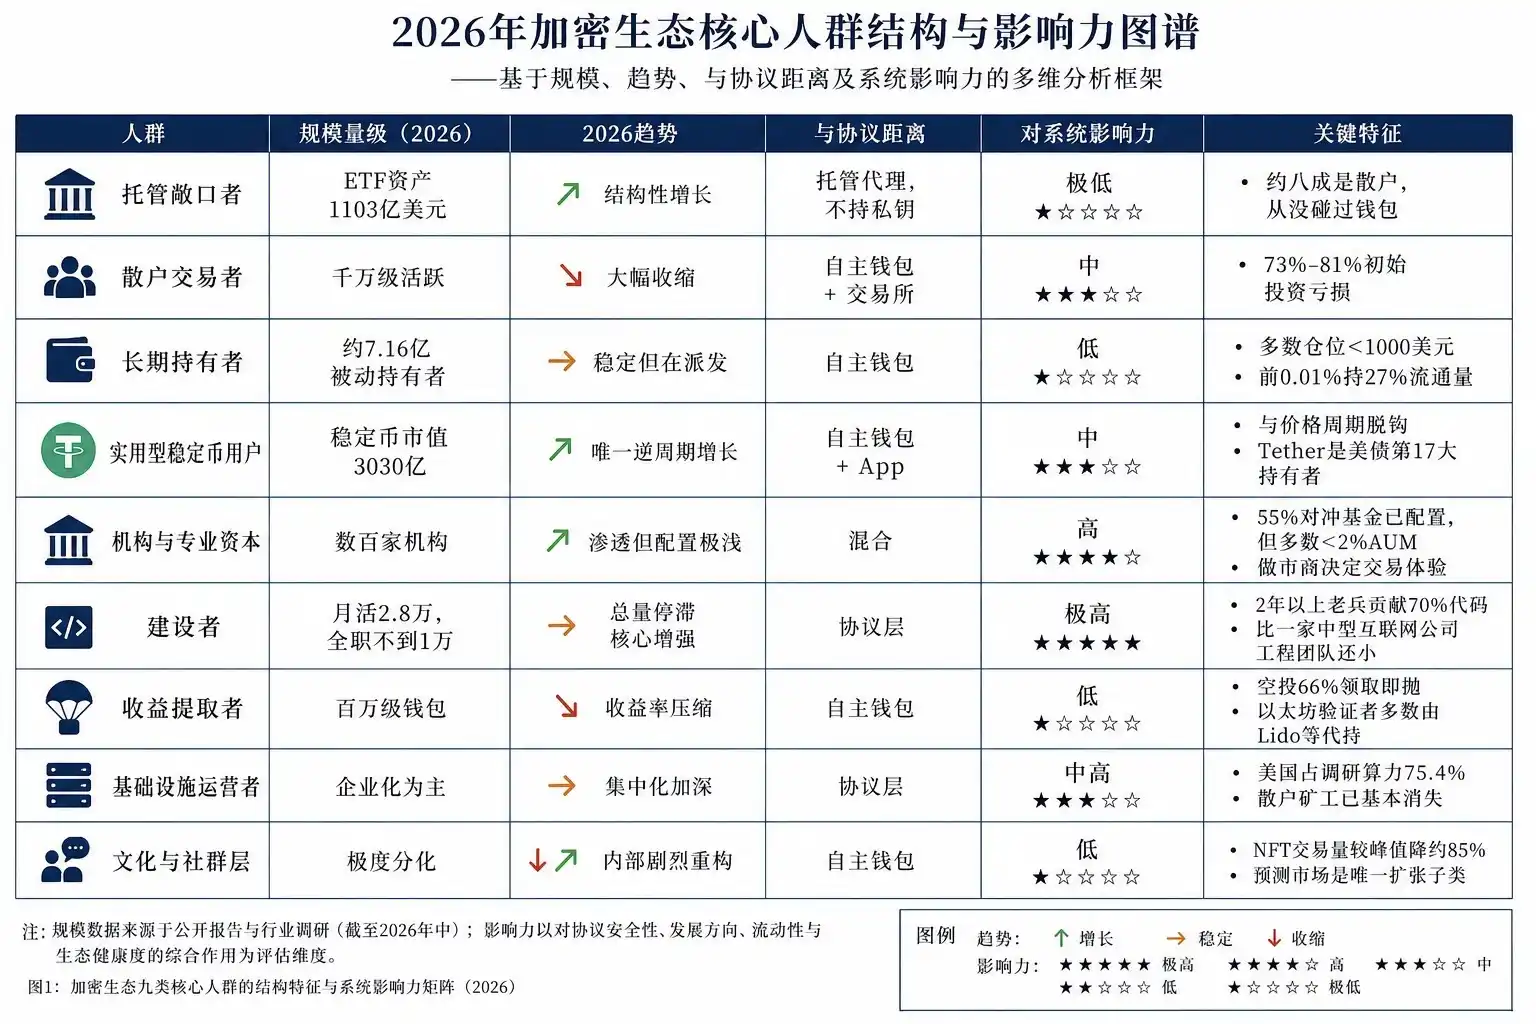
In a commentary published by MarsBit, author 富贵 argues that the industry is undergoing four population shifts that explain the gap. The piece opens with Aug. 19, when the U.S. Treasury doubled the cap on long-bond buybacks. The 30-year Treasury yield fell from 5.31 to 5.18, and Bitcoin followed with three sharp green candles, rising from 64,000 to 78,000 in a matter of days, a gain of about 20%.
Capital returned quickly. In the third week of August, U.S. spot Bitcoin and Ether exchange-traded funds recorded $2.61 billion in net inflows, their strongest week since last October. Total assets in Bitcoin ETFs recovered to $96 billion, while Ether ETFs stood at $14.3 billion.
Users, in the sense the article cares about, did not return at the same pace. Global monthly active on-chain addresses were down 18% year over year during the same period, while passive holders were up 16%. The article defines “people” not as buy-and-hold owners, but as active participants: developers, traders, and governance voters. More people are holding crypto assets, fewer are actually using blockchain networks. Monthly active open-source developers across the sector have fallen to about 28,000 from a 2022 peak of 45,000.
The commentary frames that disconnect as a broader change in what crypto is for. The slogan of the last cycle was decentralization. In this cycle, it is compliance. Last cycle participants talked about private keys and seed phrases. This time they talk about ETFs. The old claim was that blockchain could change the world. The newer one is that it only needs to improve a balance sheet.
From there, the article lays out four migrations that, in its view, define crypto in 2026.
First shift: from self-custody to custodial exposure
In the previous bull market, a new entrant often began by downloading MetaMask, writing down 12 seed words, and storing them offline. “Not your keys, not your coins” was not just a saying but an operating belief.
In this cycle, the first step is more likely to be opening a brokerage account, searching for IBIT, and clicking buy. These buyers have never generated a private key, may not know what a gas fee is, and have never signed a transaction on-chain. They bought Bitcoin without touching a wallet.
U.S. spot crypto ETFs now hold $110.3 billion in assets, including $96.07 billion in Bitcoin ETFs. The largest single product is BlackRock’s IBIT, which accounts for about half of the category. The article points to the holder mix as the crucial detail: about 20% of the money comes from institutions that file 13F disclosures, while roughly 80% comes from retail investors and smaller accounts that do not have to report. In other words, most ETF holders are ordinary investors, not just large Wall Street firms.
That group is effectively invisible in on-chain data. Their purchases do not create blockchain addresses, consume gas, or show up in governance activity. The article says this is the central contradiction of 2026: holder counts can rise while active addresses fall.
It cites a Bitwise survey of 299 financial advisers. In 2025, 32% said they allocated crypto for clients, up from 22% in 2024. Even so, about half said only 5% or less of their client base actually holds crypto. Advisers are learning. Clients are still watching. Only a minority is taking action.
The commentary argues that crypto has, for the first time, developed a relatively stable holder class during a bear market. These investors do not watch candlesticks closely and do not care much about decentralization. They treat crypto as a small sleeve inside a broader asset allocation. As a result, the number of people with exposure and the number of people active on-chain have started to separate in a more lasting way.
Second shift: from leveraged speculation to limited-risk exposure
The article treats Oct. 10, 2025 as the dividing line for this cycle’s user reshuffle. More than $19 billion in leveraged crypto positions were liquidated in a single day, the largest forced liquidation event on record. A macro shock started the move, but crypto’s own market structure amplified it. Under unified margin systems, entire portfolios were tied to the weakest asset, and some exchange interfaces froze, leaving traders unable to exit cleanly.
According to the article’s summary of a later review by FTI Consulting, Bitcoin order-book depth across major venues shrank by more than 90%, while bid-ask spreads widened from single-digit basis points to double-digit percentages. USDe was one of the starkest examples. The delta-neutral stablecoin traded at $0.60 on Binance at one point, a 35% discount, while other exchanges remained close to $1. Because many leveraged products marked collateral using the local spot price on the same venue, margin engines marked down collateral values and pushed accounts that were still fundamentally solvent below maintenance thresholds.
Two months later, open interest was down more than 40% from the October peak, and millions of accounts had been closed. Systemwide leverage had compressed to roughly 3% of total crypto market capitalization. At the same time, Bitcoin options open interest overtook perpetual futures for the first time, and positioning shifted toward more defensive structures. The market moved from directional bets to capped-risk exposure.
The article is explicit on what that does and does not mean. It does not say retail traders suddenly became disciplined. It says the less disciplined cohort was removed.
To support that point, the piece cites Bank for International Settlements research across 95 countries, which found that 73% to 81% of retail investors lose money on their initial investment. The direction of cause and effect, as the article presents it, is straightforward: rising prices pull users in, and when retail buyers chase that move, the largest holders are often selling into it. About 40% of new users were men under 35, the age and gender segment described as having the strongest risk-seeking tendency.
The rise and fall of the memecoin cohort tells a similar story. More than 13 million memecoins were issued over the past year. Solidus Labs analyzed more than 7 million pump.fun tokens and found that 98.6% to 98.7% displayed pump-and-dump characteristics. Fewer than 2% graduated to Raydium. By September 2025, memecoin issuance had fallen 56% from January levels.
Speculators are still around, the article says, but in smaller numbers than in recent years. The Altcoin Season Index was at 39 out of 100, and the Fear and Greed Index stood at a neutral 53. Those are presented as signs of a market that has already seen a retreat.
Third shift: from speculative asset to payment tool
One market segment held its ground even as prices were cut sharply: stablecoins. Their total market capitalization was about $303 billion. USDT accounted for about $183 billion, and USDC was in a range of roughly $72 billion to $73.7 billion. Together they made up about 84% of the total. While Bitcoin fell from $126,000 to a level just above $60,000, stablecoin supply stayed near its highs.
The article describes stablecoin users as the only major cohort detached from the price cycle. They use stablecoins as tools rather than as investments. Their reasons are practical: getting access to dollars, sending money across borders, defending themselves against local currency depreciation, or receiving wages. Many of them are not tracking charts, participating in governance, or even thinking of themselves as Web3 users. They are simply using a dollar account that happens to run on blockchain rails.
The piece cites research by Castle Island and Brevan Howard covering 2,541 users in Brazil, India, Indonesia, Nigeria, and Turkey. Among respondents, 47% said they used stablecoins for dollar savings, 43% to convert local currency into dollars, and 43% to secure better foreign-exchange rates. A majority, 55%, said stablecoins represented more than 10% of their assets. Nigeria stood out. There, 77% of respondents said more than 10% of their assets were held in stablecoins. BVNK’s 2026 data showed 59% of active crypto adults in Nigeria hold USDT, the highest share globally.
Regional growth patterns support the same thesis. Chainalysis data showed on-chain value in Asia-Pacific rose 69% year over year to $2.36 trillion, the fastest pace worldwide. Latin America was up 63%, and Sub-Saharan Africa 52%. In the top 10 of the adoption index, every country except the U.S. was a low- or middle-income country. In Brazil, stablecoins accounted for as much as 90% of on-chain crypto activity. The World Bank’s estimate of average global remittance costs, 6.36%, is more than double the United Nations target of 3%, giving stablecoins a direct economic rationale in those corridors.
The article also warns against equating stablecoin growth with pure utility growth. The same tool serves both lawful payments and illicit transfers. Chainalysis data showed stablecoins accounted for 84% of illicit transaction volume, up from 63% in 2024. In the article’s telling, the migration of criminal funds from Bitcoin to stablecoins is already complete.
It goes further and places stablecoins in a macro context. As of March 2026, Tether held about $141 billion in direct and indirect U.S. Treasury exposure, including $122 billion in directly held short-dated Treasuries. The article says that made Tether the world’s 17th-largest holder of U.S. government debt, ahead of Germany, the UAE, and South Korea. A BIS working paper is cited to argue that stablecoin reserves concentrated in Treasuries create a direct channel through which global demand for private digital dollar claims is converted into demand for U.S. sovereign debt, reinforcing the dollar’s structural role in the international monetary system.
By that reading, stablecoins are no longer just trading instruments inside crypto. They have become meaningful buyers in the Treasury market and a vehicle for dollarization in emerging economies.
Fourth shift: from humans to machines
The fourth migration is the one the article treats as the most conceptually disruptive. Raw annual stablecoin transaction volume is put at $46 trillion. After removing bots and automated addresses, “real economic” transaction volume falls to just $9 trillion. That leaves roughly 80% of on-chain activity attributable to non-human or heavily automated behavior.
Visa Onchain Analytics adjusts the data by excluding internal exchange transfers, MEV bots, and high-frequency addresses that execute more than 1,000 transactions per month or move more than $10 million. On that basis, only one-fifth of the original total remains.
Sybil activity is another reason address counts cannot be read as user counts. LayerZero excluded 803,093 suspected sybil addresses in one airdrop process. zkSync had about 6 million unique addresses on-chain, but only 695,000 wallets qualified under stricter standards, for a pass rate of about 11.6%. In the article’s framing, one real person controlling dozens, hundreds, or even thousands of addresses is a routine feature of the sector.
AI is accelerating the same trend. Chainalysis data showed scam operations linked to AI vendors extracted an average of $3.2 million, or 4.5 times as much as non-AI operations. Median daily revenue rose from $518 to $4,838, and average daily transfers climbed from 3.89 to 35.1. GitHub Octoverse 2025 showed AI-generated or AI-assisted code made up more than 40% of code on the platform for the first time.
The payments layer for agents is already being built. Coinbase open-sourced the x402 protocol and formed the x402 Foundation with Cloudflare. Google Cloud and Coinbase also introduced AP2, or Agent Payments Protocol. Even so, the article notes that there is still no authoritative public count for AI-agent developers or for on-chain volume initiated by AI agents. It describes this as an unmeasured new cohort: the infrastructure is ready, but the population has not yet been quantified.
If bots remain the dominant source of on-chain activity, the article argues, then any user metric derived from addresses, transaction counts, or TVL stops being a demographic measure in the usual sense. Crypto would then be the first financial system in which humans are no longer the main behavioral actors.
Scale and power move in opposite directions
Looking across all four shifts, the article reaches a conclusion that it calls counterintuitive: the largest groups are not the most powerful ones. Some 716 million holders do not vote or build. Fewer than 10,000 developers steer protocol evolution. A few dozen market makers were enough to help order-book depth vanish by 90% during the October liquidation event. In terms of people and governance, the piece argues, crypto is no less concentrated than traditional finance. The center of concentration is simply different. Power does not sit with regulators and banks, but with developers, market makers, whales, and governance delegates, most of them numbering only in the low thousands.
The article lists several measures of that concentration. The top 0.01% of entities hold 27% of BTC circulation. DAO governance has a Gini coefficient of 0.998 and a Nakamoto coefficient of 8. In NFTs, the top 10% of traders account for 85% of trades. MEV profits totaling $540 million are concentrated in 11,289 addresses. The top three ETF issuers control 89% of that market. Developers with more than two years in the field contribute 70% of code commits. On the article’s reading, decentralization has never truly been realized at the human layer.
Who disappeared and who stayed
Two absences stand out in the 2026 map drawn by the article.
The first is P2E digital labor. Axie Infinity once reached about 2.7 million daily active users, and in August 2021 the Philippines was its largest player market. Hundreds of thousands of Southeast Asian households at one point treated play-to-earn as a primary source of income. By the second quarter of 2025, however, wallet counts across the Web3 gaming category had fallen 17% quarter over quarter. The article treats that community as effectively dissolved.
The second is NFT collectors. Annual NFT trading volume in 2021 topped $23 billion. By the second quarter of 2025, quarterly volume had dropped to $867 million, which the article says implies an annualized decline of about 85% from the peak. Academic research cited in the piece says the market was concentrated from the start: 10% of participants carried out 85% of trades, and 75% of assets sold for less than $15.
Airdrop hunters are changing too. As projects move toward points systems and pre-token screening, using long-term off-chain behavior rather than one-time snapshots, the cost of sybil farming rises. The article says this has effectively turned a one-off arbitrage game into a low-paid job that requires continued labor.
The broader rule, as the piece frames it, is that crowds manufactured by token incentives rarely outlast the incentive itself. Groups formed around genuine need are more durable, even when prices are cut in half.
It offers stablecoin users and veteran developers as the clearest examples. Stablecoin users need dollars, not upside. Developers with more than two years of experience were up 27% year over year and contributed 70% of code commits, while the people leaving were more often part-time or one-off contributors. Among institutions, a split has appeared as well: banks and long-term allocators added on weakness, while hedge funds pulled back. The divide between trading institutions and allocation institutions is presented as the central institutional fault line of 2026.
The article says distinguishing between those two categories is the most important test when evaluating any crypto project’s claimed user base.
The industry’s costs
The commentary closes the loop by arguing that growth cannot be measured without counting harm. Chainalysis data showed illicit addresses received at least $154 billion in 2025, up 162% year over year. Of that amount, sanctions evasion accounted for $104 billion, scams for $17 billion, and stolen funds for $3.4 billion. Stablecoins represented 84% of illicit transaction volume.
The profile of victims looks very different from the profile of voluntary participants. Active participants tend to be younger men with high confidence and higher risk tolerance. Victims are often older people who lose retirement savings to fake investment platforms or to AI-generated deepfake videos posing as their children. FBI data showed fraud losses among Americans aged 60 and older reached $7.7 billion in 2025, up 37% year over year. The article draws a blunt distinction here: the 73% to 81% retail loss rate cited by BIS still describes people who voluntarily entered a risky market. Fraud victims lose 100% because they were never investing in the first place.
It adds another category of involuntary participants. United Nations agencies estimate that at least 120,000 people in Myanmar and about 100,000 in Cambodia are confined in cyber-scam compounds, with source countries numbering more than 50. They are not crypto users in the ordinary sense, the article says, but crypto is the settlement layer for the products they are forced to produce. For that reason, the piece counts them among the direct human costs of the industry.
From a human community to capital infrastructure
The article ends where it began: the four migrations point in the same direction. Crypto is moving from a human community toward capital infrastructure. Fewer humans are participating directly. More machines are. Retail is stepping back. Institutions are stepping in. Speculation is receding. Utility is growing.
It does not present that shift as purely negative. The argument is that any industry entering maturity sheds some of its earlier fantasies. The cost, in the author’s words, is that it stops being as interesting. The old crypto world had hackers, punks, and idealists arguing that code was law. The new one has compliance officers, financial advisers, ETF product managers, and stablecoin issuers.
The central question has changed as well. It used to be whether the technology could change the world. Now it is whether the product can fit inside a portfolio. Money has come back, the article says, but what returned was capital, not believers.
Even so, it identifies two lines of real demand that still matter: stablecoin users receiving wages in places such as Nigeria, and developers still building zero-knowledge scaling. Those use cases are not especially loud, and they do not map neatly onto market hype, but the article argues they are among the few reasons the industry still has a durable claim on relevance.
Its final line of thought is open-ended. “Buy to earn” may be running out of road. “Build to earn” still has room left. And AI agents, the as-yet unmeasured “tenth category” of users, may already be on the way.