
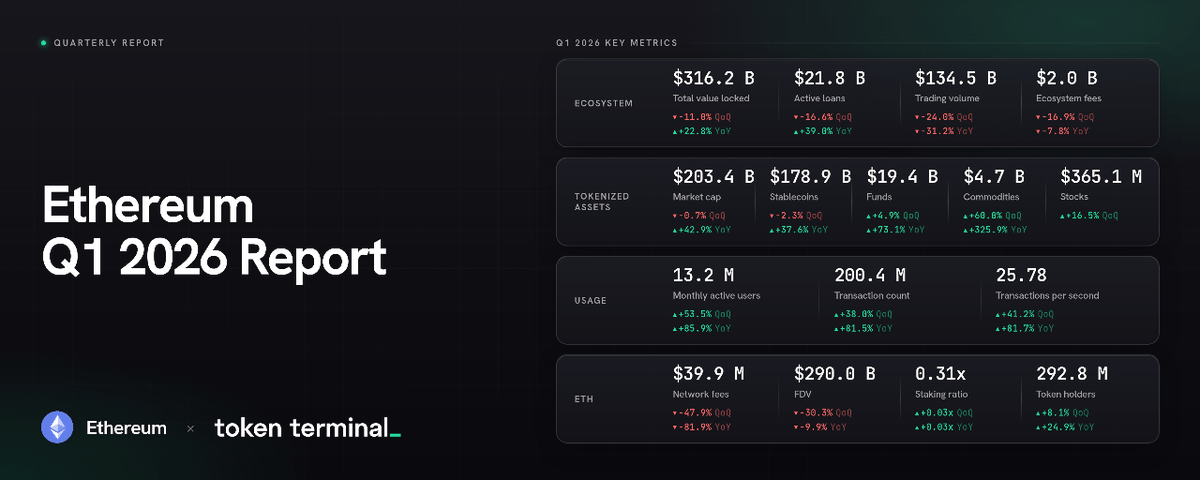
Token Terminal’s report on Ethereum for the first quarter of 2026 describes the network as the core base settlement layer for on-chain assets. ETH is used to pay transaction fees and to secure the proof-of-stake network through staking. The report frames stablecoins and tokenized assets as on-chain responses to long-standing problems in traditional finance, including slow settlement, multiple intermediaries and counterparty risk. It also states that, as regulation matured through 2025 and 2026, institutional on-chain business had the conditions needed for implementation.
The report says that multiple categories of assets are now issued and settled on Ethereum, including stablecoins, tokenized funds, commodities and on-chain stocks. Layer 2 networks route part of the transaction flow away from mainnet, but final settlement still returns to Ethereum layer 1. On a market-capitalization basis, Ethereum remains the largest global platform for tokenized assets. The Ethereum Foundation and the developer community continue to operate the ecosystem, while teams such as Etherealize work with traditional financial institutions to support institutional adoption.
Record usage, weaker dollar-denominated metrics
Ethereum’s first quarter of 2026 showed a clear divergence. On-chain usage reached all-time highs: monthly active users, total transaction count and throughput all set new records. At the same time, dollar-denominated measures declined quarter over quarter. Fully diluted market capitalization, total value locked, DEX trading volume and both fee categories all moved lower. The report links this unusual quarter to several events: in January, the second Blob-only parameter fork in the Fusaka upgrade cycle, BPO#2, went live and significantly increased data storage capacity; in February, ERC-8004 launched on mainnet as a common standard for AI agent identity and credit ratings; the Ethereum Foundation confirmed three protocol priorities for 2026, namely scaling, improving user experience and strengthening layer-1 security; and in March, an institutional Ethereum forum was held, with higher participation from traditional financial institutions.
The core quarterly figures were mixed. Ethereum ecosystem TVL averaged $316.2 billion, down 11.0% quarter over quarter but up 22.8% year over year. Active outstanding borrowing across the ecosystem averaged $21.8 billion, down 16.6% quarter over quarter and up 39.0% year over year. Total decentralized exchange volume reached $134.5 billion, down 24.0% quarter over quarter and 31.2% year over year. Total application fee revenue across the ecosystem was $2.0 billion, down 16.9% from the prior quarter and 7.8% from the same period a year earlier.
Tokenized assets were more resilient. The total market capitalization of tokenized assets on Ethereum averaged $203.4 billion, down only 0.7% quarter over quarter and up 42.9% year over year. Stablecoins accounted for $178.9 billion, tokenized funds for $19.4 billion, tokenized commodities for $4.7 billion and tokenized stocks for $365.1 million. On usage, monthly active addresses reached 13.2 million, up 53.5% quarter over quarter and 85.9% year over year. Layer-1 transaction count was 200.4 million, up 38.0% quarter over quarter and 81.5% year over year. Average throughput rose to 25.78 transactions per second, up 41.2% quarter over quarter and 81.7% year over year.
Mainnet fee revenue moved in the opposite direction. Ethereum layer-1 transaction fees totaled $39.9 million, down 47.9% quarter over quarter and 81.9% year over year. ETH’s average fully diluted market capitalization was $290.0 billion, down 30.3% quarter over quarter and 9.9% year over year. The ETH staking ratio was 0.31, up 0.03 from both the prior quarter and the year-earlier period. ETH holder addresses averaged 292.8 million, up 8.1% quarter over quarter and 24.9% year over year. Token Terminal notes that its report covers Ethereum layer 1 only; layer 2 networks are treated as independent public chains and are not included in the Ethereum statistical scope.
TVL, lending and application fees remained concentrated on Ethereum
The report defines total value locked as the dollar value of assets deposited in on-chain applications and available for users to withdraw. It is treated as a leading indicator for revenue-generating activities such as lending, trading and staking. Ethereum’s $316.2 billion in average TVL put it far ahead of the other large chains named in the report. Tron had $84.5 billion, Solana $28.8 billion, BNB Chain $10.3 billion and Plasma $5.7 billion. Ethereum accounted for 71% of total TVL across those five chains, and its TVL exceeded the combined total of the other four.
Capital remained highly concentrated in a small group of Ethereum sectors and protocols. The largest destinations were liquid staking, led by Lido, and lending, led by Aave. Restaking protocols EigenLayer and ether.fi also held substantial funds, as did the synthetic dollar stablecoin platforms Ethena and Sky. The report describes this capital concentration as one of Ethereum’s strongest structural advantages.
Active borrowing reflects the amount users have borrowed and on which interest is generated, making it a direct indicator of lending revenue. Ethereum’s average active borrowing stood at $21.8 billion in the quarter, down from the prior quarter but much higher than in the same quarter of the previous year. The market was concentrated in a few lending pools. At quarter end, Aave had about $13.5 billion in active borrowing and held most of the ecosystem share. Morpho followed with about $1.9 billion, Spark under Sky with about $1.0 billion and Maple with about $840 million.
The contraction in lending was mainly driven by Aave, according to the report. As crypto asset prices declined, borrowing demand cooled, and Aave’s lending total contracted by about 24%. Across the five-chain comparison, Ethereum’s $21.8 billion in active borrowing was far ahead of Solana’s $2.5 billion, Plasma’s $2.1 billion, BNB Chain’s $760.8 million and Avalanche’s $392.4 million. Ethereum accounted for 79.2% of active borrowing across those five chains, the highest Ethereum share among the categories covered in this part of the report.
DEX volume was the only major metric in this section where Ethereum was not in first place. Ethereum’s DEX volume totaled $134.5 billion in the first quarter, down 24% quarter over quarter and 31.2% year over year. The decline in trading volume was larger than the decline in TVL, which the report links to lower risk appetite during a period of falling asset prices. Trading flow was also concentrated. Uniswap recorded about $85.5 billion in quarterly volume, roughly two-thirds of Ethereum’s ecosystem total. Curve followed with about $22.1 billion, and CoW Swap with about $12.4 billion.
In the cross-chain comparison, BNB Chain had $162.5 billion in total DEX volume, above Ethereum’s $134.5 billion. Solana followed with $104.9 billion, while Avalanche had $14.5 billion and Polygon $10.7 billion. Ethereum accounted for 31.5% of combined volume across those five chains, behind BNB Chain’s 38%. Application fees told a different story. Ethereum applications generated $2.0 billion in total fees, ahead of Tron’s $599.3 million, Solana’s $532.5 million, BNB Chain’s $231.9 million and Polygon’s $38.8 million. Ethereum represented 58.4% of total fees across the five chains and remained the largest source of application fees in the industry by this comparison.
Tokenized assets: stablecoins, funds, commodities and stocks
The tokenized asset section counts only assets issued on Ethereum. Circulating asset market capitalization is calculated as circulating supply multiplied by the daily closing price. For stablecoins, the report uses total circulating issuance; for tokenized funds, on-chain assets under management; and for tokenized stocks, the total value of issued on-chain shares. Ethereum’s average tokenized asset market capitalization was $203.4 billion in the first quarter, almost unchanged quarter over quarter and up 42.9% year over year. Stablecoins made up 87.9% of the total, with tokenized funds, commodities and stocks sharing the rest.
Stablecoins averaged $178.9 billion on Ethereum, down 2.3% quarter over quarter and up 37.6% year over year. They were the only tokenized subcategory to decline quarter over quarter. The market was dominated by two issuers. At quarter end, Tether USDT had $94.1 billion on Ethereum and Circle USDC had $54.5 billion. Other leading products included Sky USDS at $12.4 billion, Ethena USDe at $5.9 billion and PayPal PYUSD at $2.9 billion. Ripple’s compliant stablecoin RLUSD, with $1.1 billion, was also listed among newly launched compliant stablecoins. Across the five chains in the comparison, Ethereum’s $178.9 billion stablecoin base led Tron’s $84.5 billion, Solana’s $14.5 billion, Arbitrum One’s $6.8 billion and Base’s $4.7 billion. Ethereum accounted for 61.8% of total stablecoin supply across those five chains.
Tokenized funds averaged $19.4 billion on Ethereum, up 4.9% quarter over quarter and 73.1% year over year. The report divides this market into two types. Yield-bearing on-chain dollar products were the largest, led by Sky sUSDS at about $6.4 billion and Ethena sUSDe at about $3.5 billion. Traditional finance compliant funds formed the core institutional narrative. These included BlackRock’s BUIDL, issued through Securitize, at about $1.0 billion; the WisdomTree Government Money Market Fund at about $815 million; Superstate USTB at about $620 million; and Ondo OUSG at about $320 million. Ethereum’s $19.4 billion tokenized fund market was far ahead of ZKsync Era’s $2.5 billion, BNB Chain’s $2.3 billion, Solana’s $1.3 billion and Stellar’s $1.1 billion. Ethereum represented 73% of total tokenized funds across those five chains.
Tokenized commodities were the fastest-growing category in the report. Ethereum’s average tokenized commodity market capitalization was $4.7 billion, up 60.0% quarter over quarter and 325.9% year over year. The sector was almost entirely made up of on-chain gold. Tether Gold XAUT, at about $2.6 billion, and Paxos Gold PAXG, at about $2.4 billion, together accounted for the category’s full share in the report’s description. Among the five related public chains, Ethereum’s $4.7 billion was well above Ripple’s $736.6 million, Arbitrum One’s $95.9 million, BNB Chain’s $38.4 million and Solana’s $29.8 million. Ethereum held 84% of the total, the strongest dominance among the tokenized subcategories covered.
Tokenized stocks remained the smallest category. Ethereum averaged $365.1 million in tokenized stock value in the first quarter. The category was nearly zero a year earlier and rose 16.5% quarter over quarter. The report says the market was almost entirely occupied by Ondo Finance, which issued on-chain assets tied to broad indices such as the S&P 500 and Nasdaq 100 as well as dozens of individual stocks. In the five-chain comparison, Ethereum’s $365.1 million was only modestly ahead of Solana’s $249 million, BNB Chain’s $150.5 million, Arbitrum One’s $29 million and Stellar’s $4.2 million. Ethereum accounted for 45.8% of total tokenized stocks across those chains, making it the only tokenized asset category where Ethereum did not control an absolute majority.
Scaling created lower fees while ETH ownership kept expanding
The report’s usage section focuses only on Ethereum layer-1 mainnet addresses and transactions. Monthly active users are defined as unique addresses that generated revenue-producing on-chain transactions during the month. The first-quarter average of 13.2 million monthly active users was a record high and ended several quarters of slower growth. Total transactions, defined as transactions written to the blockchain and confirmed, reached 200.4 million. Average TPS rose to 25.78. Both metrics also reached record highs, indicating that user growth translated into additional on-chain activity.
The fee figure in this section is separate from application fees. It refers only to the base network cost users paid when submitting transactions on Ethereum layer 1. The total was $39.9 million, down 47.9% quarter over quarter and 81.9% year over year. The report calls this the central data contrast of the quarter: transactions rose 38%, but total fees fell by nearly half. The core reason given is Blob scaling, which increased block storage capacity, expanded available blockspace and reduced the cost of a single transaction. When network throughput expands faster than transaction demand, the result is higher activity and lower fees.
For ETH itself, the fully diluted market capitalization is calculated as ETH price multiplied by the total supply under the current token economic model, including circulating, locked, not-yet-unlocked and to-be-issued tokens. ETH’s average fully diluted valuation was $290.0 billion, down 30.3% quarter over quarter and 9.9% year over year. This was the largest quarter-over-quarter decline among all valuation metrics in the report, and it was also described as the main factor dragging down dollar-denominated ecosystem asset values.
The staking ratio measures the value of ETH staked to secure the proof-of-stake network relative to ETH’s total market value. A ratio of 0.31 means that about 31% of ETH market value participated in staking. The first-quarter average of 0.31 was above 0.28 in both the previous quarter and the same quarter a year earlier. Even as ETH’s market value declined sharply, the share of tokens staked for network security increased. ETH holder addresses also continued to rise. The average number of independent wallet addresses holding ETH was 292.8 million, up 8.1% quarter over quarter and 24.9% year over year, marking five consecutive quarters of steady growth.
Etherealize commentary on institutions and open networks
Etherealize’s commentary focuses on the quarter’s main contradiction: Ethereum layer-1 usage reached a record while network transaction fees declined. The team says Ethereum has intentionally pursued scaling and accepted lower short-term fee revenue. Its long-term logic is that cheaper blockspace releases substantial market demand and eventually supports long-term network revenue growth. The team points to Token Terminal’s year-over-year figures — monthly active users up 85.9%, transaction count up 81.5% and throughput up 81.7% — as an example of Jevons paradox. It states that long-term growth in total network transaction demand will cover the short-term revenue loss caused by lower fees per transaction.
The commentary also compares Ethereum scaling with the semiconductor industry. When Gordon Moore proposed Moore’s law in 1975, the industry’s revenue base was limited; today, industry revenue has grown by several orders of magnitude. Etherealize says the scaling dividend on Ethereum has not been fully released. The Glamsterdam upgrade planned for the third quarter is expected, according to the source report, to raise the gas limit by more than three times. Ethereum’s long-term roadmap targets 10,000-level TPS by 2029 and a high-speed layer-1 public chain with second-level transaction finality.
The team also agrees with a view expressed by BlackRock CEO Larry Fink last December: the current stage of tokenization is comparable to the internet in 1996, when Amazon’s online book sales were only $16 million. At the time, the market generally viewed Amazon as an online bookstore surviving on the internet bubble while continuing to lose money. Jeff Bezos, however, believed the internet would reshape retail and chose to forgo short-term profit while building network effects and scale. Etherealize says Ethereum is making a similar trade-off to strengthen its position as a global financial settlement layer.
The commentary uses internet history to argue for open and permissionless networks over closed private networks. It refers to Bill Gates’s 1995 book The Road Ahead, where digital commerce was expected to rely on proprietary corporate “information highways” rather than the open internet. Microsoft’s MSN, AOL, CompuServe and Prodigy all operated closed walled gardens with millions of paying users, and France’s Minitel terminal system still had more users than the global internet at the end of 1996. Those closed systems ultimately lost. The commentary adds that major enterprises do not want to build businesses on networks controlled by competitors, and that no company can permanently match the innovation speed of an open permissionless ecosystem. It cites Linux surpassing proprietary Unix systems, the open web replacing closed corporate intranets and Wikipedia replacing Encyclopaedia Britannica.
According to Etherealize, the same pattern is now reappearing in financial infrastructure. The team says the data in the report shows that Ethereum has crossed an ecosystem threshold and holds absolute market share in core sectors. Institutions choose Ethereum for tokenized finance not because of ideology, but because liquidity, composability and mature institutional implementations are already concentrated there. The report lists Ethereum’s shares across five leading public chains: 79.2% of DeFi active borrowing, 61.8% of stablecoins, 73% of tokenized funds and 84% of tokenized commodities. Each additional category of tokenized assets adds liquidity and attracts more institutions. The commentary also says that privacy interactions, access restrictions, KYC compliance and asset-transfer controls can be implemented above Ethereum through privacy computing environments and permissioned token standards while still connecting to public liquidity.
After the quarter ended, institutional activity accelerated further. In May alone, BlackRock added two tokenized fund applications; JPMorgan issued its second Ethereum-based money market fund, JLTXX; and Fidelity International launched FILQ, a Moody’s AAA-rated dollar liquidity fund, as an ERC-20 token. In stablecoins, the Japan Blockchain Foundation’s yen stablecoin EJPY is set to deploy on Ethereum, while a consortium of 12 major European banks, including BNP Paribas, ING, UniCredit and BBVA, is preparing a compliant euro stablecoin. The commentary ends by restating a view from Etherealize’s earlier “Efficient Money” report: network fees create an intrinsic value floor for ETH, and the long-term optimistic case is that ETH, with improved monetary properties, can absorb part of the combined monetary store-of-value premium of gold and Bitcoin, which the report describes as exceeding $30 trillion.