

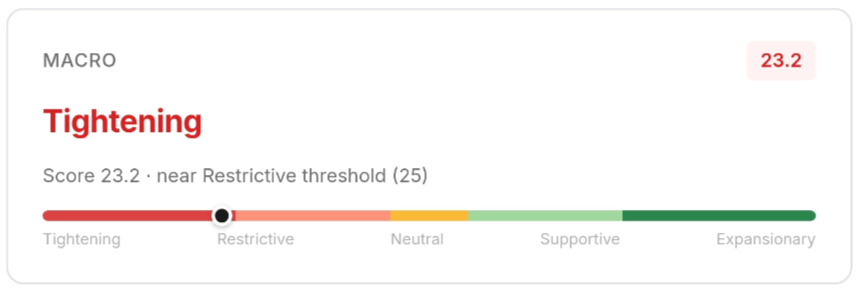
Bitcoin has broken below $60,000, and market sentiment remains subdued. The U.S. Dollar Index (DXY) has reclaimed its 200-day moving average, sitting at 101.37, up sharply from 99.24 a month ago. Bitcoin, however, has not participated in this recovery, trading at $62,651—18% below its own 200-day MA of $76,466. The macro recovery remains a stock market story driven by U.S. corporate earnings resilience; for Bitcoin, a strengthening DXY is a bearish signal.
Bitcoin at 19% Discount, Deep in Structural Bear
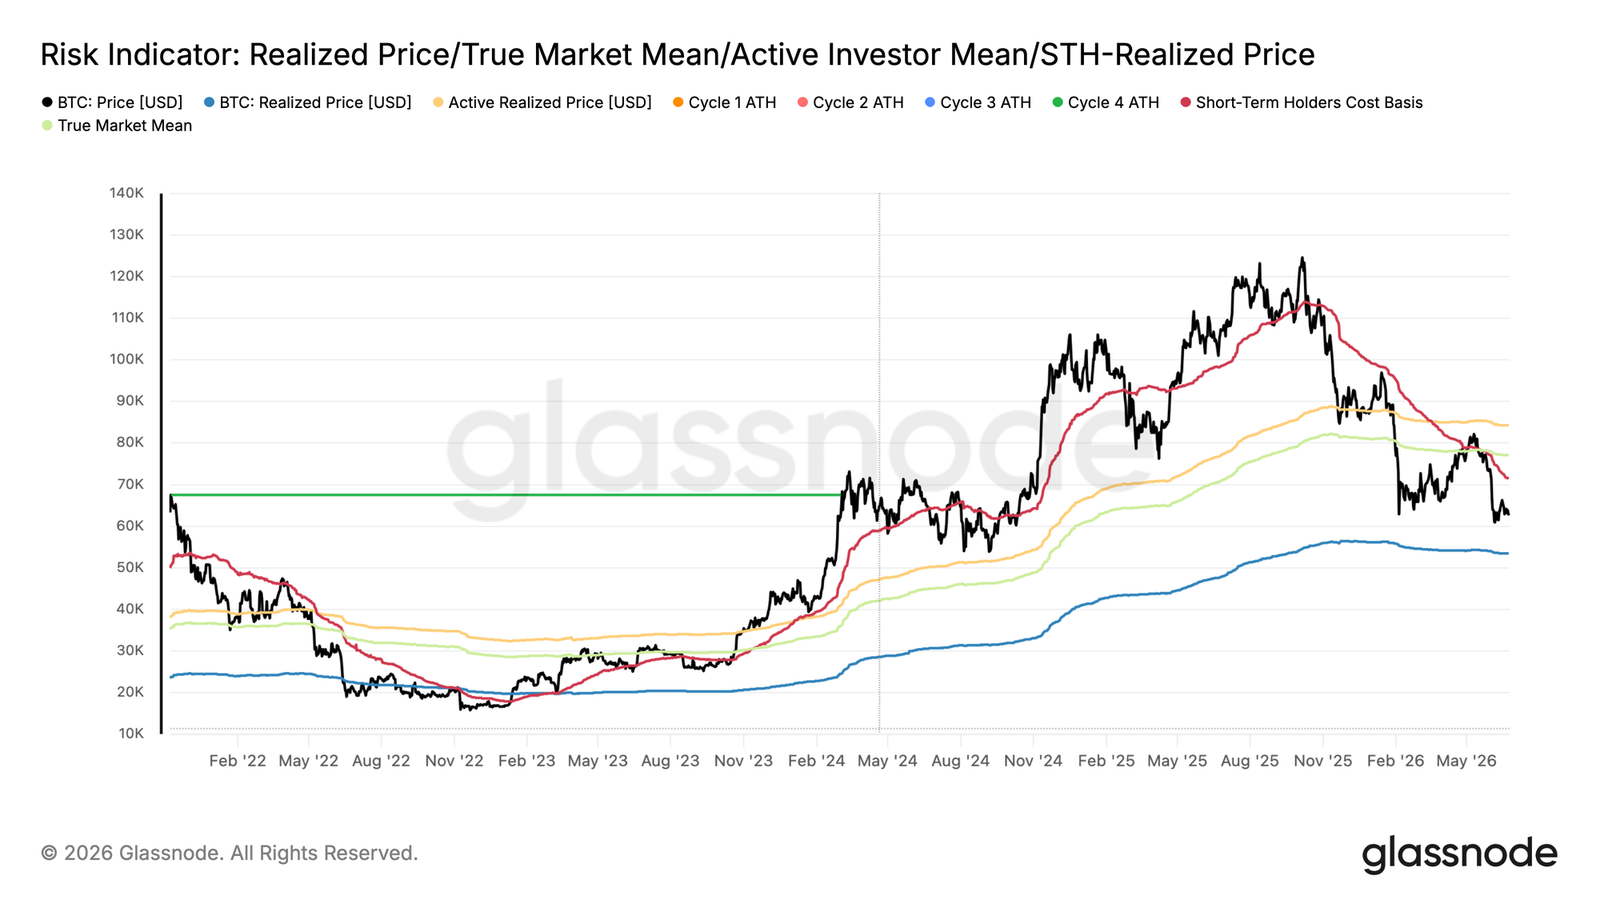
Bitcoin currently trades at $62,300, far below its True Market Mean Price (TMMP) of $77,000. The TMMP is the average cost basis of active non-miner investors and a key threshold between bull and bear markets. The current 19% discount indicates prices remain deep in a structural bear zone. The short-term holder cost basis has fallen to $71,400, reflecting heavy accumulation by new buyers below the TMMP. Cyclically, this is constructive—new capital is pricing in at levels increasingly detached from the overheated levels of the recent cycle. If a macro-driven drawdown occurs in coming weeks, the realized price of $53,400 would serve as a reasonable lower bound for the short-to-medium-term bear range.
Loss Dominance Pulls Gravity Toward Lower Bound
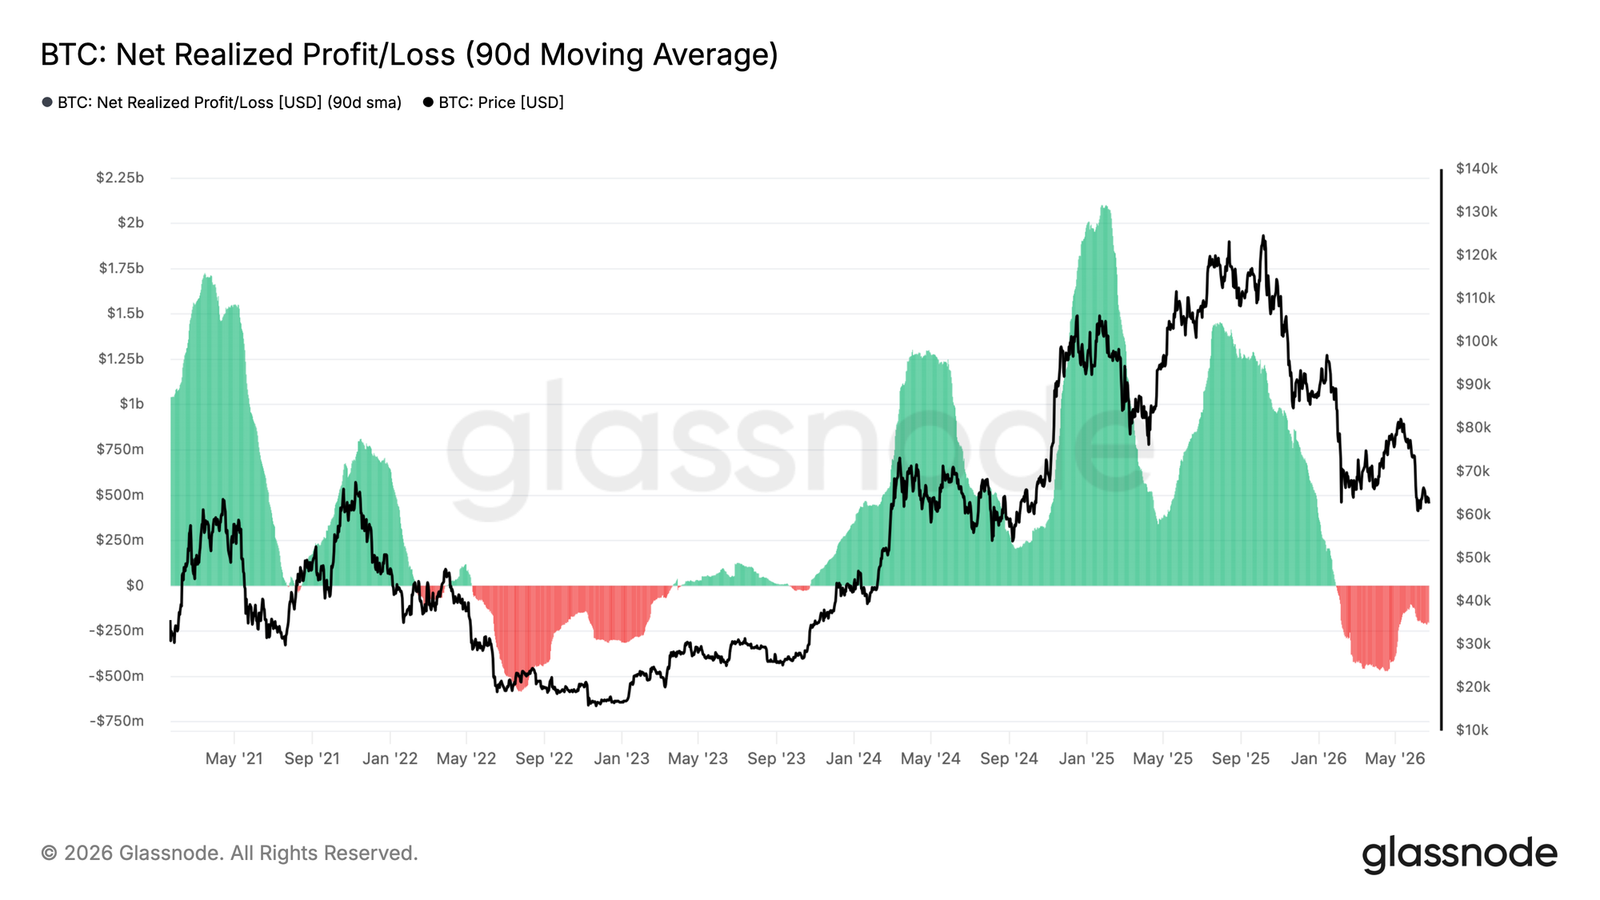
With the bear range established at $53,400–$77,000, the Net Realized Profit/Loss indicator (90-day MA) shows a daily net loss of $205 million, confirming that loss realization dominates market flows. Because this is a slow-moving average, the reading reflects a deeply embedded loss environment rather than a single stress event. A return to neutral (near zero) would be a strong signal that seller exhaustion is forming and that transition conditions toward a bull market are beginning to emerge.
Supply Overhead and Persistent ETF Outflows Cap Upside
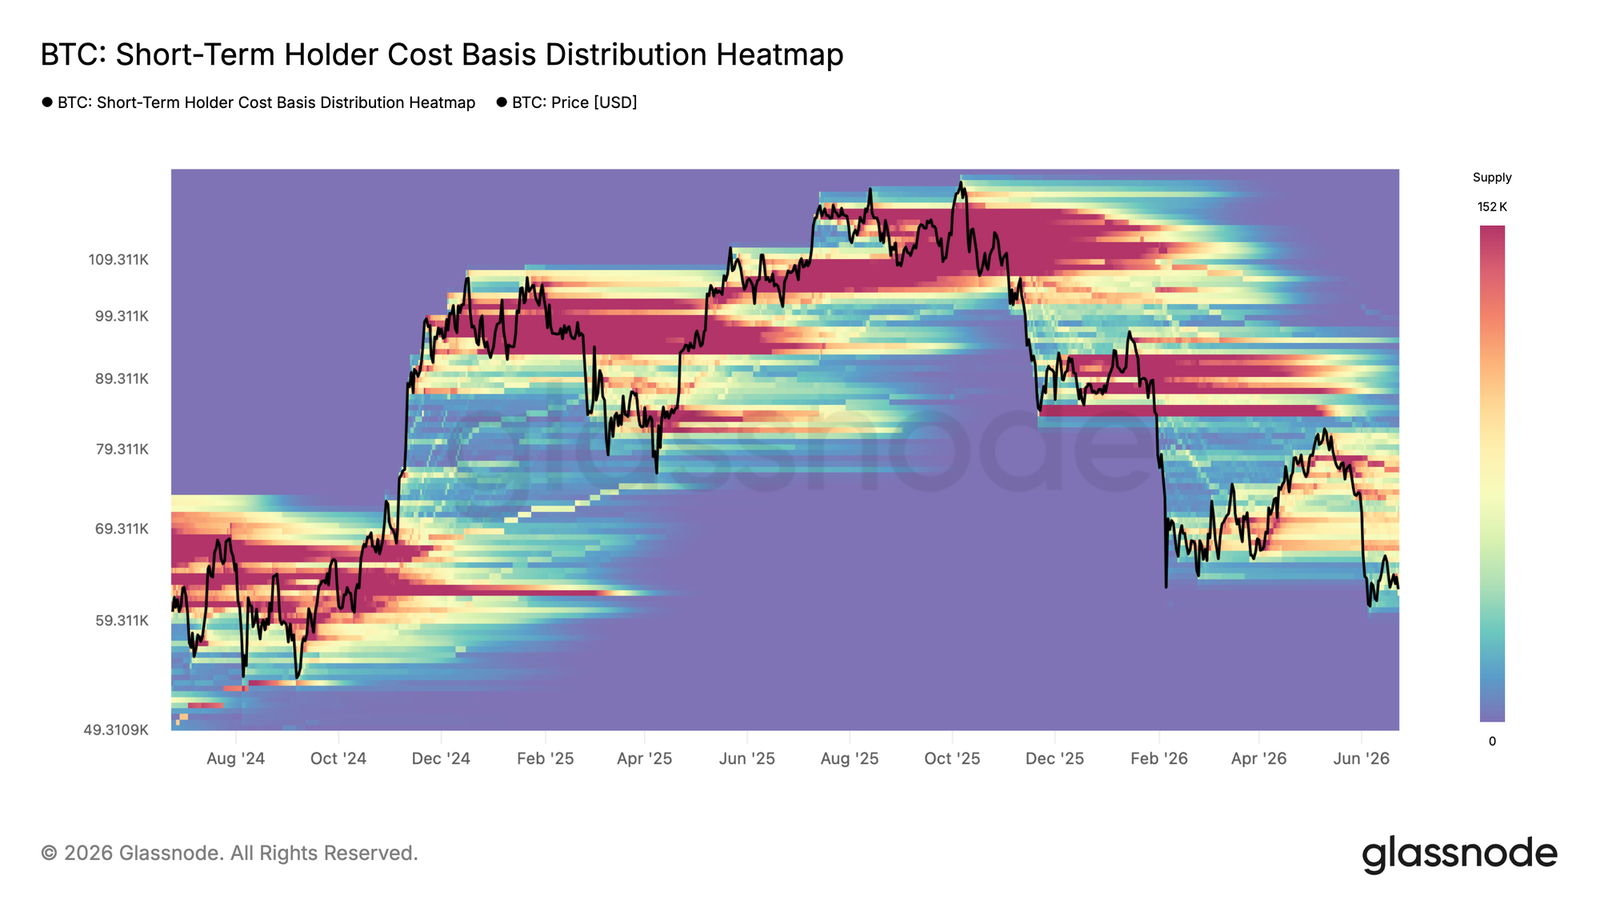
A local concentration of short-term holder supply overhead is a significant drag on price. The most pronounced cluster sits between $66,800 and $70,700, representing recently accumulated coins that are now underwater and likely to produce selling pressure on any bounce. This zone effectively defines the most probable ceiling for short-term sideways or relief rallies. A sustained reclaim above $66,800 would materially reduce the overhead burden and increase the probability of an extension toward the short-term holder cost basis at $71,400.
On the institutional side, U.S. spot ETFs continue to bleed, with the 7-day average net outflow approaching $300 million per day—one of the most sustained withdrawal periods since the ETFs launched. Grayscale’s GBTC accounted for the largest share of redemptions, with outflows exceeding 16,000 BTC over the past 90 days, suggesting weakness is driven by legacy holder liquidation and portfolio rebalancing rather than a uniform retreat across the ETF segment.

Spot-Futures Divergence and Options Market Defensive Signals
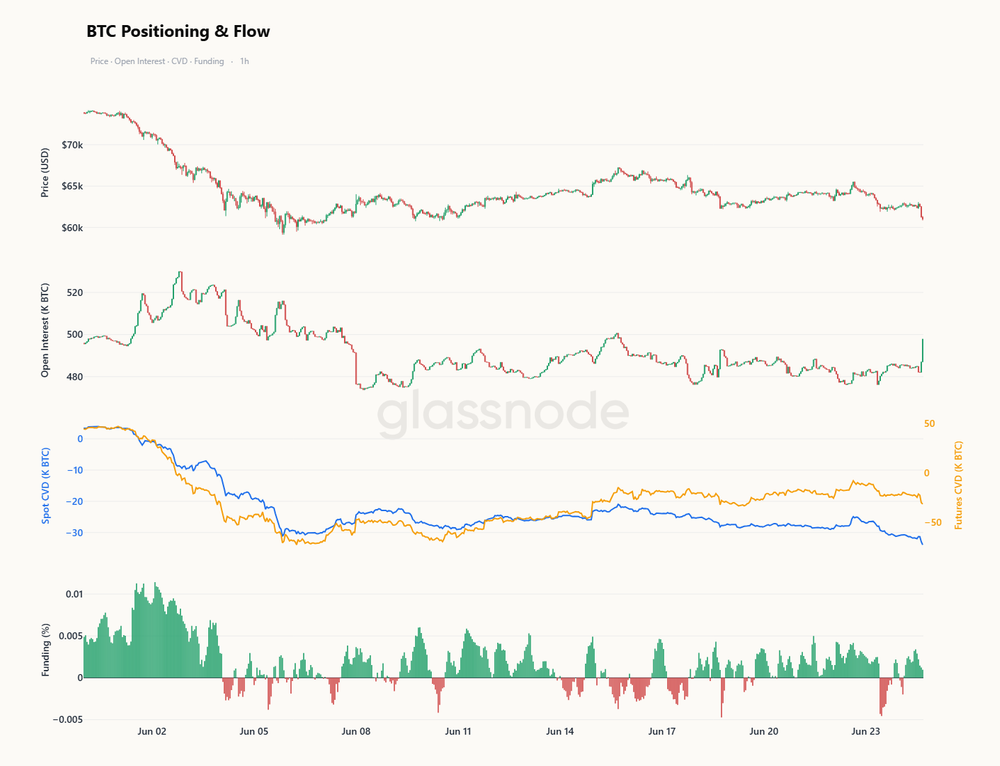
The spot market is showing a notable divergence: Coinbase spot CVD has turned positive, indicating a return of buy pressure from U.S. institutional players, while Binance remains negative, suggesting overseas traders stay defensive. Overall spot CVD bias is still negative, but the intensity of net selling is easing.
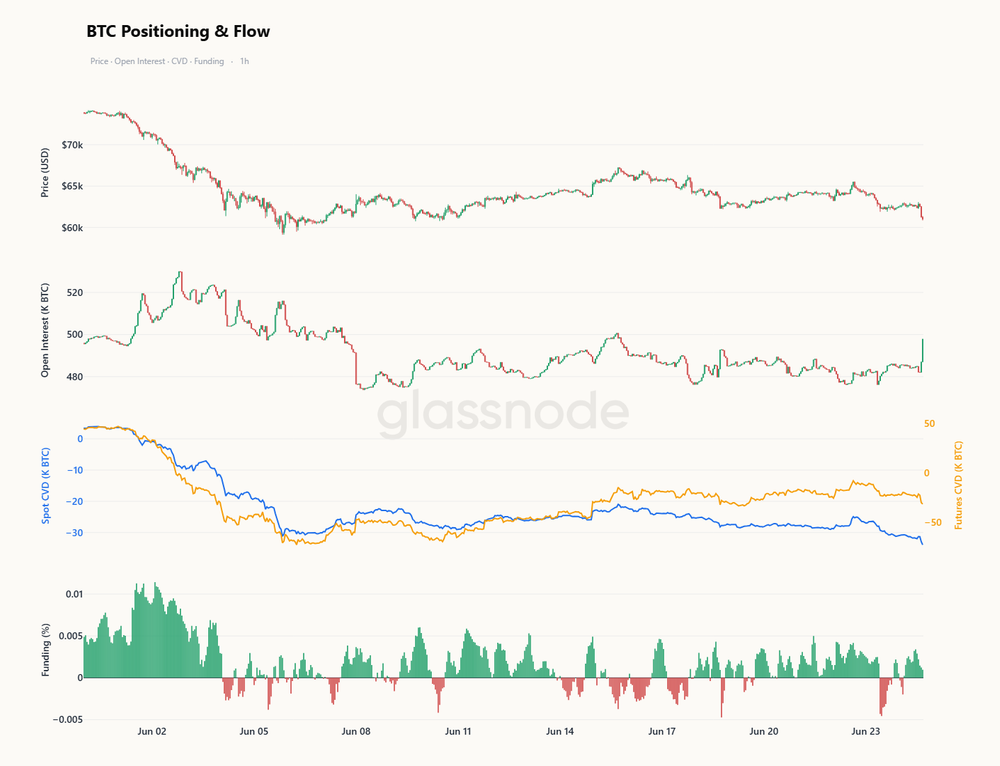
In the futures market, open interest surged as Bitcoin retested the low, and futures CVD has now turned negative in tandem with spot, while funding rates have fallen from elevated levels—indicating that leveraged participants are finally capitulating. On the options side, one-week ATM implied volatility briefly exceeded 42% during the latest selloff before settling near 37%; longer tenors remain stable. Volatility risk premium remains negative by about 4 vol points, as implied vol trails realized vol. Put skew has risen across the curve: one-week skew jumped from 12% to 24%, one-month from 14% to 23%, showing that traders are willing to pay a larger premium for downside protection. Gamma exposure shows the largest positive gamma clusters at $60K and $64K, with market makers hedging in a way that tends to keep price range-bound.
Early Signs of Bottom Formation
Bitcoin continues to trade in a market defined by caution rather than conviction. On-chain metrics show the asset at a deep discount to the average investor cost basis, while ongoing loss realization confirms the bear market is firmly in place. Nevertheless, early signs of stabilization have emerged beneath the surface: Coinbase spot flows have turned constructive, the short-term holder cost basis is adjusting downward, and the recent weakness has been driven primarily by spot sellers rather than excessive leverage. These developments do not signal an imminent reversal, but they are consistent with the early stages of a bottom formation process. The market remains caught between ongoing distribution and emerging value-driven demand—the tug-of-war will define Bitcoin's next major move.