



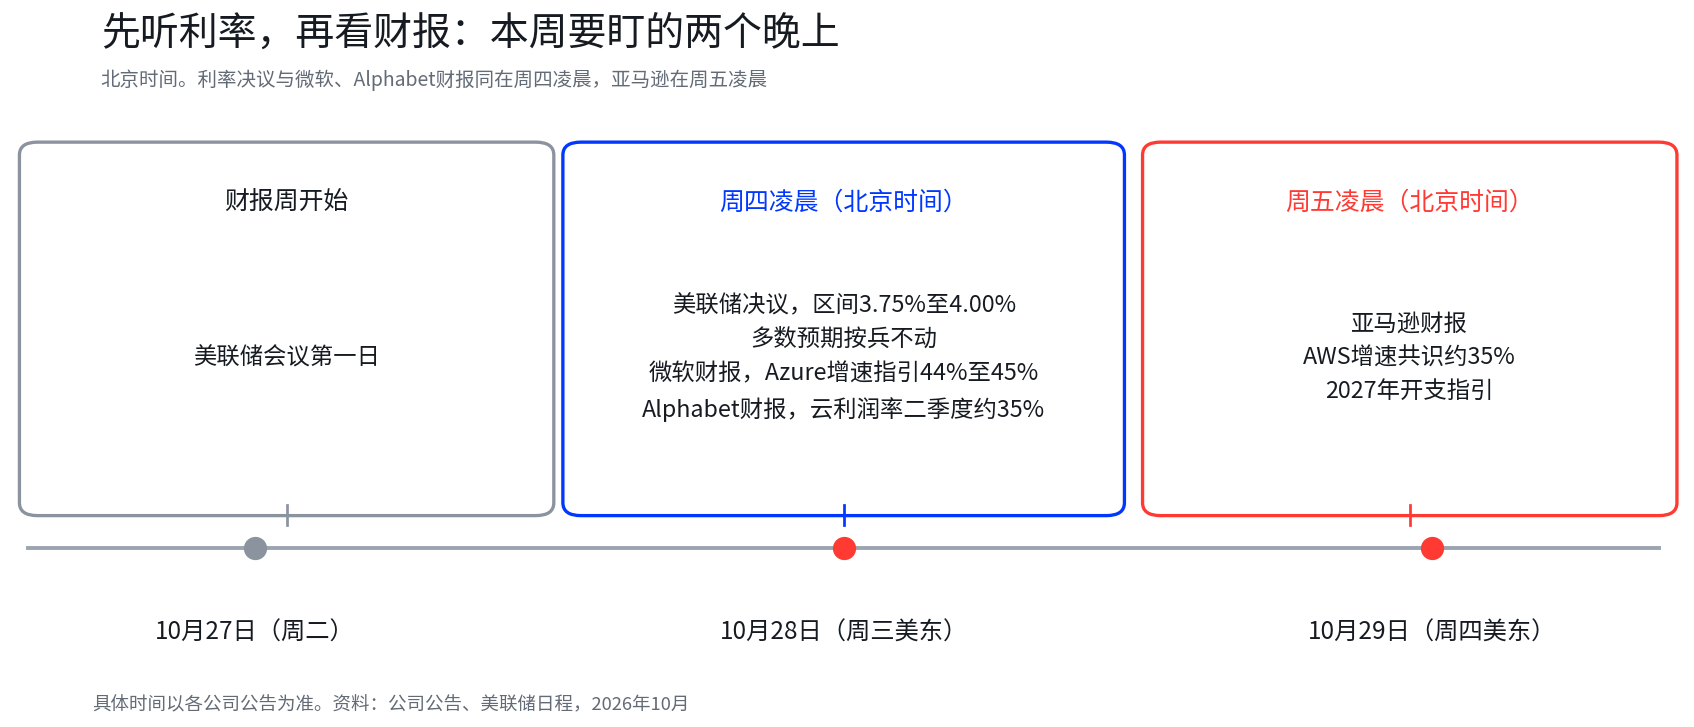
Microsoft and Alphabet are scheduled to report earnings after the U.S. market close on Oct. 28, which corresponds to around 4 a.m. Beijing time on Oct. 29. Amazon is due to report after the U.S. market close on Oct. 29, or around 4 a.m. Beijing time on Oct. 30. Share prices are expected to react first in after-hours trading, though the exact release times depend on each company’s own announcement.
This earnings week is not only about cloud growth rates. Microsoft, Alphabet and Amazon are all still building out AI infrastructure, but the route from spending to returns looks different at each company. Microsoft mainly sells cloud compute to enterprise customers through Azure. Alphabet runs Google Cloud while also using the same infrastructure to upgrade search and advertising. Amazon has to show that AWS growth and margin improvement can support an investment plan that keeps getting larger.
Across their latest reported periods, the three companies posted combined capital expenditures of about $134.9 billion. That number alone does not settle who is closest to earning a return on AI spending. Backlog points to how much future revenue is visible. Revenue growth shows how quickly demand is turning into sales. Margins speak to the quality of that growth. Cash flow is where the market sees how much of the investment actually remains for shareholders.
Investor focus is shifting from demand to payback
Meta’s earnings last week helped change the tone. The company delivered revenue and profit guidance above market expectations, but third-quarter free cash flow fell to negative $2.12 billion from positive $10.63 billion a year earlier. Revenue growth and weaker cash flow showed up at the same time. That pushed the market to ask a different question about AI spending: demand still matters, but so does the timing of returns.
Microsoft, Alphabet and Amazon now face that same test. All three are building AI infrastructure, yet each has a different monetization model. The comparison this week is less about who is spending the most and more about who can explain, with greater clarity, who will pay for the new compute capacity, where profit will come from and how long investors may need to wait for cash returns.
Earnings arrive in the same window as the Fed decision
Microsoft and Alphabet are expected to report after the close on Oct. 28 U.S. time, with Amazon following after the close on Oct. 29. The Federal Reserve is also holding its policy meeting on Oct. 27-28, and the rate decision is due in the same window. Exact release times remain subject to company announcements.
The federal funds target range currently stands at 3.75% to 4.00%. According to a Bloomberg survey as of Oct. 23, most respondents expected the Fed to leave rates unchanged, while 8 of 64 surveyed analysts expected a 25-basis-point increase.
Rates and earnings affect valuation through different channels, but they meet at the same moment. Rates shape the opportunity cost of capital and the return investors demand. Earnings determine whether companies can justify current valuations with stronger growth and cash generation. If cloud growth beats expectations and margins keep improving, the market may be more willing to tolerate near-term cash flow pressure from earlier spending. If revenue keeps rising but spending accelerates without better return guidance, investors may revisit the cost of expansion.
As of Oct. 26, Microsoft closed at $532.60, up 1.54%. Alphabet closed at $316.80, down 1.06%. Amazon was quoted at $249.42 in after-hours trading. Price action ahead of earnings has not offered a clear direction, leaving operating data and management guidance as the more direct inputs for valuation.
$134.9 billion in capex, but not the same financial starting point
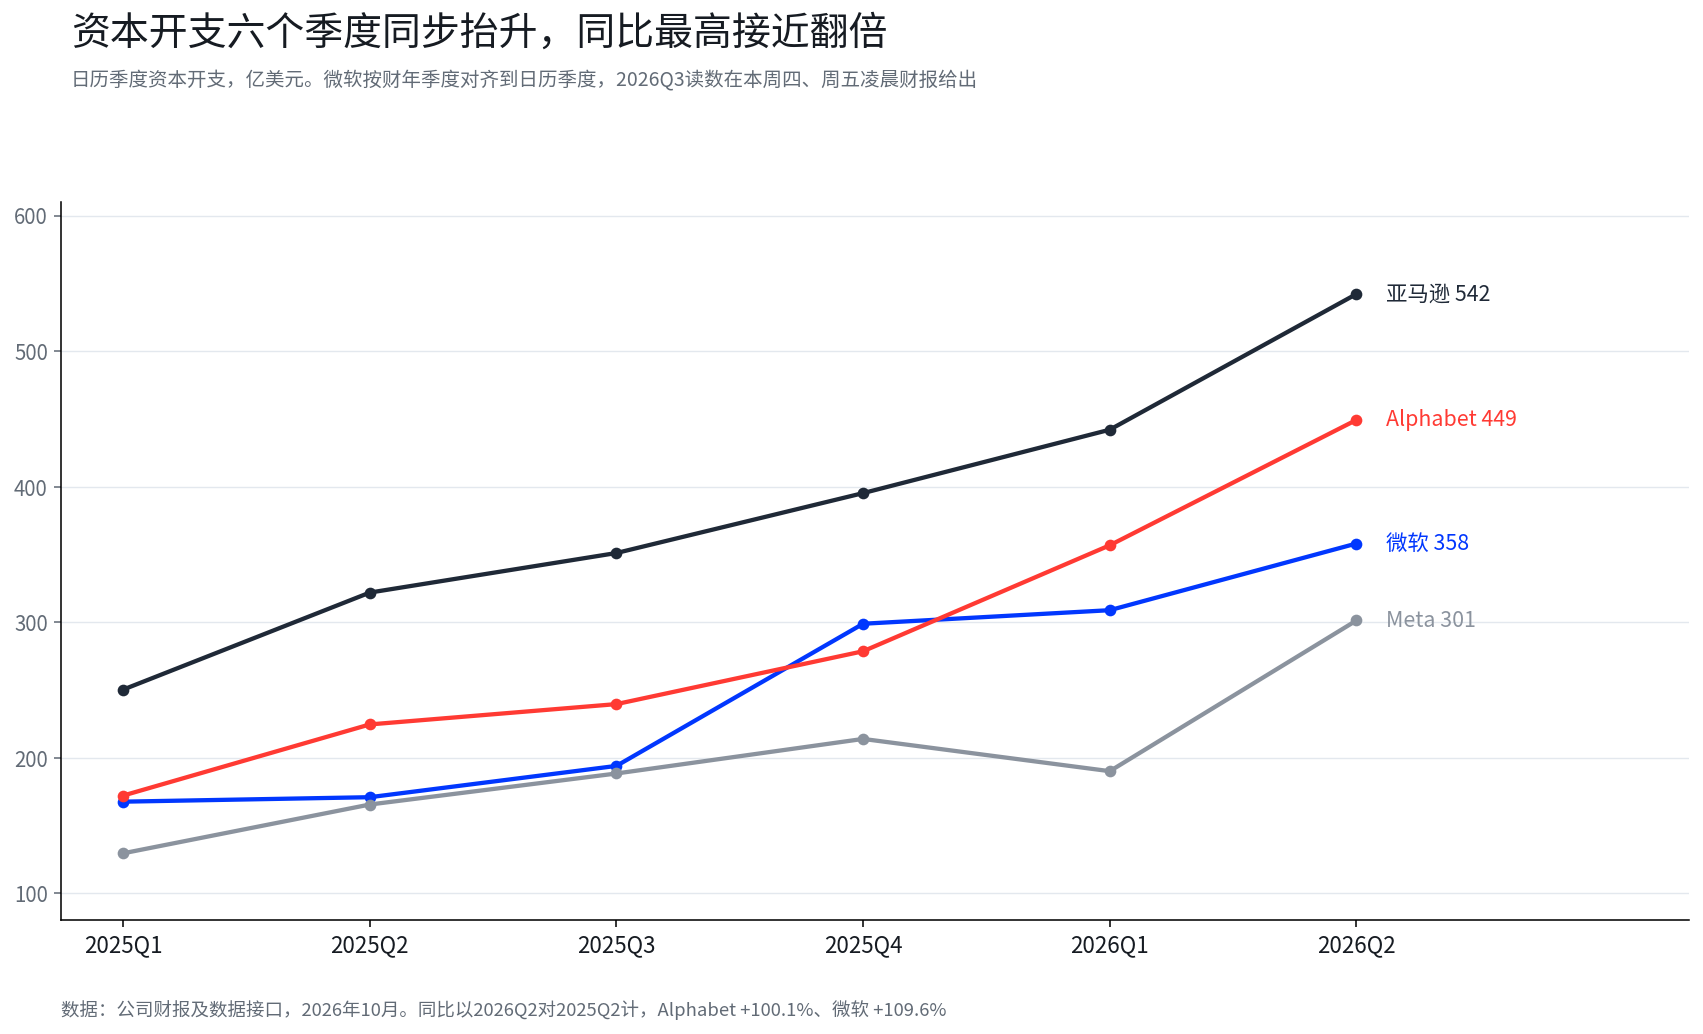
Microsoft, Alphabet and Amazon together spent about $134.9 billion in capital expenditures in their latest disclosed reporting periods. Looking at operating cash flow relative to capex, the pressure is already diverging.
Microsoft still generated enough operating cash flow to cover quarterly capex and retain $19.64 billion in free cash flow. Alphabet and Amazon, by contrast, reported capex of $44.92 billion and $54.21 billion, both above operating cash flow for the period. That leaves the shortfall to be absorbed by cash reserves, financing or other funding arrangements.

A single quarter of negative free cash flow does not mean each company’s overall cash-generating ability has deteriorated to the same degree. The gap becomes clearer over a longer period. Alphabet generated about $73.27 billion in free cash flow for full-year 2025 and still posted about $4.26 billion in the first half of 2026, even though the second quarter turned negative as spending jumped. Amazon generated about $7.7 billion in free cash flow in 2025, but the figure fell to negative $26.99 billion in the first half of 2026, and trailing four-quarter free cash flow also turned negative. That makes its cash flow profile more exposed. Meta produced about $13.82 billion in free cash flow across the first three quarters, with the negative reading concentrated in the third quarter. Microsoft, meanwhile, stayed positive in each of the last four quarters.
That is why the sustainability of this spending cycle cannot be judged by a single quarter’s sign. The more useful questions are whether operating cash flow can rise alongside capex, and how long it will take before free cash flow starts expanding again.
Spending is still climbing, and depreciation is still coming through
Capital expenditures have trended higher across the last six quarters for all four companies discussed in the source material. In the latest reported period, Alphabet and Microsoft posted year-over-year capex growth above 100%, while Amazon and Meta were in a range of roughly 68% to 80%. This week’s earnings will add the latest calendar third-quarter data for Microsoft, Alphabet and Amazon.
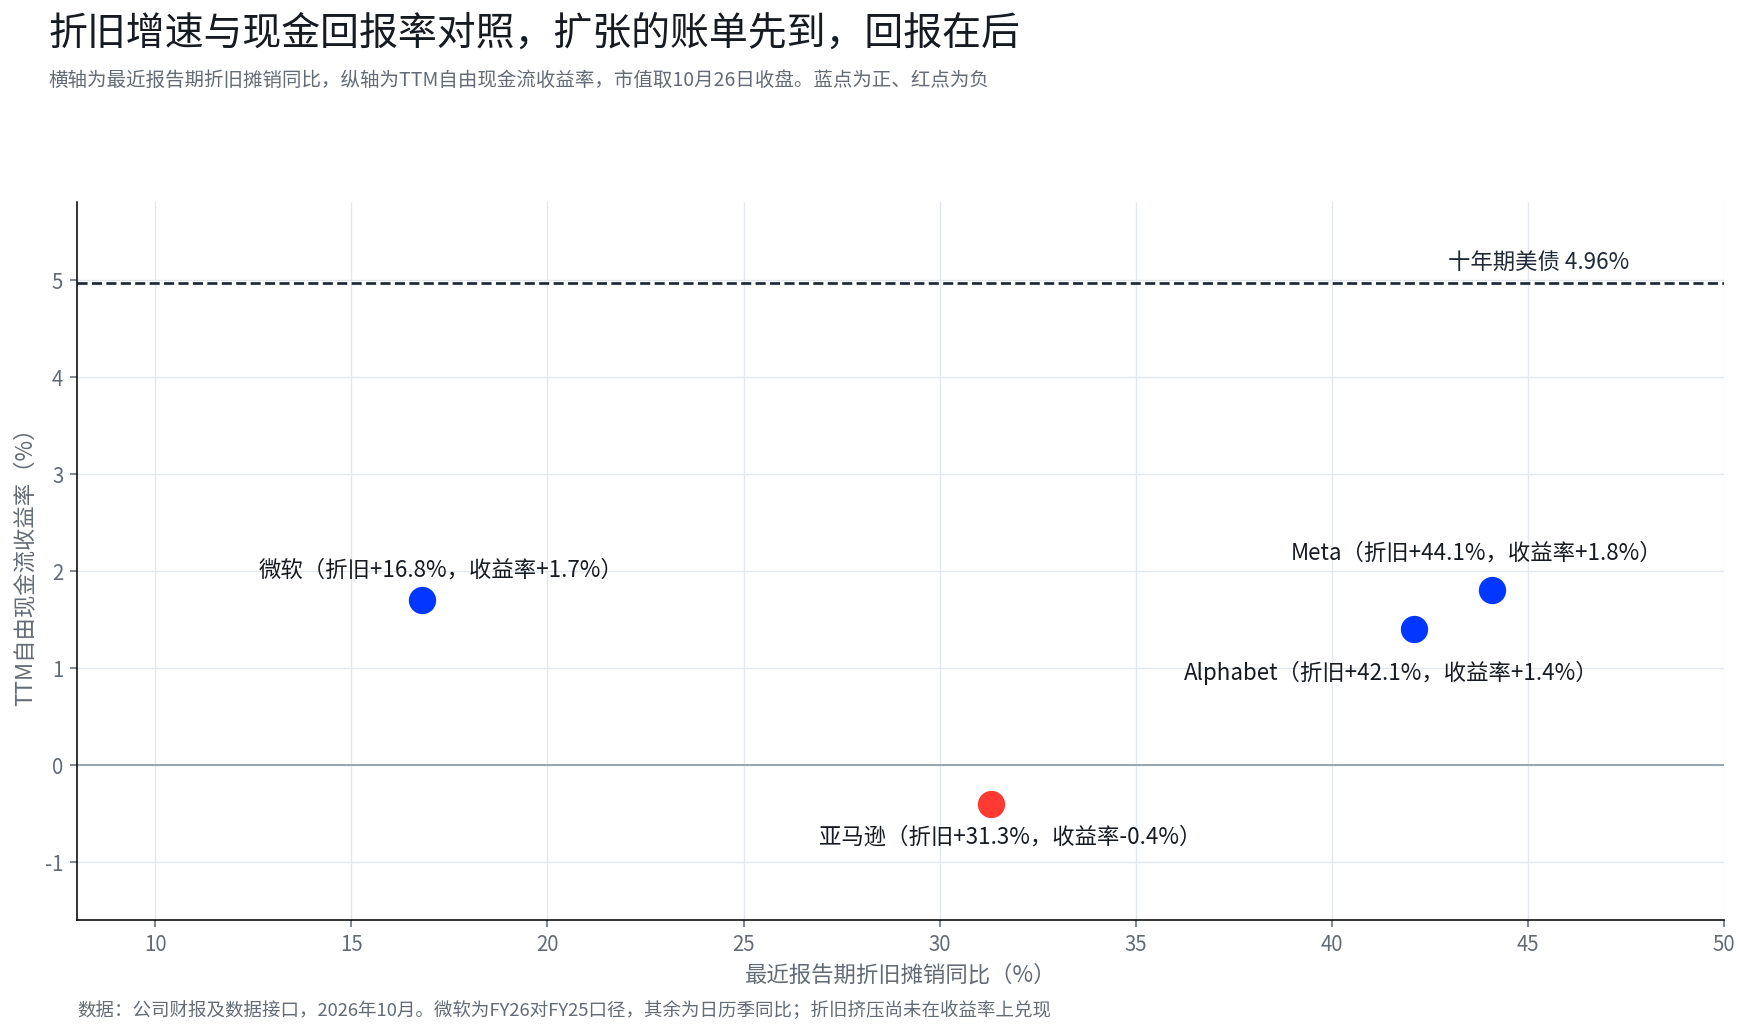
The effect of capex does not end when the cash is spent. Once data centers, servers and other compute equipment are put into service, the cost begins to flow through depreciation and amortization. In the latest reported period, year-over-year growth in depreciation and amortization ran at roughly 17% to 44% across the four companies, with Alphabet and Meta both above 40%.
That matters because new compute capacity can start contributing revenue without producing an immediate margin improvement. New revenue has to absorb operating costs and depreciation. If financing expands, interest expense also enters the picture. The lag between investment and return is one of the central financial variables in this AI infrastructure cycle.
Funding sources deserve attention as well. Based on company filings cited in the source material, Meta’s long-term debt rose by about $22.2 billion in one quarter, from $58.74 billion to $80.92 billion. Debt changes alone do not prove AI investment risk is rising, but when capex keeps expanding, the mix of cash reserves, financing arrangements and future cash flow affects how well a company can absorb swings in the investment cycle.
Measured as trailing four-quarter free cash flow divided by market capitalization, Microsoft was at about 1.7%, Alphabet at about 1.4%, Amazon at about -0.4% and Meta at about 1.8%, using market values as of the Oct. 26 close. The U.S. 10-year Treasury yield was about 4.96% at the same time.
That comparison is only a valuation reference. It does not mean Treasuries are automatically more attractive than large-cap technology stocks. Treasuries offer contractual interest payments. Equity cash flow can grow with the business, but it can also be affected by investment intensity, competition and financing costs. For these companies, a lower current free cash flow yield means the market still needs to see a more convincing future growth path to support existing valuations.
Three monetization models: renting compute, upgrading internal products, scaling the platform
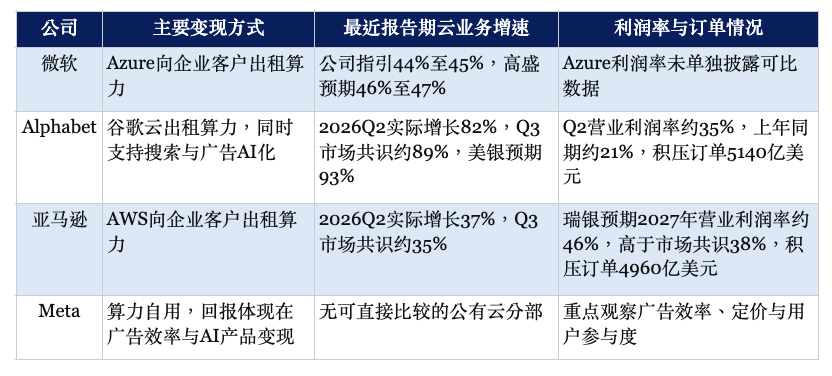
All three companies need more compute. The real difference is how that compute enters the income statement.
Microsoft and Amazon have the more direct commercial path. They build data centers and compute capacity, then sell cloud services to enterprise customers. Revenue is formed through contracts and actual usage. The speed of payback depends on utilization, customer demand, pricing power and equipment costs.
Alphabet’s equation is more complicated. Google Cloud can rent out compute directly, but AI infrastructure also supports upgrades to search and advertising products. A single investment can support both cloud revenue and the core ad business, so the return does not map neatly to one segment. That is why the market is watching not only Google Cloud growth, but also whether AI spending improves the competitiveness and monetization efficiency of the advertising business.
Meta, included in the source material for comparison, does not have a comparable public cloud rental business. Its compute is used mainly for internal products and advertising systems. Returns have to show up through recommendation quality, ad conversion, pricing power and user engagement. That path may still have commercial value, but it is harder to isolate through a single metric and may take longer to verify.
Alphabet and Amazon together have about $1.01 trillion in backlog. Their combined 2026 capex guidance is about $425 billion, making backlog roughly 2.4 times that figure. On the surface, that gives substantial visibility into future revenue, but backlog is not the same as cash received, and it does not mean revenue will be recognized evenly in the near term.
Whether backlog turns into shareholder returns still depends on delivery schedules, contract execution, business margins and future capex. If backlog growth comes with margin improvement, the market is more likely to accept additional spending. If revenue rises without margin support, backlog size alone is not enough to prove the investment case.
Microsoft: Azure growth has to hold up, and the free cash flow promise matters too
For Microsoft, the central issue is whether cloud growth can support continued expansion while management keeps its free cash flow commitment intact.
According to media-cited forecasts, Goldman Sachs expects Azure constant-currency growth of 46% to 47%, above the company’s own 44% to 45% guidance. Morgan Stanley has treated roughly 47% as a reference level that would support the current valuation. Those are outside forecasts, not company commitments.
If Azure growth meets or exceeds those expectations, the market will have a stronger basis to believe new compute capacity is translating into real demand. If the result lands only at the low end of company guidance, investors may press harder on whether revenue growth can stay firm while capex keeps rising, and when cash flow can return to stronger growth.
The scale of spending explains why the question matters. Microsoft’s fiscal 2026 capex was about $115.95 billion, up 80% year over year. According to Visible Alpha consensus figures cited by Goldman Sachs, fiscal 2027 capex is expected at about $221 billion, up 52%. The company’s capex guidance for the current quarter is above $50 billion, versus about $19 billion in the year-earlier period.
At the same time, Microsoft has committed to remaining free-cash-flow positive in fiscal 2027. Whether that holds depends on operating cash flow growth, the actual pace of capex and related costs. Spending by itself does not answer the question. Goldman Sachs, as cited in the source material, expects Microsoft’s fiscal 2028 free cash flow at about $14.3 billion, implying that even if expansion continues, improvement in cash returns may still be uneven.
Calendar-year and fiscal-year labels also need to be separated. Microsoft’s 2026 calendar-year capex guidance was reportedly revised from about $190 billion to about $175 billion. Morningstar said that change mainly reflected lease reclassification in accounting treatment, not a corresponding reduction in actual buildout plans, so it should not be read simply as a deliberate slowdown in AI investment.
Microsoft’s relative advantage is that free cash flow remains positive for now, and depreciation and amortization growth in the latest reported period was about 16.8%, lower than the others. Goldman Sachs also expects Microsoft to bring about 5GW of new compute capacity online in fiscal 2027, with total capacity potentially reaching about 40GW by mid-2030. The firm also said the in-house Maia 300 chip could lower inference costs. Those points are institutional views or forecasts.
This earnings report needs to be read through three variables together: whether Azure growth meets expectations, whether capex guidance is raised again, and how management explains the path to delivering on free cash flow. A strong cloud growth number on its own will not settle the full debate.
Alphabet: a $514 billion backlog, but can it keep turning into profit?
Alphabet does not appear short of demand. The harder part is making cloud growth and profit improvement keep pace with infrastructure spending.
Visible Alpha data cited in the source material shows market expectations for Alphabet’s third-quarter revenue rising from $121.4 billion in April to about $127.9 billion, with advertising resilience as one support. On the cloud side, Bank of America expects third-quarter revenue growth of 93%, above a market consensus of about 89%, based mainly on new capacity coming online and growth in external TPU sales. Those are media-cited institutional expectations.
Margins are the other key line to watch. In the second quarter of 2026, Google Cloud posted operating profit of about $8.8 billion and an operating margin of about 35%, up from about 21% a year earlier. That improvement suggests cloud growth has already started to convert into operating profit, but whether it continues depends on the revenue and cost structure after new capacity is deployed.
Alphabet has already raised its 2026 capex guidance to $195 billion to $205 billion and said capex will increase again in 2027. Second-quarter capex reached $44.92 billion, and spending may remain elevated. More equipment creates new revenue opportunities, but it also adds to depreciation over time.
Alphabet’s cash flow profile is better understood through the timing of investment and the timing of returns. Full-year 2025 free cash flow was about $73.27 billion, and trailing four-quarter free cash flow was about $53.27 billion. A negative second quarter does not mean trailing four-quarter cash generation has also turned negative.
The $514 billion backlog gives visibility into future revenue, but its financial meaning depends on the pace of order recognition and delivery, and on how much profit remains after costs. If new capacity drives cloud revenue higher and margins keep improving, current cash flow pressure is easier to read as a temporary feature of the buildout cycle.
The downside scenario in the source material is more specific. If third-quarter cloud margin falls below 30% while backlog growth slows, the issue would no longer be just a quarter of concentrated capex. It would raise the possibility that future revenue and profit are not enough to support the spending pace. That is one of the points to check closely in the earnings release and conference call.
Amazon: AWS is growing fast, but the financial cost of expansion is rising too
Amazon’s challenge is to maintain AWS growth while limiting the drain that expansion places on cash flow, and to explain when new capacity can start producing higher profit.
In the second quarter of 2026, AWS revenue was about $42.2 billion, up 37% year over year, the fastest growth in 18 quarters. Backlog stood at about $496 billion. At the same time, Amazon raised its 2026 cash capex plan to about $220 billion, with management citing higher upstream costs such as memory as one factor.
Cash flow is where Amazon stands apart from Microsoft and Alphabet. Amazon generated about $7.7 billion in free cash flow in full-year 2025, but that fell to negative $26.99 billion in the first half of 2026. First-half capex amounted to 138% of operating cash flow.
Seasonality matters here. Amazon’s first-quarter operating cash flow is usually the low point of the year, while the fourth quarter is typically stronger, so a single quarter or half-year should not be projected directly onto the full year. Even so, the first-half figures show a much larger draw from capex on operating cash flow, and management will likely need to address that more directly.
According to media-cited UBS estimates, Amazon’s 2027 capex forecast was raised from about $250 billion to more than $300 billion, and free cash flow in 2027 could be near zero or remain negative. The same report projected AWS operating margin at about 46% in 2027, above a market consensus of 38%, and forecast about $80 billion in new AWS revenue that year. UBS also raised its price target to $348 from $318 and kept a buy rating. Those are institutional forecasts, not confirmed company outcomes.
The core issue in those projections is whether higher spending and higher margins can happen at the same time. Continued expansion implies the company still sees strong demand. But if the revenue and profit from new capacity do not cover the associated costs, the point at which cash flow turns positive could move further out.
That is why this earnings report should not be judged only on whether AWS growth beats the market consensus of roughly 35%. Capex guidance, AWS margin trends and management’s explanation of 2027 cash flow need to be assessed together. If spending rises again without a matching improvement in margins, the market may need to rethink the timeline for cash flow recovery.
The conference calls will be about different operating questions
The three companies are not facing the same test, and the source material lays out different checkpoints for each one after earnings are released.
For Microsoft, the question is whether Azure growth and the cash flow commitment can both hold. Azure reaching or exceeding the 44% to 45% guidance range would be a direct test of cloud demand. But investors also need to know whether capex guidance moves higher again and how management explains its promise of positive free cash flow in fiscal 2027. If revenue growth and cash flow improvement cannot appear together, the market’s view of investment returns may need to change.
For Alphabet, the question is whether Google Cloud growth can keep turning into profit. The $514 billion backlog gives visibility into future revenue, while the roughly 35% second-quarter operating margin offers a benchmark for current profitability. Backlog and margins need to be read together. The market will be watching whether order growth continues and whether new revenue can offset rising depreciation and costs.
For Amazon, the question is whether future spending and AWS margins can line up. AWS is still growing quickly, but capex is taking a larger share of cash flow. Guidance for 2027 capex, expectations for AWS margins and management’s view on cash flow recovery are linked variables. If spending keeps rising while profitability does not improve enough, the cash flow breakeven point could move further away.
The effects would not stop with the cloud providers themselves. Order expectations for suppliers of AI chips, memory and power equipment are tied directly to the investment plans of large cloud companies. If Microsoft, Alphabet and Amazon keep expanding capacity, visibility for upstream demand may remain supported. If the pace slows, those suppliers may also need to revisit their own order and revenue expectations.
The real comparison this week is not the absolute size of spending
This week’s earnings will not settle the final answer on AI infrastructure returns, but they should make each company’s path clearer.
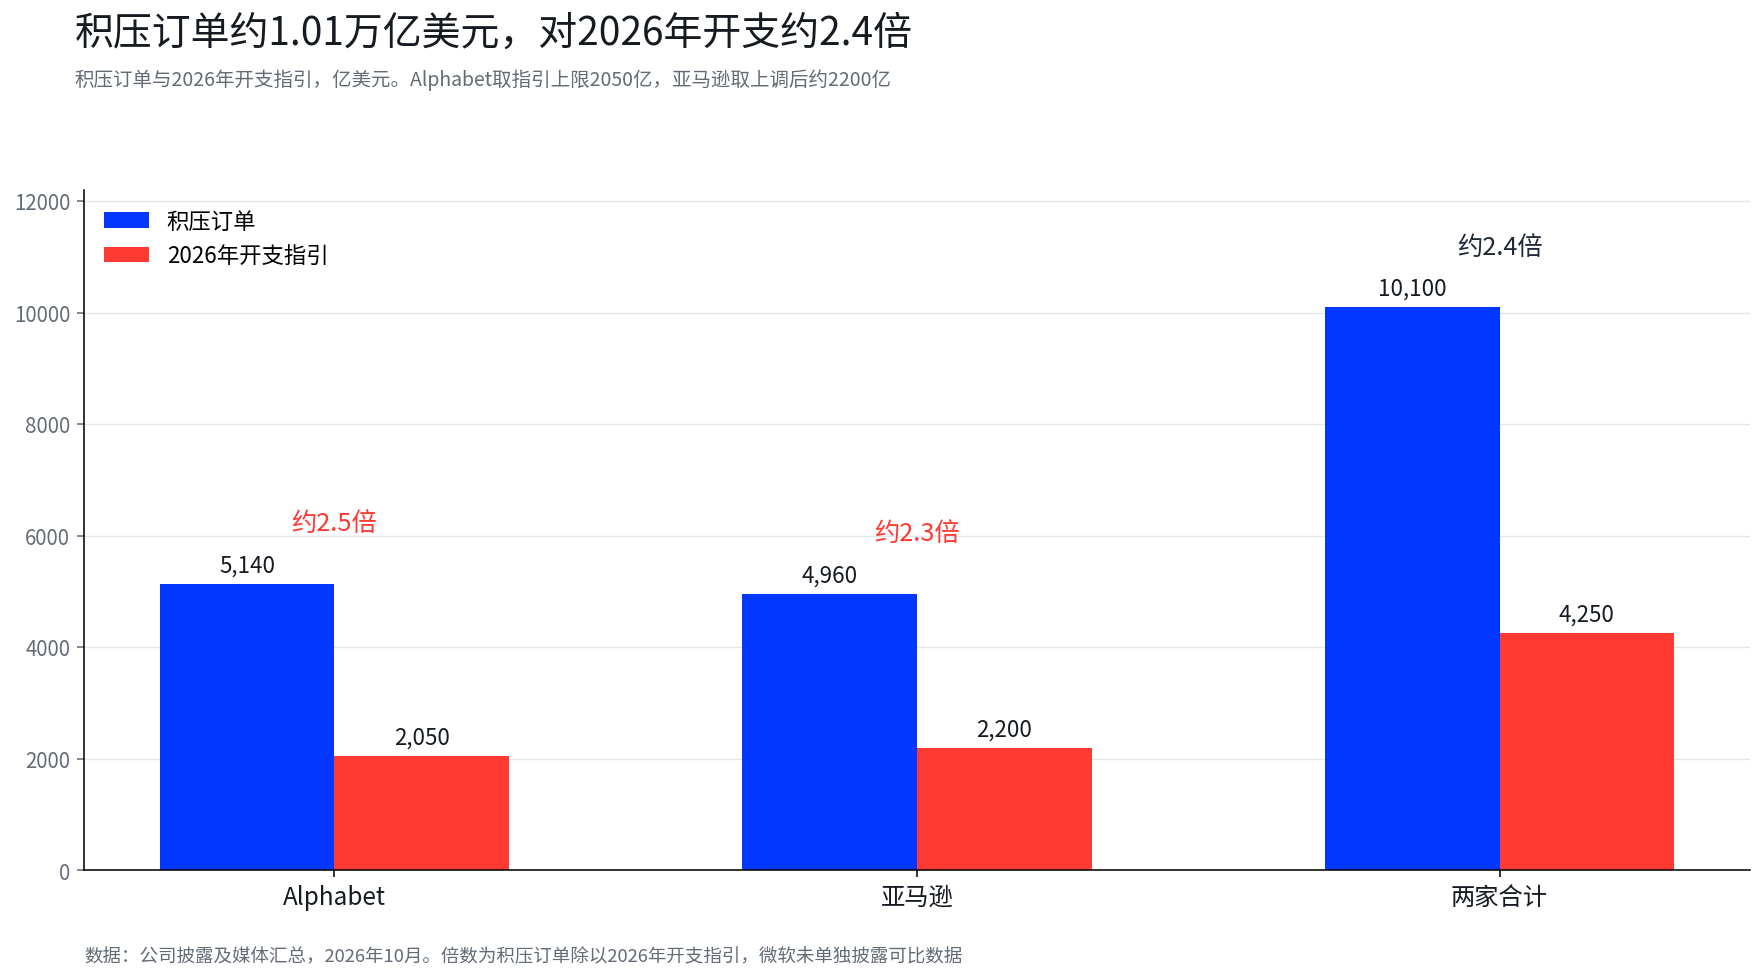
Microsoft needs to show that Azure growth, capex and its free cash flow commitment can coexist. Alphabet needs to show that cloud margins can keep up with revenue growth and infrastructure expansion. Amazon needs to explain how AWS growth and margin improvement can support a rising investment base.
Because the business models differ, no single metric can determine which company is closest to earning back its AI investment. Azure growth, Google Cloud margins, and AWS capex and margin guidance each map to a different operating constraint. Together they point to one question: can the revenue and profit created by new compute capacity produce enough cash return before depreciation, financing costs and further expansion costs continue to build?
If this week’s data and guidance show revenue growth, margin improvement and better investment efficiency moving in the same direction, the market may continue to support a long-term growth premium. If spending keeps expanding while the timing of returns moves further out, valuations may adjust.
The more meaningful comparison this week is which company can explain most clearly why it still needs to keep spending, and through what path that spending will become operating returns. The absolute dollar amount of capex is secondary.
Data notes and disclaimer
The source material says operating cash flow, capex, free cash flow, and depreciation and amortization for the four companies came from company filings and data interfaces, with data current through October 2026. Microsoft figures use FY2026 Q4, Alphabet and Amazon use 2026 Q2, and Meta uses 2026 Q3.
Meta free cash flow and debt figures were cited from media references to Dow Jones market data and company filings. Earnings schedules and rate expectations were cited from company announcements, the Federal Reserve calendar and Bloomberg survey reporting. Views from Goldman Sachs, Morgan Stanley, Bank of America, UBS, Visible Alpha and Morningstar were all media-cited institutional opinions representing those firms’ judgments at specific points in time.
For valuation and market data, market capitalization and the U.S. 10-year Treasury yield use closing data from Oct. 26, 2026. Free cash flow yield is estimated as trailing four-quarter free cash flow divided by market capitalization and is not the same as expected total stock return.
The source material also notes that disclosure and calculation methods for finance leases, capex and free cash flow may differ across companies, and that the institutional expectations, ratios and scenario analysis discussed should not be treated as confirmed company results.
Separately, the original article mentioned BIT’s "Q3 Earnings Season — Refer a Friend" campaign. For the week of Oct. 26 to Nov. 1, the featured stock is Alphabet (GOOG). Participation and rewards are subject to eligibility requirements, jurisdictional restrictions and campaign terms and conditions. For every two successful referrals, participants can unlock a $20 stock card for the featured stock of the week, or the BTC equivalent. Referred users who register with BIT through a referral link and complete the opening of a securities account will each receive a $10 GOOG stock card or the BTC equivalent. The original article stated that this campaign is independent of the market commentary above and does not constitute a recommendation or endorsement of GOOG.
The original disclaimer said the article was provided for general information and market commentary only, based on public information available as of the dates referenced. Market data, expectations and probabilities may change with market conditions. Views and investment strategies attributed to third-party institutions, analysts or other individuals represent only those parties’ opinions at specific times and do not represent BIT’s views or recommendations. The article does not constitute investment advice, investment research, an offer, solicitation or recommendation regarding any security, investment product or trading strategy, and should not be relied on for investment decisions. Financial markets involve risk, and securities prices and market performance may fluctuate. Historical performance and past market trends do not represent or guarantee future results. Investors should assess relevant risks independently based on their own circumstances and seek professional advice when needed.