

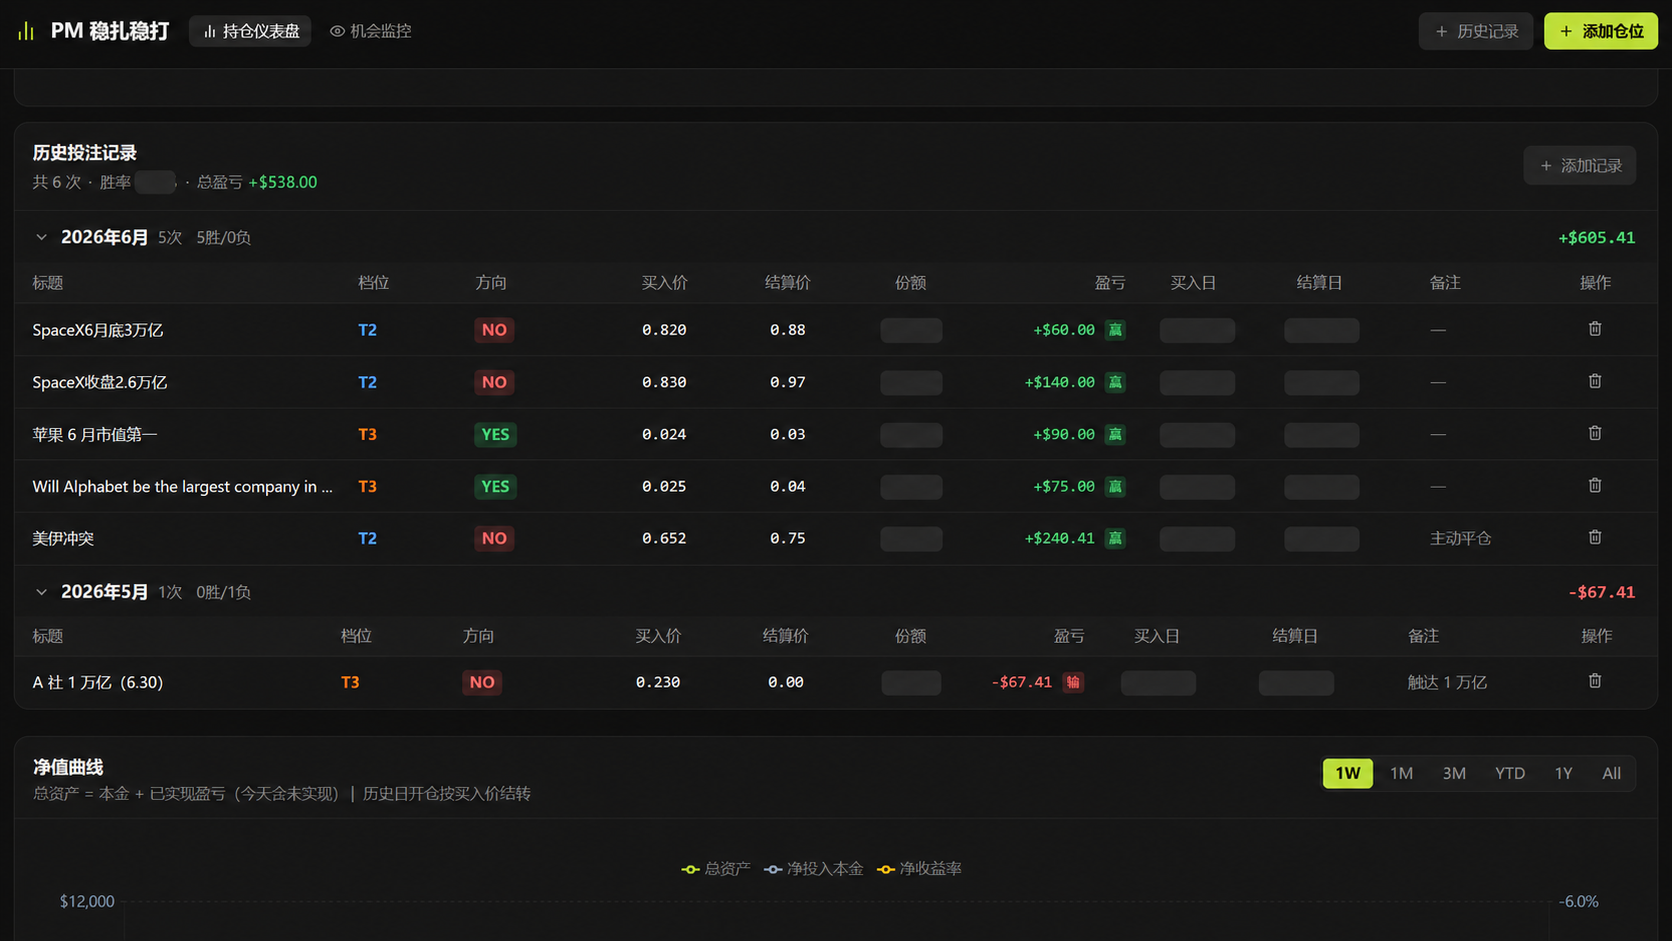
In a previous article titled 'I built myself an investment workstation with AI,' the author shared several tools created through Coding: a cross-market asset dashboard, an investment map, a personal content operations desk, and a Polymarket betting monitor that has recently become the most frequently used component. Over the past half month, the author tested the Polymarket dashboard with roughly $1,600 in capital and recorded returns of more than 30%. The dashboard’s real-time statistics were largely consistent with the final net profit, with a difference of around 6U, mainly tied to small issues such as open orders and liquidity rewards.
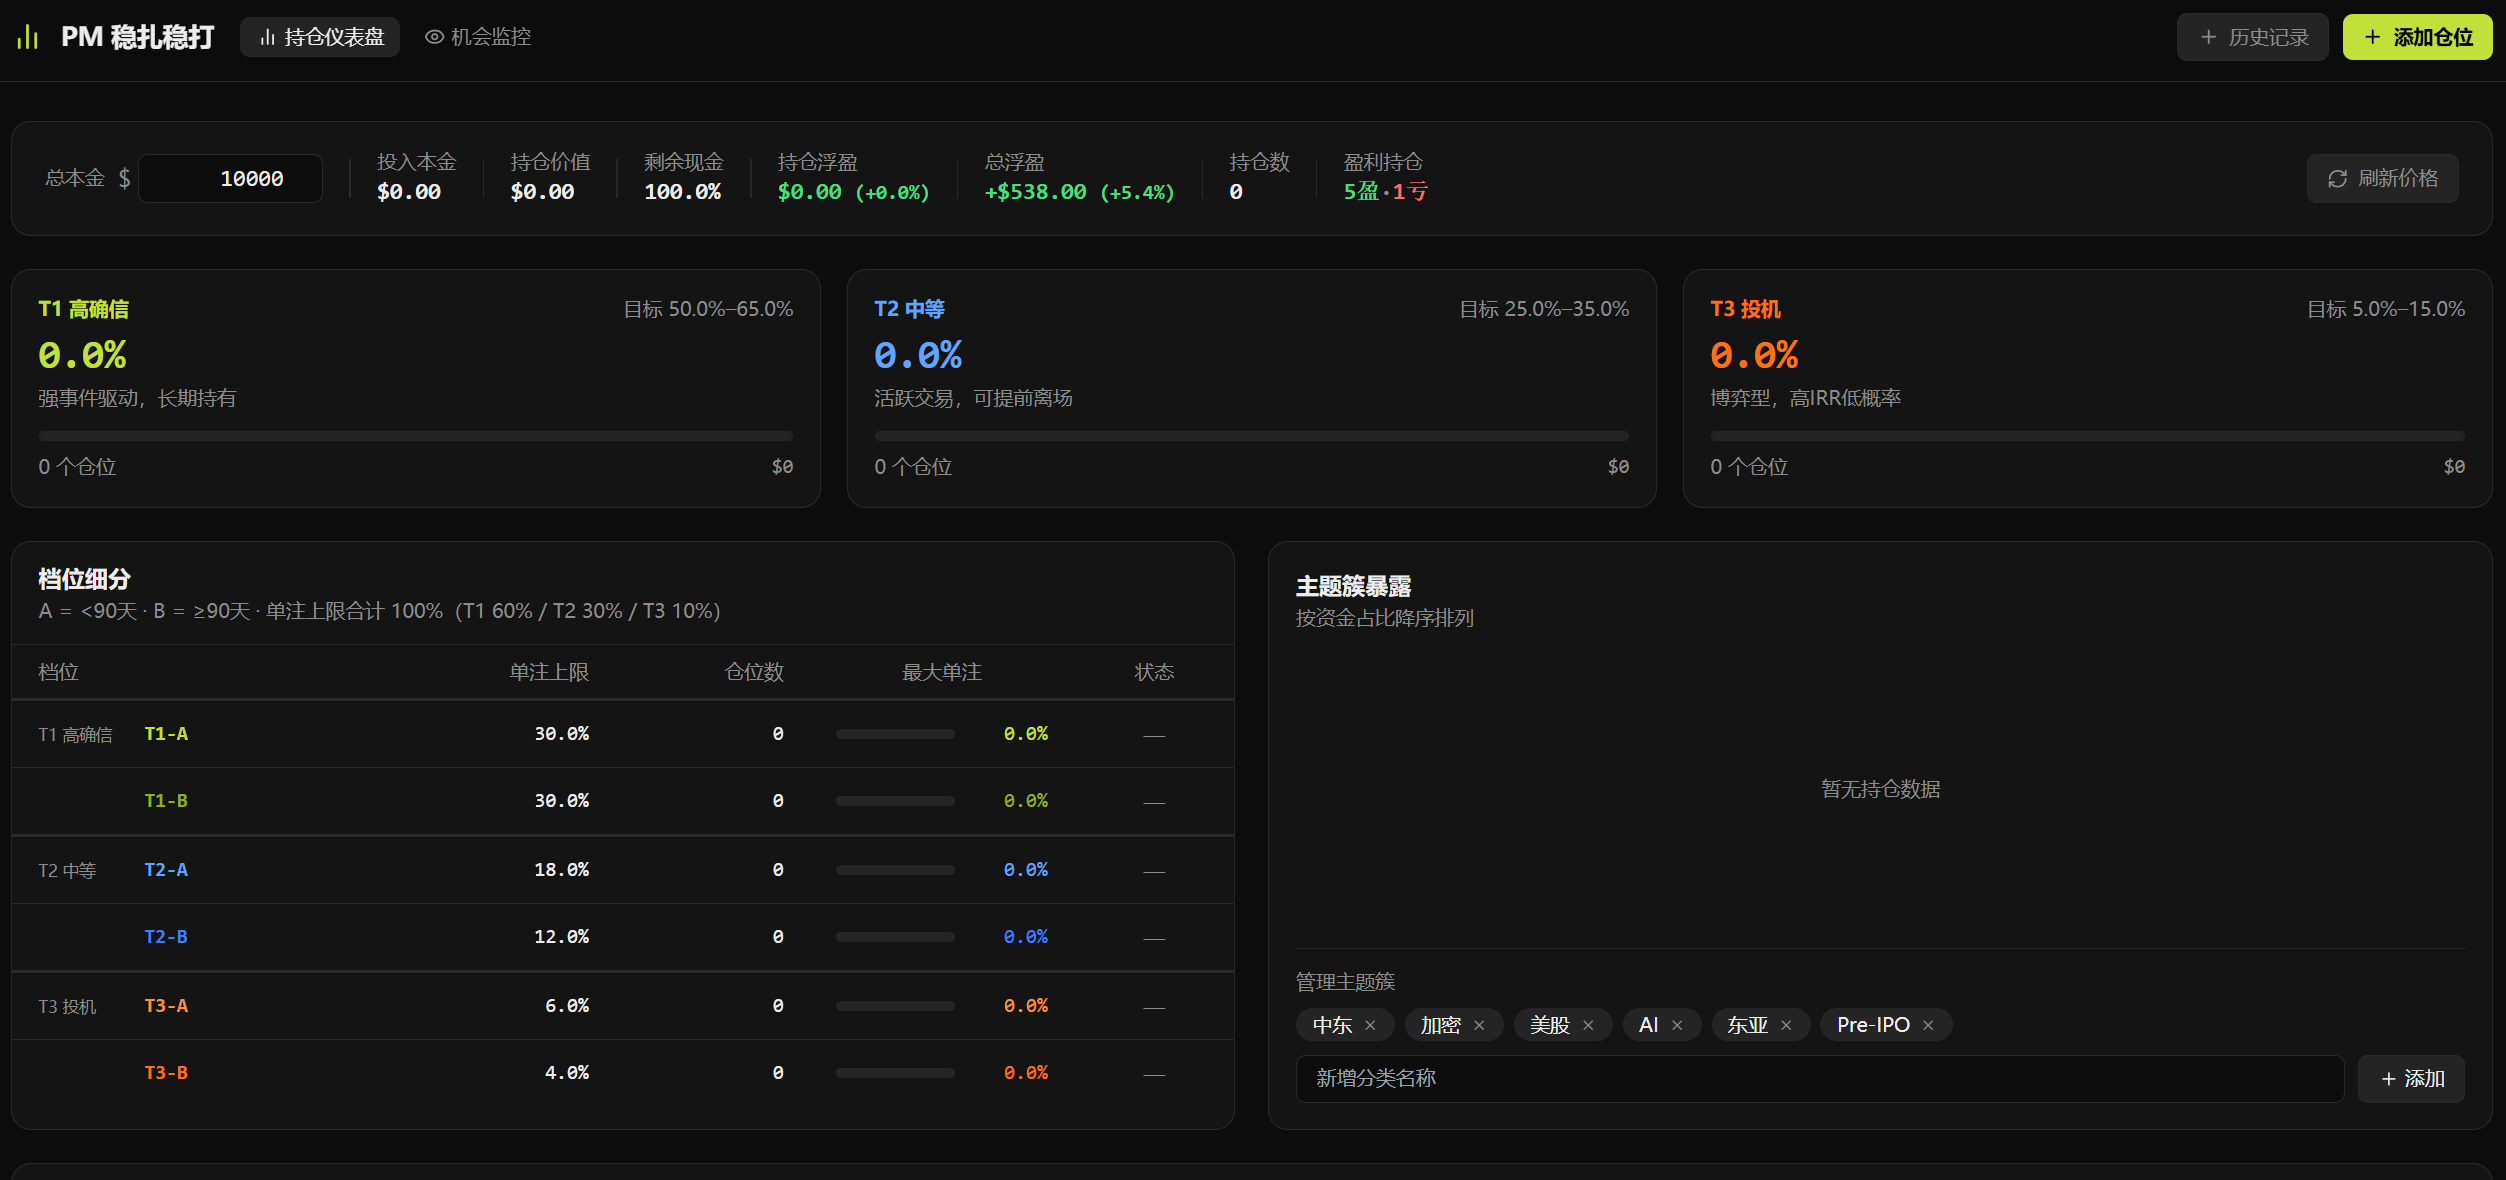
The author stresses, however, that the point of the review is not to claim that Polymarket is easy money, and it is not meant to become an arbitrage tutorial. The opposite conclusion came out of the trial. After running through this round, the author became more convinced that Polymarket is not a place suited to users who rush in with an 'arbitrage' mindset. The more valuable question is how a tool can put scattered bets, changing odds and personal judgments back into a unified framework.
From manual Excel tracking to a real-time dashboard
The author began building the dashboard around May 21. The original requirement was simple: stop opening a dozen betting pages just to check the changing yes/no prices, and stop manually entering every trade into Excel. Before the dashboard existed, the author had been using Excel to track buying and selling, floating profits and losses, settlement dates and event types. That method worked only in a very rough way.
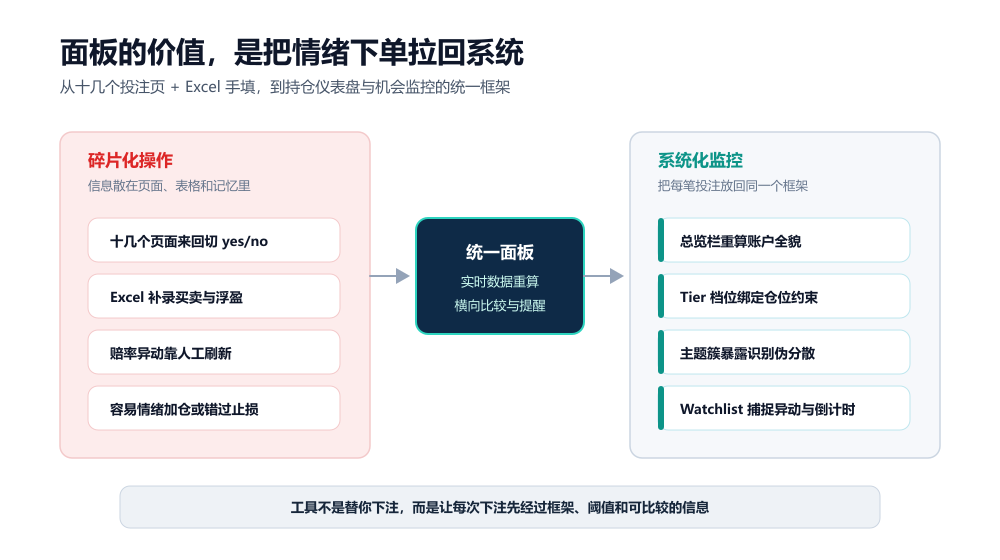
Users who have actually played on Polymarket know how quickly many bets can become hard to control. A position may begin as a small buy, then the odds move and the temptation to add appears. When an event suddenly moves and the spreadsheet has not been updated, the window to cut losses or add exposure can pass before the user reacts. The author’s diagnosis is that the process is too fragmented. Without a system, decisions are easily driven by emotion.
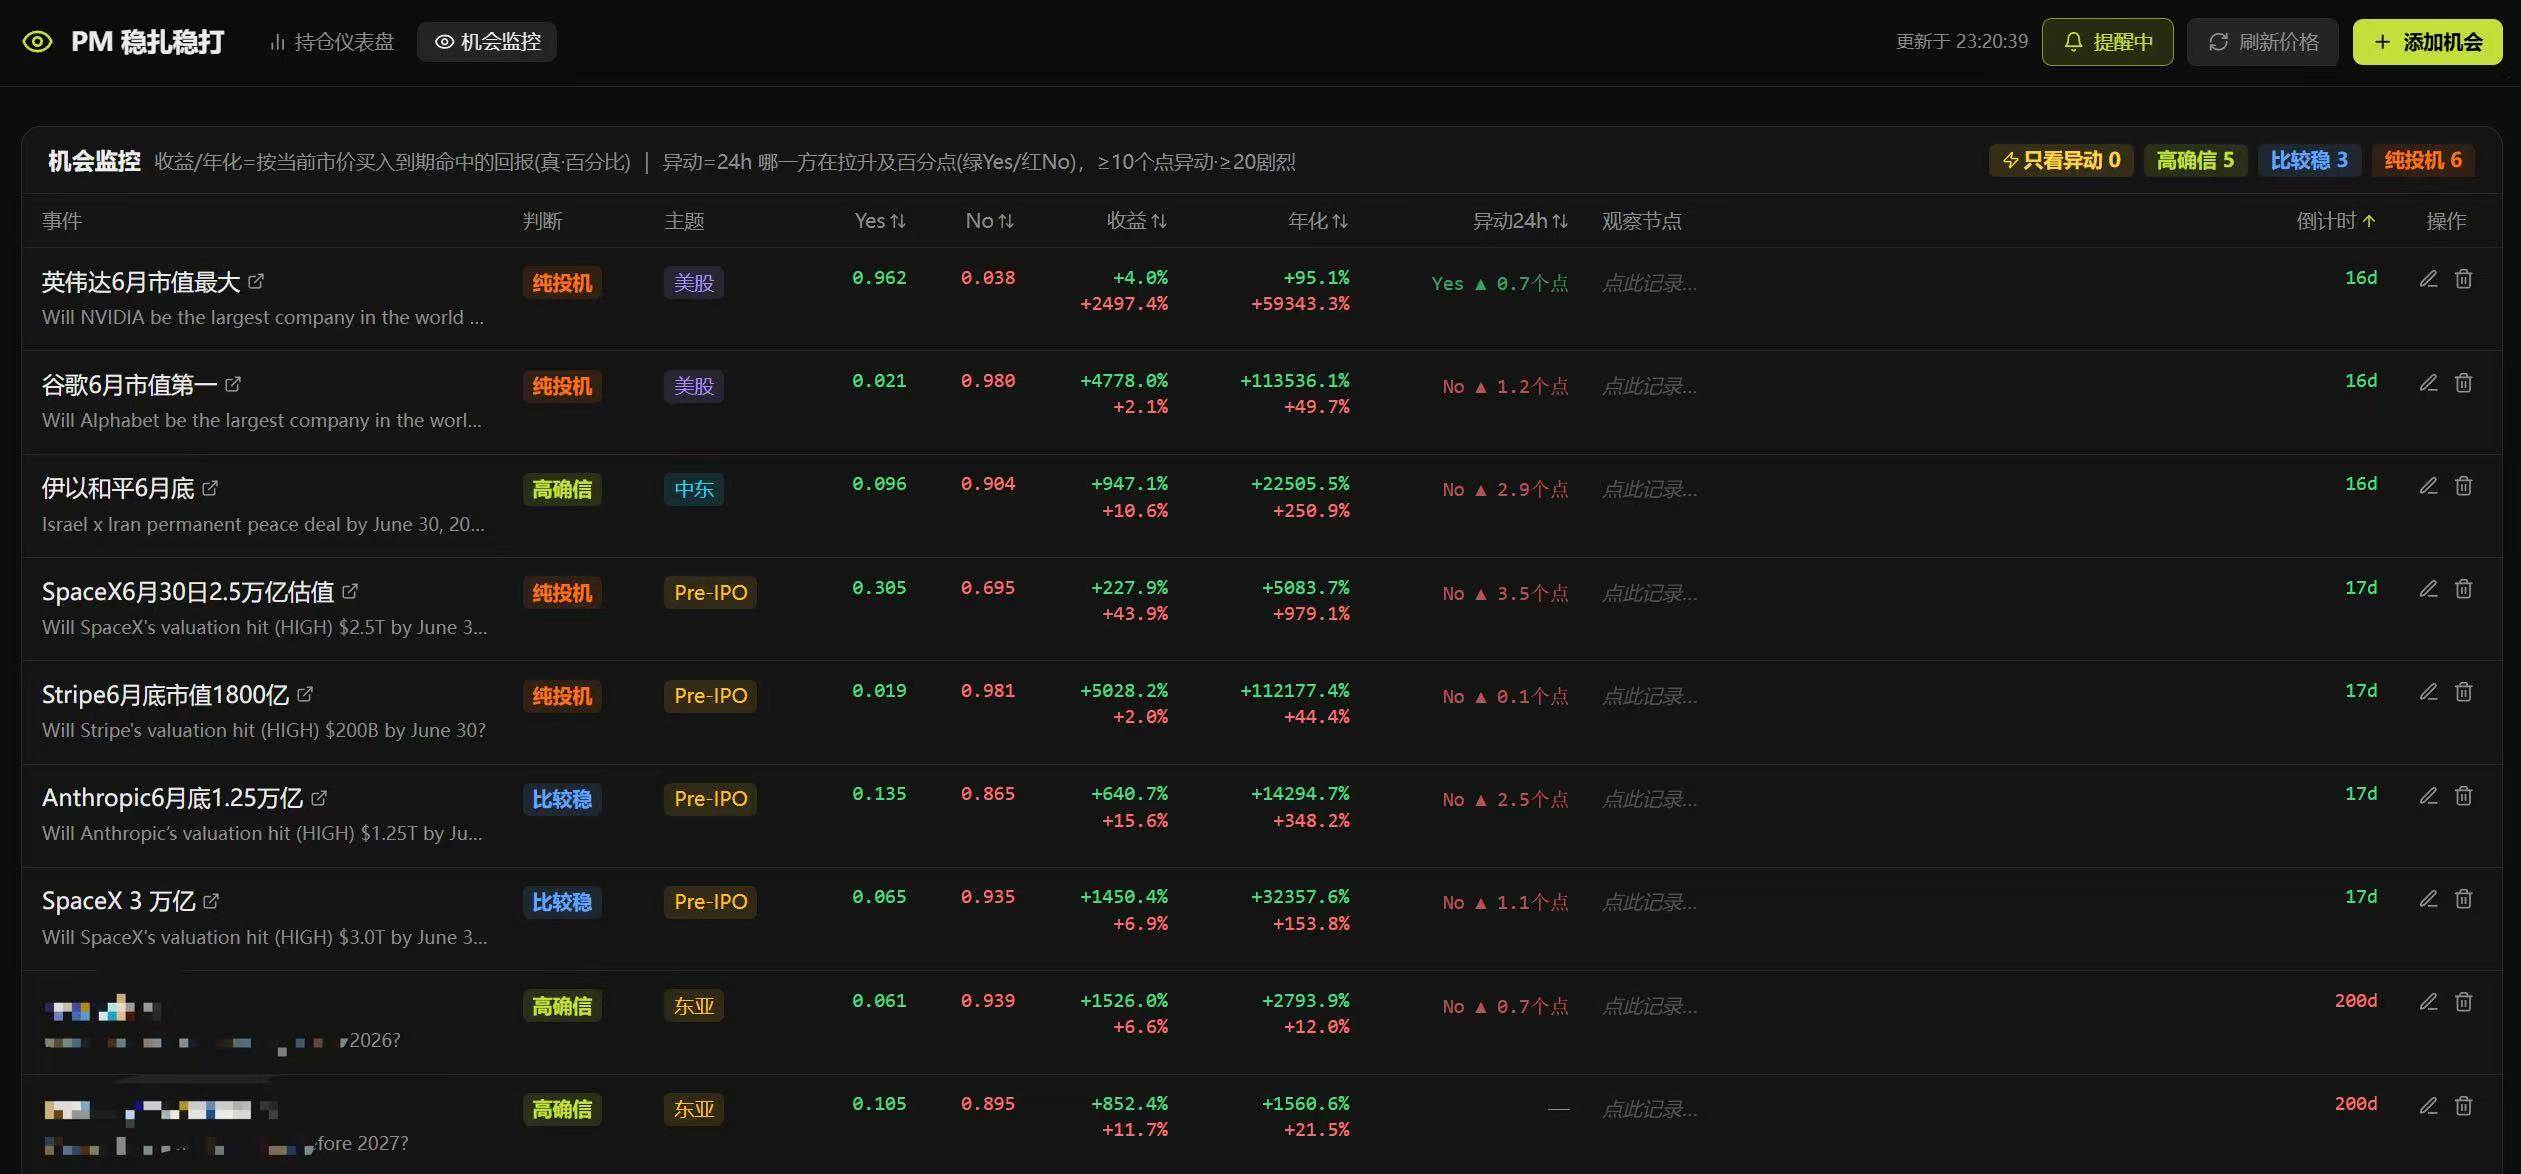
After several iterations, the tool was divided into two tabs: a 'position dashboard' and an 'opportunity monitor.' The position dashboard is the core. It pulls real-time Polymarket data and recalculates the relevant fields. For each market, it records the event name with a direct link to the trading page, the T1/T2/T3 classification, current yes/no prices, return, annualized return, abnormal price movements, observation points set by the author, and a countdown to expiration. The movement alert can be customized; for example, if a market changes by more than 20% within 24 hours, a pop-up appears as long as the web page remains open.
Two design details stood out to the author. The first was finding a suitable Polymarket interface: by pasting in an event page link, the system can automatically parse and display the yes/no options, corresponding prices and the classification of different options under the same event. This greatly reduces manual entry. The second was that the Tier label for the same bet can automatically change based on the remaining number of days. Before Anthropic released Mython, the watchlist showed a clear price movement. The author believed that the event had become a high-probability outcome at that point, and entering then could capture roughly 10 points of return. Without a watchlist, this type of opportunity is hard to catch consistently.
The core trap: expected return does not remove tail risk
The author’s broader conclusion from the test is that binary markets such as Polymarket contain a structural trap. They are unfriendly to players who like to concentrate a single large position, but they fit users who are comfortable building a broad basket of many small positions. The author explains this through a simplified example. If the yes price of an event, c, is 0.80, the market is roughly pricing the event as having an 80% chance of happening. If the author personally judges the true probability, q, to be 0.90, the expected return can be roughly calculated as EV = q / c - 1 = 0.90 / 0.80 - 1 = 12.5%.
That 12.5% looks attractive, but Polymarket is not a bond. The number hides a sharp tail risk: if the judgment is wrong, the loss is not 12.5%, but 100%. Because of that, the author does not only watch the expected return on the dashboard. Two other dimensions are tracked at the same time. One is the gap between the author’s probability judgment and the market price, namely q - c, which is the core question of whether an edge truly exists. The other is the damage to the overall account if a single bet goes to zero. The author also set an automatic take-profit alert target at the midpoint between the purchase price and 100.
How the T1, T2 and T3 framework limits position size
The T1, T2 and T3 framework is built from this risk logic. T1 refers to high-conviction positions. For the author, the comfort zone is mainly around East Asia and certain geopolitical topics, especially where an information gap between Eastern and Western contexts appears to exist and where the author has repeatedly checked the case before adding it. T2 refers to relatively stable opportunities where the author feels the current implied probability is clearly higher than the actual yes or no pricing. T3 is pure speculation: high-odds trades that should not be held frequently or for long periods, but can be used for contrarian rebounds and short-term mean reversion.
T1 also carries a hidden cost, especially in long-duration markets. For example, a T1 bet may show an 18% static return, but if settlement is 180 days away, its annualized IRR may only be 3% to 4%. In that period, the principal is locked, and the user can miss later opportunities with higher IRR. Because of this, the author further divides T1 into time buckets. Short-term T1-A positions can be sized more actively, while long-term T1-C positions require restraint. Allocating too much capital to low-IRR long-duration positions becomes an invisible loss of capital efficiency.
T2 has edge, but it must leave room for being wrong. The author caps a single T2 bet at 8% to 10%, which means even if the position is fully lost, the total account loss remains within 10% and does not block participation in later opportunities. T3 may have attractive odds, but the author uses the smallest positions to observe it. The goal is not to rely on T3 for large profits, but to track high-odds events continuously and build a feel for these markets through contrarian attempts and short-term price reversion.
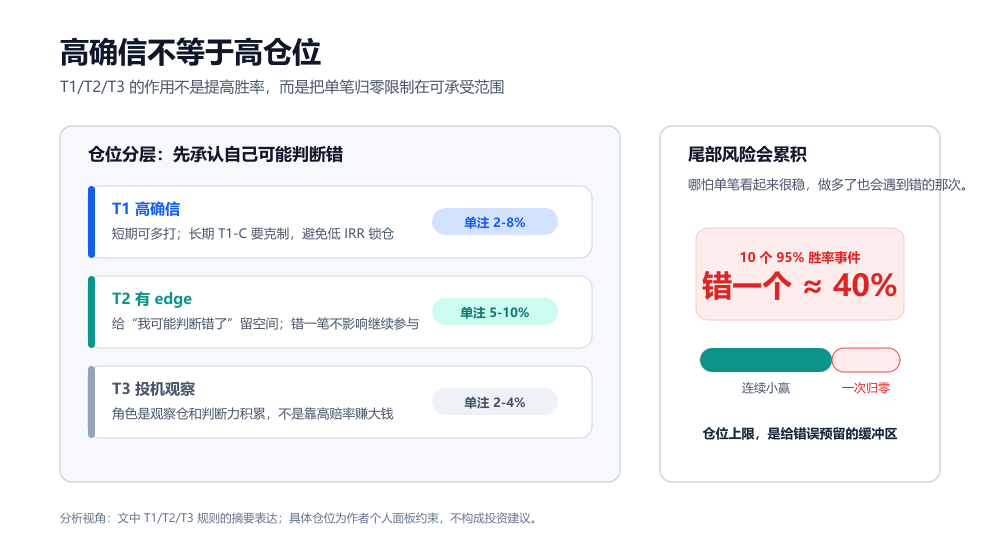
For the author, the position cap is essentially a way to make the cost of being wrong bearable. One counterintuitive but important point is that high conviction does not equal a high position size. Even if an event feels 95% likely to happen, the remaining 5% chance of going to zero still demands a limit. In an extreme example, if someone makes 10 independent bets that each seem to have a 95% win rate, the probability of at least one being wrong is about 1 - 0.95^10, or roughly 40%. The more such bets are made, the more that one wrong outcome appears.
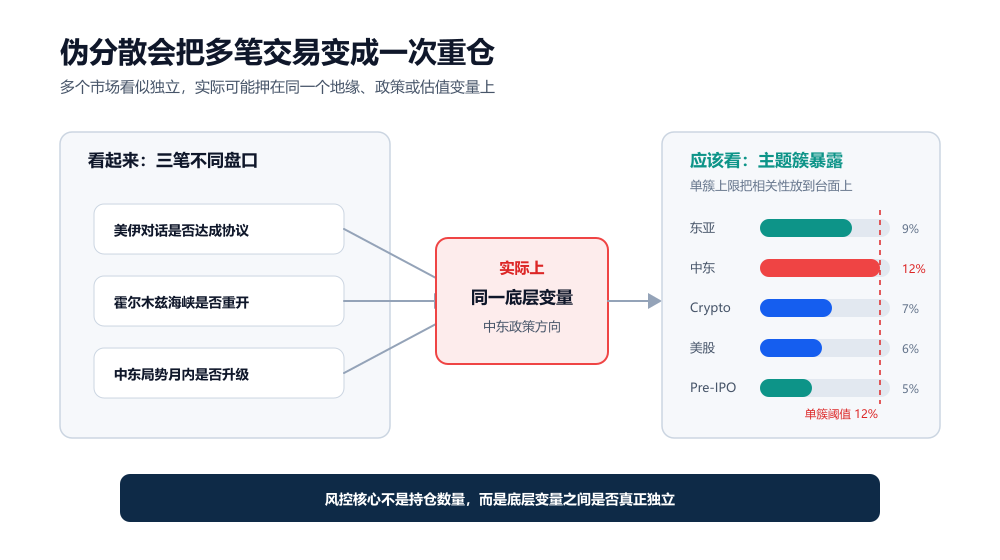
In reality, many Polymarket markets are not independent. They are often correlated. The author gives examples such as 'whether U.S.-Iran talks reach an agreement,' 'whether the Strait of Hormuz reopens,' and 'whether the Middle East situation escalates within the month.' These may look like three separate markets, but their underlying variable is almost the same: the geopolitical policy direction in the Middle East. If the user is wrong on that underlying direction, all three positions can bleed at the same time. This is why the dashboard’s biggest help was not raising the win rate, but preventing a large mistake. Its core value is risk control rather than profit statistics.
Why the author now treats Polymarket more conservatively
After more than half a month of intensive testing, the author’s main feeling is that Polymarket does have opportunities, but it is not the arbitrage venue many people imagine. In on-chain arbitrage, rules are often clearer and price dislocations can be locked in. Polymarket is different. It tests the user’s ability to understand the logic behind shifting narratives in each market. For political and economic dynamics related to East Asia, Chinese-language users can indeed have a degree of information-gap advantage, and this is an area worth exploring. But that does not mean they will win.
The reason is that Polymarket does not settle according to 'the reality you understand.' It settles according to market rules and specified data sources. The author also notes that UMA manipulation issues have appeared repeatedly. In addition, something that looks settled in a Chinese-language context does not necessarily have the same definition under English rules. The rules of individual markets often contain wording traps. Based on the author’s own experience, PM does not offer many pure arbitrage opportunities. It depends more on information gaps and diversified position sizing. Even high-conviction trades can face black swans, and when that happens, the principal is gone.
A friend’s comment shaped the author’s view: 'When it comes to investing, even if there is only a 1% chance of going to zero, you should not rely on luck.' The author now approaches PM more conservatively in several ways. First, it is not treated as a stable income tool. Even after several consecutive wins, the author warns against thinking that a cash machine has been found. The danger of binary markets is that repeated wins can make a user believe they can judge everything, then the final position becomes too large and returns the earlier profits. Second, a high win rate is not the same as a good trade. If an event has a 90% win rate but the market price is already 0.95, it can be negative expected value. Conversely, an event with only a 40% win rate can be positive expected value if the market prices it at 0.20.
Third, tail risk cannot be ignored. Many people see a 10% or 20% return and feel that it is stable, but if a wrong trade means going to zero, then it is not low-risk income in the traditional sense. From this angle, the author even feels that there are no so-called low-risk opportunities on PM; each one is high-risk. Fourth, fake diversification should be avoided. Buying several different markets is not necessarily diversification if those markets share the same underlying variable, as in the Middle East examples above. The author now prefers to treat PM as a training ground for judgment. It fits the author’s daily habit of reading political, economic, technology and financial information, and turns judgments that used to remain at the level of 'I think' into something that can receive feedback.

The author also mentions another tool built with Codex: a private-market valuation monitoring dashboard. It mainly tracks valuation changes in private markets for unlisted unicorn companies such as Anthropic, OpenAI, Stripe and Kraken, and compares those changes with related Polymarket bets. Polymarket is, in essence, an expectations market. Sometimes signals in the private market have already changed while PM prices have not moved. At other times, PM prices move first while real-world data has not caught up. The mismatch between the two is a framework the author wants to keep observing. Still, this is not risk-free arbitrage either. Private-market valuations are not fully transparent, and different data sources can differ. The author says this topic can be written about separately later.
The final message of the review is not 'I made 30% with a dashboard, and you can too.' The more useful point is that a tool can help turn feeling into a framework, and a framework into discipline. In many cases, making money does not prove that a secret method has been found. It only proves that the judgment in that particular round happened to be right.