
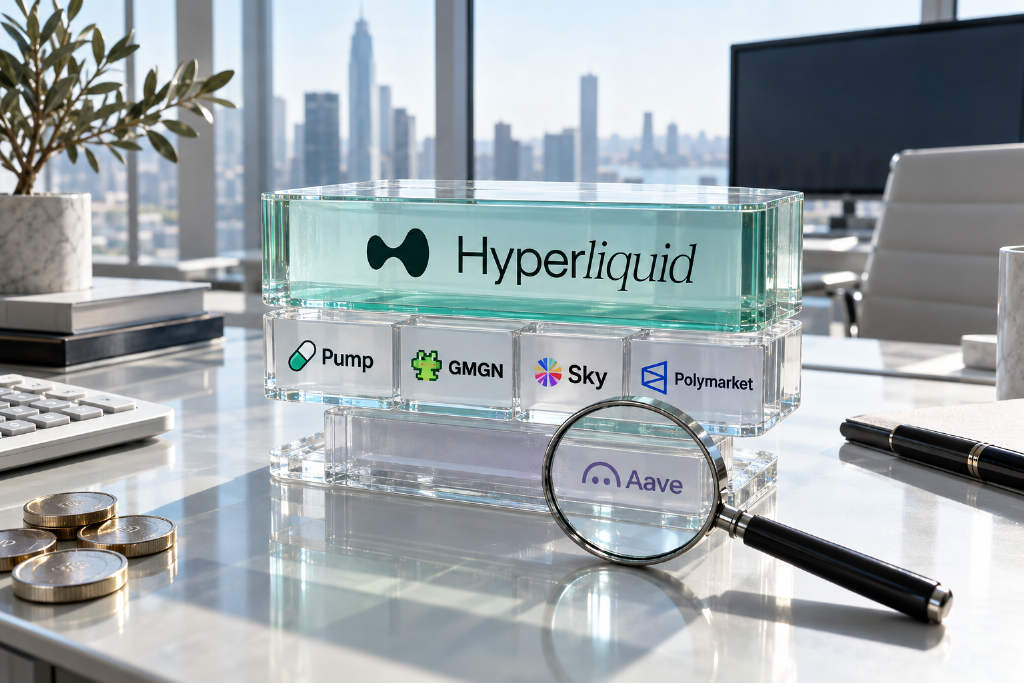
One on-chain trade can pay several businesses at once. According to research by insights4vc, the value extracted from a single user interaction may be split across the application layer, the venue that handles execution, and the network underneath. Looking only at fee leaderboards or token buyback dashboards can give investors the wrong picture of who actually keeps the economics.
TechFlow, which translated the report, highlighted three main conclusions. First, user access and distribution are valuable economic assets on their own, and a trading front end can keep substantial fees without supplying underlying liquidity. Second, buyback spending has to be rebuilt independently rather than taken at face value from dashboard labels. Third, operating costs can materially change the investment case: Aave reported $17.8 million in revenue in the third quarter, but under its disclosed accounting framework, net profit was just $2.4 million after incentives, market-making and service-provider expenses.
How the report defines retained revenue
The ranking uses natural-quarter data through Sept. 30. In the report, retained revenue refers to the economic value left to a protocol treasury, operating entity, or tokenholders after identifiable supply-side subsidies and revenue sharing are removed. It is measured before any undisclosed employee compensation, research and development support, infrastructure spending, or bad-debt losses.
The authors also draw a hard line between income and capital allocation. Money spent on token buybacks comes out of retained revenue; it is not additional revenue. The sample covers financial applications with on-chain activity or fee mechanisms and excludes base-layer blockchains, centralized exchanges, reserve-interest businesses tied to centralized stablecoins, off-chain fund managers and ETPs, as well as physical collectibles. For Polymarket, only the international on-chain venue is counted. The study says explicitly that this is an industry estimate under a specific framework, not an audit-grade census of the full market.
Among the biggest shifts in 2026, GMGN stands out. Its third-quarter retained revenue was more than four times its second-quarter figure, while Sky and Polymarket were broadly steady. The top ranks for the first nine months include both high-growth trading-service businesses and more stable financial intermediaries.
Hyperliquid: liquidity as a paid privilege
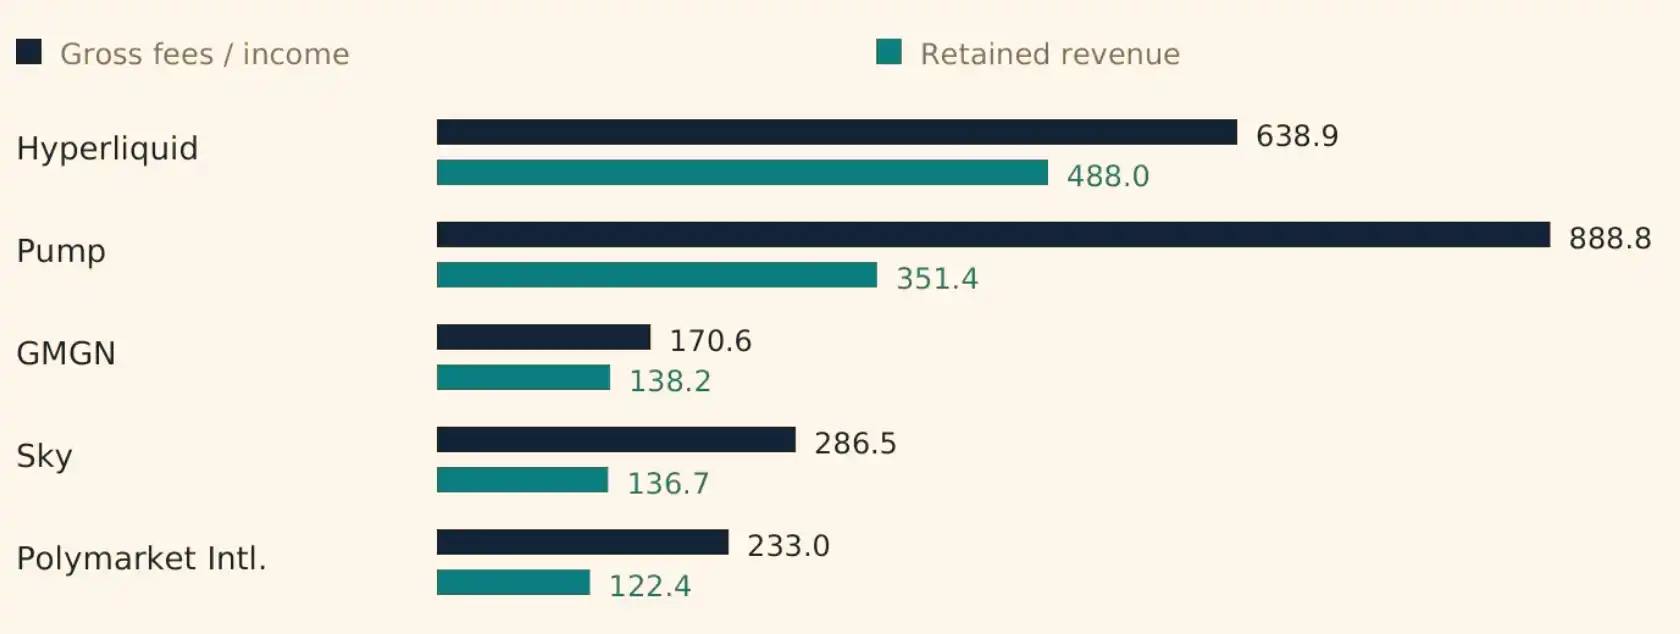
Hyperliquid sits at the top of the ranking after vertically integrating its matching engine with dedicated infrastructure. The rebuilt figures show $638.9 million in total fees and gross revenue, of which $488 million remained as economic value for the protocol and holders. In the third quarter alone, retained revenue reached $174 million, up 17.0% from the previous quarter. The report treats that as evidence of large commercial scale, while stopping short of calling it a fully loaded operating margin.
The core moat, the study argues, is not code. It is the combination of a deep order book, trader trust, and market microstructure. Users are paying for immediate liquidity, strong execution, and increasingly differentiated market access. Software can be copied. Moving all participants in a two-sided market at the same time is a different problem.
That logic runs through Hyperliquid’s product design. The report says the HIP-3 growth model cuts protocol-layer parameters by 90% and lets deployers retain an independent share of revenue. More trading activity, in other words, does not have to translate one-for-one into retained revenue for the protocol itself because ecosystem builders can hold their own claim on the economics.
Blockworks also identified what the report calls a second commercialization engine. Since its launch in April, the read-write priority auction mechanism has generated $5.07 million in revenue. Over the past 30 days, it contributed $2.75 million, or 6.7% of estimated revenue. The implication is direct: high-frequency traders are paying real money for earlier information access and better execution priority.
The report compares that trajectory with the Chicago Mercantile Exchange. In 2002, CME reported $453.2 million in net revenue, including $48.7 million from quote-data fees. Average revenue per trade fell from $0.71 to $0.64, yet trading volume rose 35%. Deep liquidity and strong distribution allowed lower unit pricing to coexist with a larger business. Hyperliquid, the authors argue, faces the same commercial question: how to monetize privileged access fast enough to outpace long-term compression in base trading fees.
Pump: a toll collector built on distribution
Pump recorded $888.8 million in gross fees in the first nine months of the year and retained $351.4 million. The $537.4 million gap largely went to creator payouts, liquidity-provider incentives, and related support channels. By the third quarter, gross fees had climbed 80.1% quarter over quarter, but retained revenue increased 50.4%, with the capture rate falling from 43.2% to 36.0%.
The report frames Pump as more than a token issuance factory. It is a distribution machine. A steady stream of new assets keeps speculation alive, while creator rebates and an embedded trading terminal keep users inside the ecosystem. In that model, the business depends on repeated turnover and the fees attached to it, not on the fate of any single token.
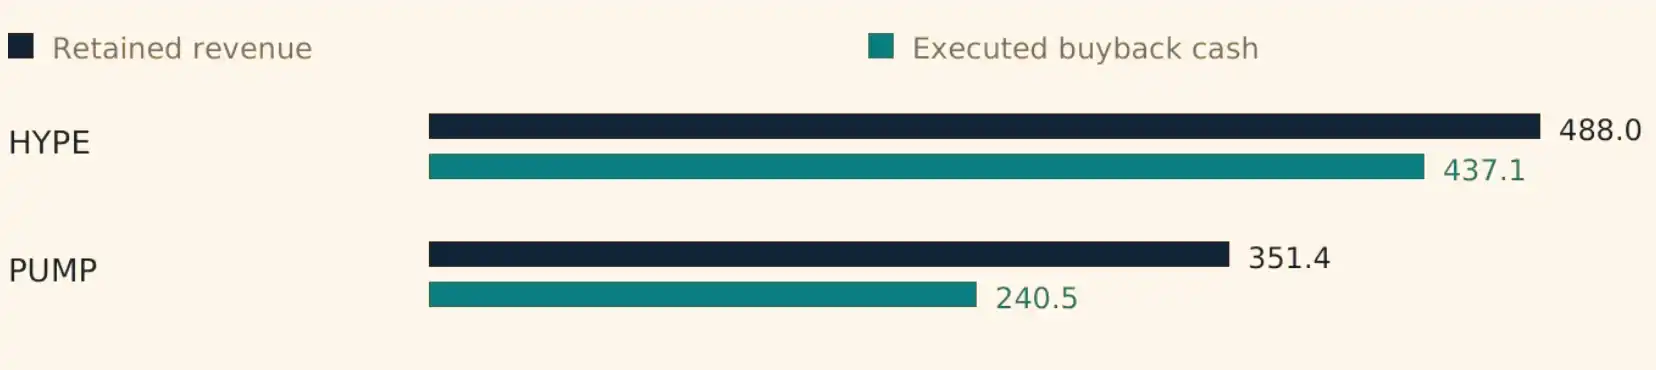
The study also warns that cash spent on buybacks and the number of tokens retired can move in opposite directions. Hyperliquid is used as an example: third-quarter buyback spending rose 5.7%, but the amount of HYPE acquired fell 26.4%, to 2.04 million from 2.77 million. When a token price rises, a larger cash budget can still retire a smaller share of supply.
GMGN: the front end itself becomes the business
GMGN is the clearest example in the report of distribution turning into an independent profit center. It charges a 1% processing fee on top of base-chain gas and venue slippage. Users, in the authors’ telling, are paying for faster discovery of hot assets, monitoring of smart whitelist addresses, and a streamlined trading experience.
The figures are striking. GMGN generated $170.6 million in gross fees in the first nine months and retained $138.2 million after rebates. The third quarter alone contributed $86.3 million, up 355.8% from the prior quarter. That shows how effectively an application layer can monetize traffic even without owning the liquidity pool underneath.
Still, the report does not treat that capture rate as proof of durable loyalty. GMGN’s economics are closely tied to bursts of trading mania. It also makes a separate point about ownership: based on public information available today, there is no native token with a direct claim on most of those profits. Investors should evaluate a successful distribution front end first as a company, the authors say, rather than assuming the upside automatically accrues to a publicly traded token.
Sky: a spread business with steadier economics
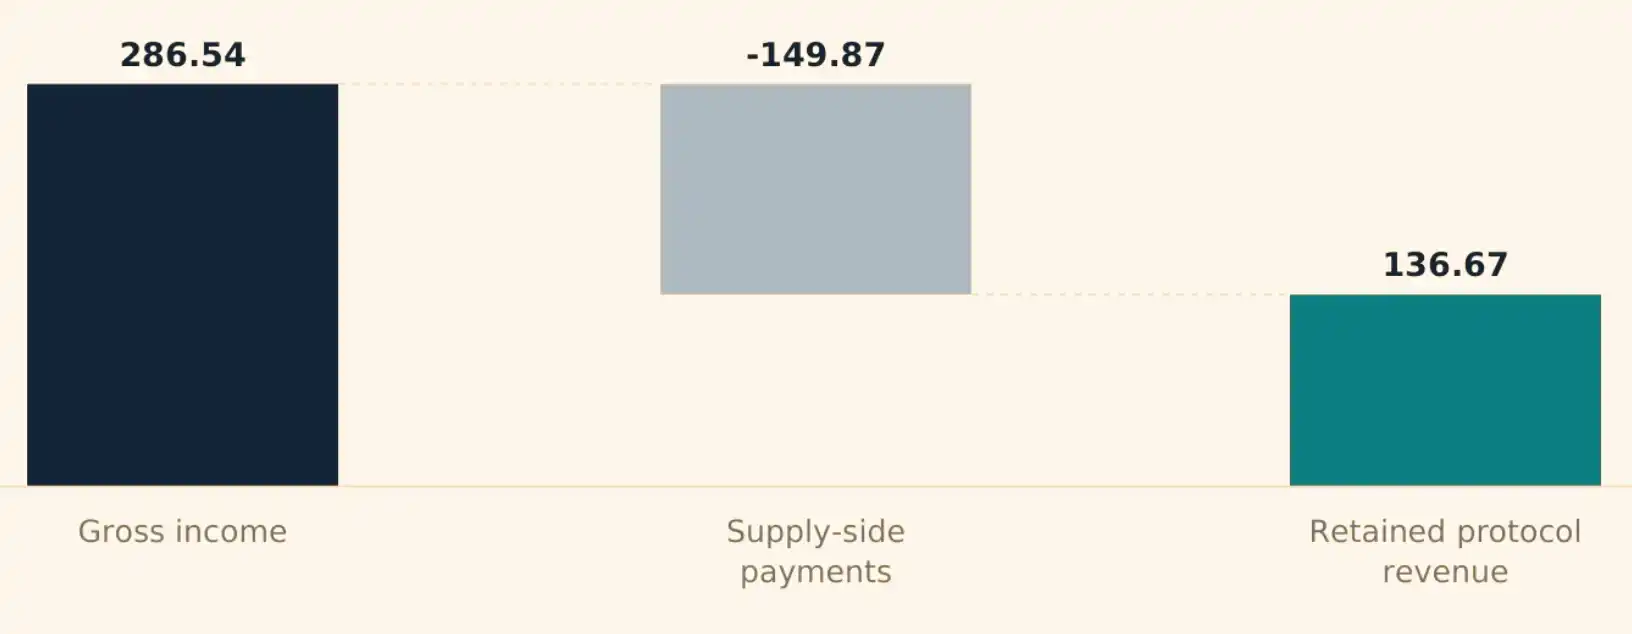
Sky is built on the spread between funding costs and asset yields. Over the first nine months of 2026, the report estimates $286.5 million in gross revenue and $149.9 million in supply-side funding costs, leaving retained revenue at $136.7 billion. Third-quarter retained revenue came in at $41.8 million, down 1.8% from the previous quarter, which the report presents as evidence of strong resilience across market cycles.
To put the model in context, the authors point to Charles Schwab. In 2019, Schwab moved online stock trading to zero commissions, but still posted $6.516 billion in net interest income, equal to 61% of total revenue. The message is simple: earning spreads on customer balances and yield-bearing assets remains one of the oldest and most durable business models in finance.
Polymarket: attention does not guarantee monetization
Polymarket’s international platform generated $233 million in total fees in the first nine months and retained $122.4 million. In the third quarter, total fees rose 10.4%, yet retained revenue fell 1.7%, pulling the capture rate down from 55.9% to 49.8%.
The report ties that mismatch to the platform’s own fee rules. Trades tied to geopolitical and macro international events are exempt from fees. The highest-profile, most widely shared prediction markets may therefore do little to support the platform’s core revenue base. On top of that, Polymarket has to pay meaningful incentives to market makers and referrers in order to keep spreads competitive. The report adds that pUSD, used as collateral, carries no equity-like claim, so platform attention should not be conflated with tokenholder returns.
Buybacks require four separate checks
The study argues that token buybacks can only be understood by tracking four variables separately: the actual dollars spent, the number of tokens bought, the amount permanently burned, and the floating supply that later returns through unlocks. A dashboard that shows only the nominal dollar value of burned tokens can be highly misleading.
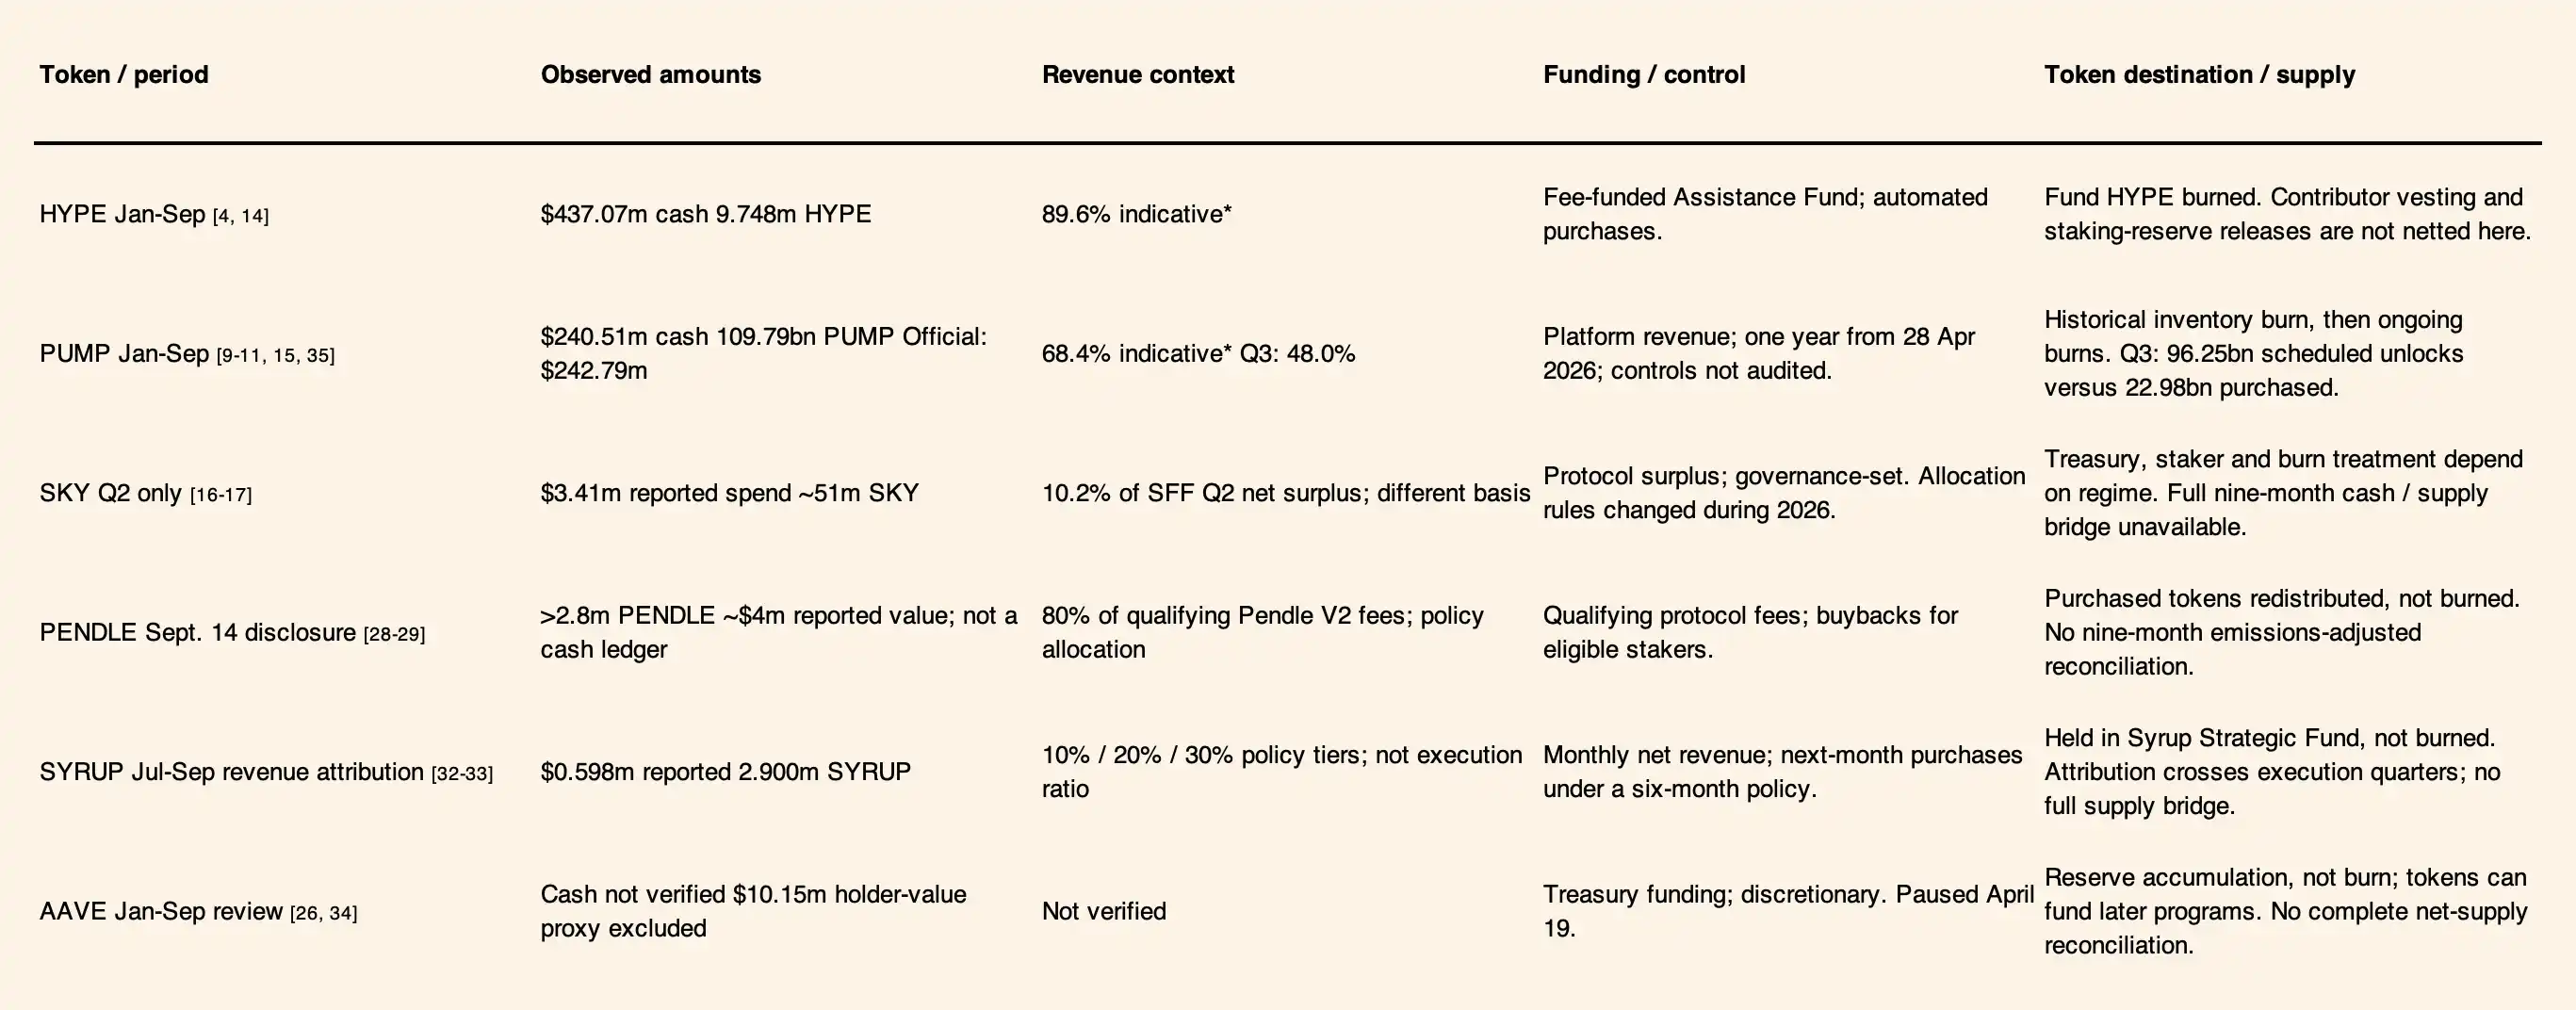
Pump is the report’s main example. It spent roughly $240 million on cash buybacks in the first nine months, close to 68% of protocol retained revenue. But Blockworks estimated that team and investor unlocks in the third quarter reached 96.25 billion tokens, far above the 22.98 billion tokens repurchased and retired during the same period. Large burns and an expanding effective float can happen at the same time.
Aave’s accounts show what costs do to the story
Aave appears in the report as an example of stronger financial transparency. The protocol booked $17.8 million in third-quarter revenue, but infrastructure-provider expenses, security-module incentives, market-making subsidies and insurance reserves added up to $15.4 million in operating costs. Net profit came to $2.4 million.
The broader point is not that Aave’s position in decentralized lending is weaker. The report says the opposite: headline fee rankings and the net free cash flow that ultimately reaches investors can be very different things. The strongest on-chain business models tend to control scarce liquidity, a distribution network, or access to dollar funding. For investors, the work is to identify which asset claim actually captures the residual value.