

Web3 business models are being judged on revenue quality
MarsBit has published an analysis by Eric SJ that frames Web3 as moving from a user-growth phase into a period focused on business model validation. The article looks past headline revenue and asks what actually drives it, how durable it is, and whether the model can defend itself over time.
The five models discussed are trading fees, stablecoin reserve income, interest spreads, block space sales, and protocol-level service fees.
The author uses a simple formula: revenue = user demand × usage scale × pricing power × market environment. In that framework, the same $100 million in annual revenue can mean very different things. It may reflect a real business loop, or it may only show that a project happened to catch a favorable market cycle.
Trading fees rise and fall with market activity
Trading fees are presented as the most straightforward Web3 model. Revenue here is simply trading volume multiplied by the fee rate.
That makes volume the clearest variable. In bullish periods, rising asset prices, stronger trading interest, and more leverage demand can quickly lift revenue for CEXs, DEXs, and perp DEXs. In weaker markets, both trading activity and leverage demand tend to cool, and fee income drops with them. The article describes this as the core reason trading-fee models are so cyclical.
Even so, higher volume on its own does not prove that a business loop has become stronger. The author draws a line between real user growth and traffic pulled in by short-term incentives.

Hyperliquid @HyperliquidX is used as an example. According to the article, its future revenue growth will depend not only on the size of the perpetual futures market but also on whether it can keep attracting on-chain traders and market makers, because trading venues are ultimately competing on liquidity networks rather than product features.
Fee rates matter too. Platforms cannot raise fees without limit, since fees themselves are part of the competitive toolkit. Lower fees, fee rebates, and user incentives can all cut into final revenue when competition gets tougher.
The article says long-term growth in this model requires three things at once: a larger market, a higher share of that market, and fee rates that remain stable.
It also points to the zero-fee tactics used by early DEXs and some current perp DEXs to attract capital and trading flow. The harder question comes later: once fees return to normal levels, will that liquidity stay?
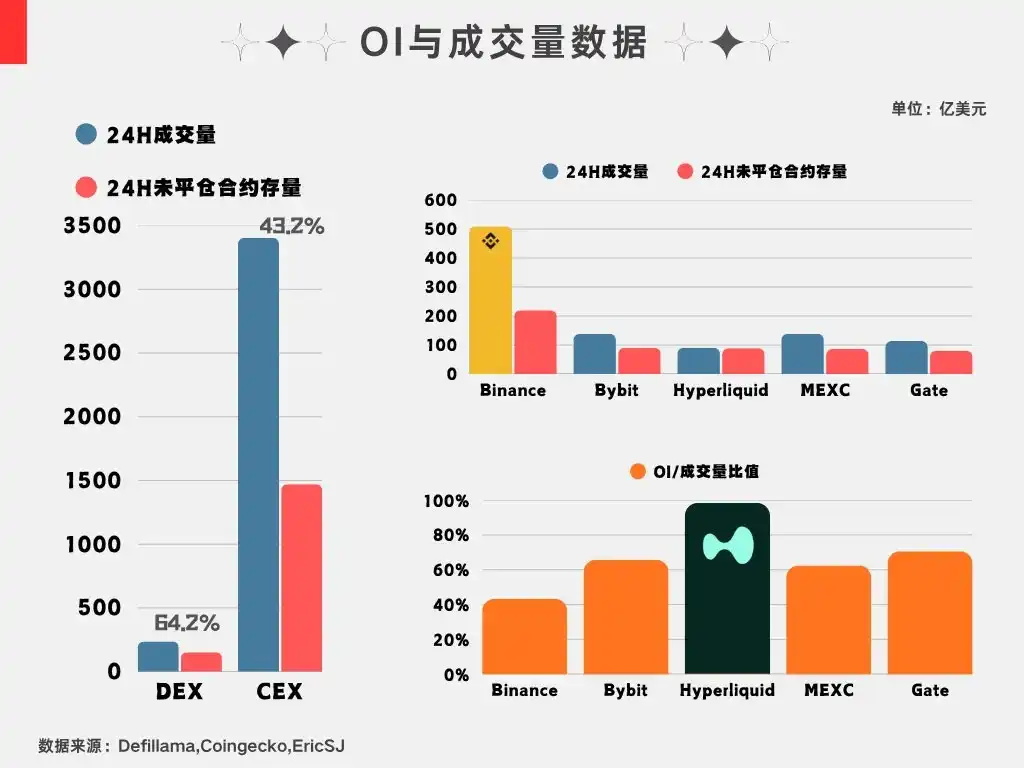
Eric SJ adds that open interest, or OI, is a useful reference point. Based on OI data the author compiled last month, limited overall changes can, to some extent, show whether capital is willing to keep its risk exposure concentrated in one venue.
Stablecoin income depends first on scale, then on rates
For stablecoins, the formula is reserve income = stablecoin supply × reserve asset yield.
Scale is the main variable, the article says. Revenue at USDT and USDC comes from how much dollar-denominated value sits on-chain. If supply expands and reserves grow, income rises. If scale shrinks, revenue comes under pressure.
The piece cites Tether’s first quarter of 2026 and says the company generated about $1.04 billion in net profit at that scale. From there, the argument shifts to positioning: the real competition is not just about issuing more tokens, but about becoming the dollar infrastructure of crypto. In the current compliance setting, whichever stablecoin becomes the entry point for issuance can build a thicker moat.
The second variable is the rate environment. Stablecoin issuers usually hold U.S. Treasuries, money market funds, and cash equivalents, so their income is tightly linked to risk-free rates. Higher rates lift reserve returns. Lower rates cut into them.
Still, the article argues that this model avoids the sharp swings seen elsewhere. Growth is more predictable, and once large pools of capital enter, they usually do not move quickly. Brand history matters as well. The longer a stablecoin has been tested in the market, the harder it becomes for newer entrants to take share.
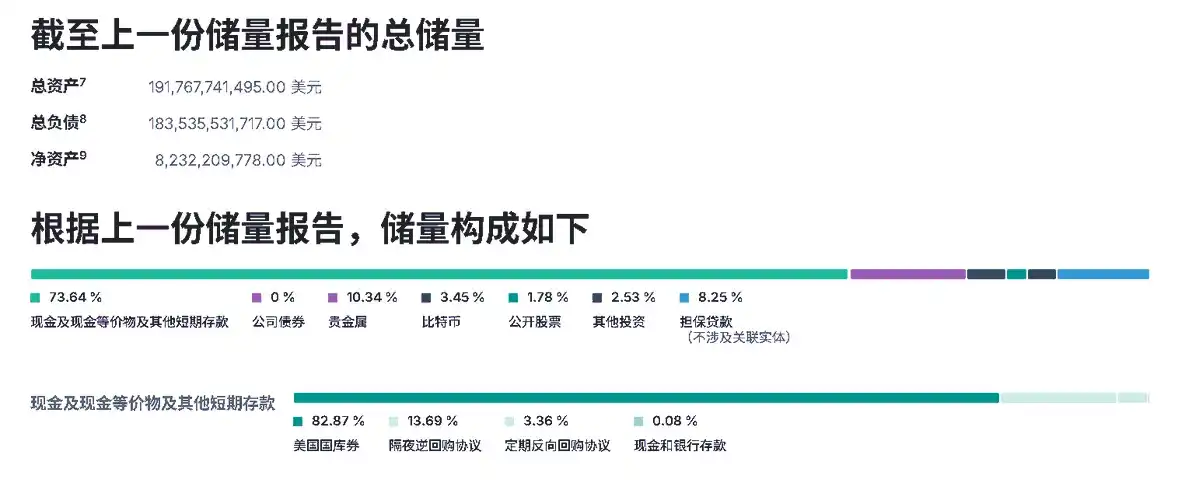
The author adds that as new channels open for traditional capital to enter on-chain markets, any project that becomes that gateway can turn into a stable cash-generating business.
Interest-spread models track capital demand and risk appetite
On interest spreads, the article groups together examples such as Aave lending and Ethena funding-rate arbitrage. In both cases, the core idea is to monetize differences in capital supply and demand.
Using Aave as the example, the author says revenue comes from borrowing demand. In upcycles, users tend to take on more risk and use lending to increase leverage. That raises utilization and supports protocol income.
The pattern looks a lot like trading fees. In both models, the underlying driver is the same: risk appetite in on-chain capital markets.
Block space sales face a pricing problem
The revenue model for block space is described as block demand multiplied by gas price per unit.
In theory, more users, more transactions, and a broader app set should mean stronger demand for block space and more revenue. A highway no one uses has no toll value.
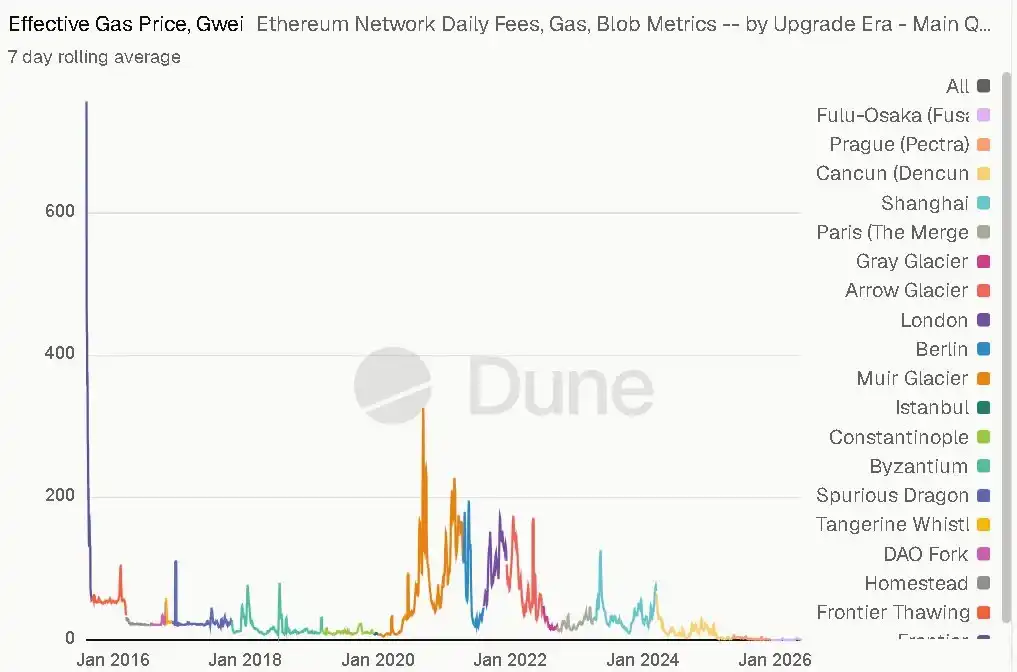
But the article argues that gas pricing is the weak point. Over time, gas prices have tended to move lower, and competition across Ethereum, Solana, layer-2 networks, and data-availability layers has intensified that pressure. Some chains have even run zero-gas campaigns to attract liquidity and lift activity.
That creates a direct tension between growing demand and falling unit prices. Users benefit because transactions get cheaper. Chains acting as suppliers of block space do not. Their unit revenue falls.
The article uses Ethereum to illustrate the shift. Two cycles ago, the logic was more direct: limited block space led users to compete for transaction ordering, demand rose, gas went up, and network revenue followed. As more chains appeared, execution improved, and alternatives multiplied, gas prices were pushed down.
Eric SJ compares this with the evolution of internet infrastructure. Bandwidth was scarce and expensive early on, then expansion drove prices lower. In that setup, long-term value did not stay only with the provider of the underlying resource. It moved toward those with users, ecosystems, and platform power.
That leaves one central question for block space as a business model: can growth in demand offset the decline in unit pricing?
Protocol service fees depend on standard status and ecosystem position
The final model in the article is protocol-level service fees, described as a Web3 version of SaaS. Oracles are the main example.
This revenue mostly comes from business users, meaning projects that continue to rely on the service. The more teams that integrate it, the larger the income base becomes. Switching costs also rise once the service is embedded.
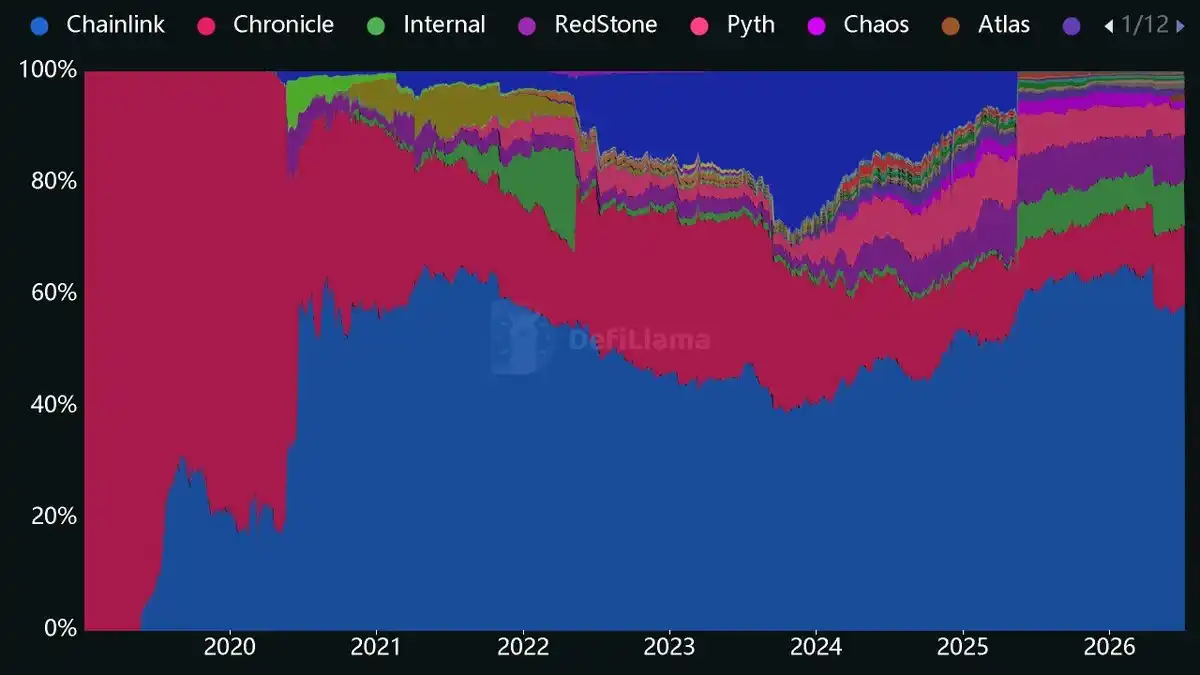
That advantage only holds if the protocol becomes the market standard. Chainlink is cited as the current example. The article says it controls well over half of the oracle market, leaving limited room for rivals and giving it a thick moat. Even a cheaper competing product may struggle to displace established business-side integrations.
In the author’s view, infrastructure in this category is not selling a one-time product. It is selling ecosystem position, and the long-term value depends on whether more projects continue to build around it.
Three conclusions from the five-model comparison
- Trading fees and interest spreads are strongly cyclical, and both are driven at the base layer by on-chain capital’s risk appetite.
- Stablecoin reserve income and protocol service fees can build thick moats once they work, largely because supply-side switching costs are high.
- Block space sales face a continuing decline in unit pricing, so scale and pricing have to be judged together. The article says valuing these businesses on revenue alone is, at least for now, not a sound approach.