

Bitcoin is still moving through a daily b-wave correction this week, according to an Odaily featured analysis, with price falling to as low as $62,268. The report said the central question now is whether BTC can find support in the $60,900-$61,500 area, which it described as the key zone for validating the current structure.
HYPE, meanwhile, has moved close to the end of its daily C-wave decline. The analysis placed its main support at $50-$52 and said oversold signals have been triggered repeatedly, leaving room for a short-term repair move even though direction has not yet been confirmed.
What the report focused on this week
The article was organized around four main sections: a multi-timeframe structure review for BTC, this week’s BTC outlook and medium- to short-term trading plans, a daily structure analysis for HYPE, and this week’s HYPE outlook with short-term strategy. It also included a review of last week’s short-term trade and how prior market calls played out.
- BTC multi-timeframe structure analysis
- BTC outlook for the week and medium- and short-term strategy
- HYPE daily structure analysis
- HYPE weekly outlook and short-term trading plan
How last week’s views matched market action
The report said last week’s BTC call was to watch the strength of support if price moved into the $60,950-$61,500 area. In the market that followed, Bitcoin dipped to around $62,268 and then rebounded, which the author described as confirmation of that earlier view.
On short-term execution, the article said Bitcoin completed one short trade last week using 1x leverage, with a profit of about 2.58%.
For HYPE, the piece said last week’s analysis laid out two possible technical paths. It said actual price action has so far tracked the second path more closely: the correction did not end at $56.47, and price instead formed a lower trading center before extending the decline.
Bitcoin daily structure: a five-leg correction, with b-wave still in progress
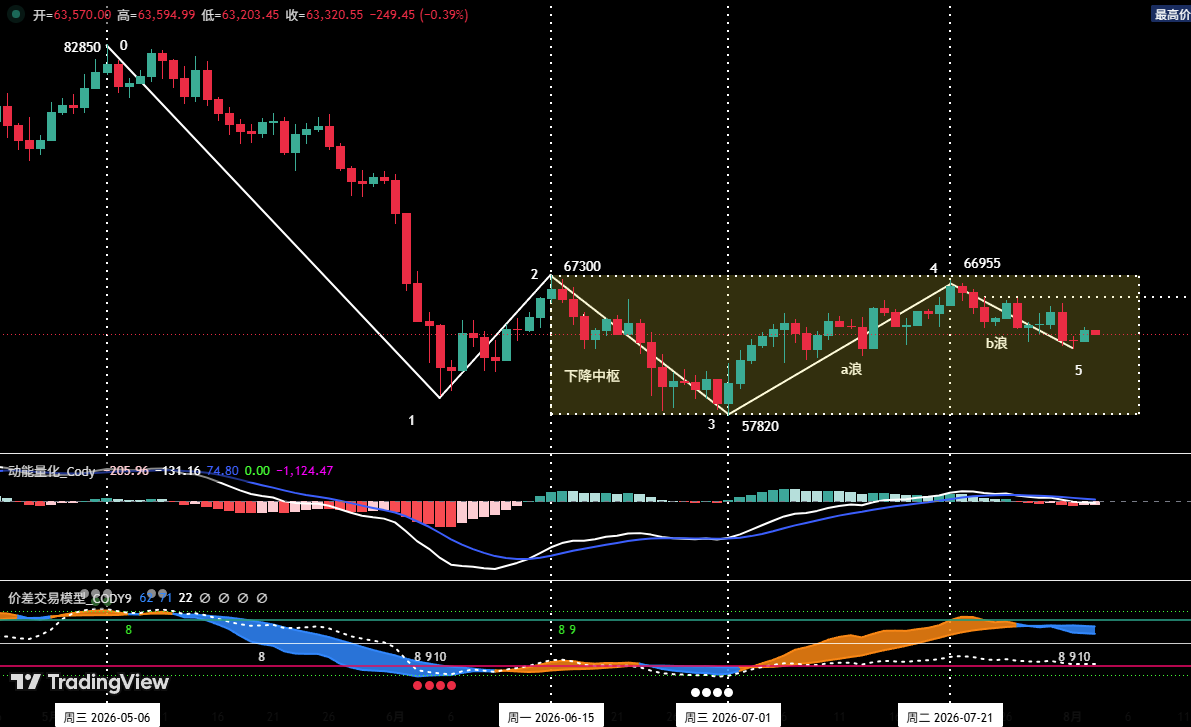
Based on price action since May 6, the article said Bitcoin’s correction from the May 6 high of $82,850 has developed into a five-part structure on the daily chart: (0-1), (1-2), (2-3), (3-4), and (4-5).
Looking only at the rebound that started from the July 1 low, the analysis broke the move into an a-wave, a b-wave, and a potential c-wave:
- a-wave rebound: from about $57,820 on July 1 to about $66,955 on July 21, lasting 21 days, with a maximum gain of about 15.8%.
- b-wave pullback: from about $66,955 on July 21 to the present. The report said it has run for 12 days so far and reached a low of $62,268. The pullback is now close to 61.8% of the a-wave rebound, with the Fibonacci level near $61,310, so the report said the b-wave has largely met its technical requirement in terms of magnitude.
- potential c-wave rebound: if the b-wave ends without breaking below the a-wave low of $57,820, the market could start a c-wave rebound that may retest resistance near $67,300.
Bitcoin on the 4-hour chart: whether $62,268 holds matters
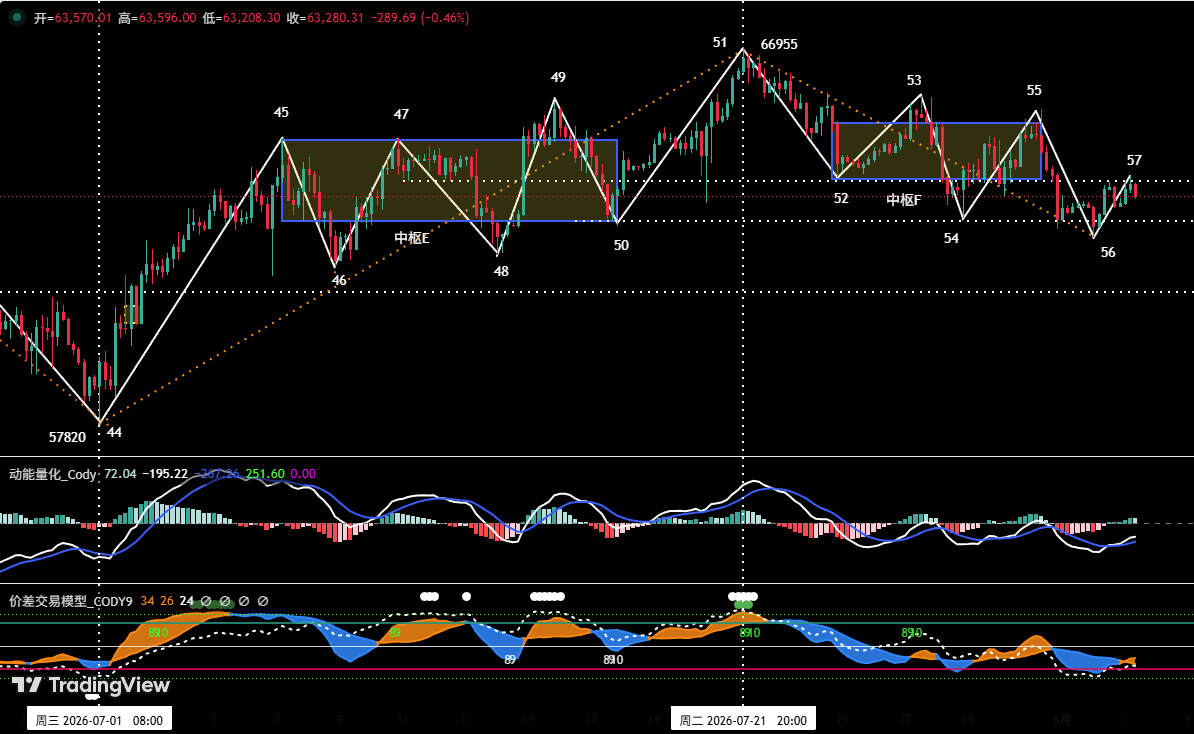
On the 4-hour chart, the report divided the daily b-wave correction that began from the July 21 high, marked as point 51 near $66,955, into six segments running from (51-52) to (56-57). It said segments (52-53), (53-54), and (54-55) overlapped and together formed central structure F.
The market is currently described as trading in the (56-57) rebound leg. According to the article, if BTC does not break below point 56 and can establish itself above $63,600 before extending higher, the odds would increase that the daily b-wave ended at point 56, near $62,268. If that does not happen, the market may continue to probe lower, with focus returning to support in the $60,900-$61,500 area.
BTC outlook for the week: support first, then watch $63,600
The core call for BTC this week is whether the daily b-wave correction can finish above the $60,900-$61,500 zone, with one condition attached: the correction low must not break below $57,820.
The report listed the following resistance levels:
- First resistance: around $63,600
- Second resistance: $65,700-$67,300
- Third resistance: $69,500-$71,000
It listed the following support levels:
- First support: $60,950-$61,500
- Second support: around $57,820
BTC strategy: medium-term short exposure at 40%, with two short-term scenarios
Assuming no sudden news shock, the article set out both medium-term and short-term strategy.
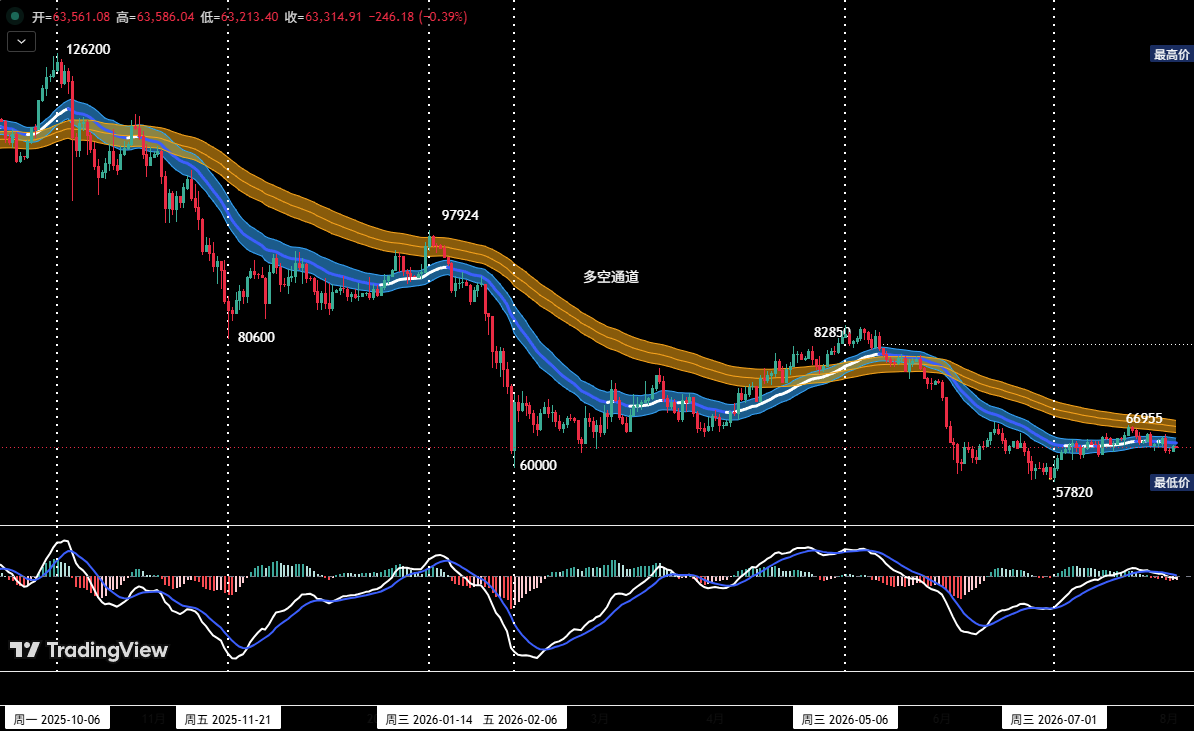
For the medium-term view, the author said a position-monitoring model shows BTC has already fallen decisively below a bull-bear channel, confirming a market structure led by bears. Medium-term short exposure was put at about 40%. If price can move firmly above $63,600 and keep rebounding, the report suggested cutting medium-term short exposure to below 20%.
For short-term trading, the article suggested using 30% of capital, setting stop losses, and looking for spread opportunities based on support and resistance, using 30-minute or 60-minute timeframes.
It then laid out two scenarios:
Plan A: test long positions after price stabilizes above key support
- Entry: if BTC keeps rebounding early in the week, holds above $63,600, and is backed by signals from the quantitative model, traders may build a long position of about 30%.
- Risk control: set an initial stop-loss level.
- Exit: reduce and close the position gradually near major resistance if model signals align.
Plan B: light long positions near strong support
- Entry: if BTC continues to correct but shows signs of stabilization above the prior low of $57,820, and if the model flashes a bottom signal, traders may build a long position of about 30%.
- Risk control: set an initial stop-loss level.
- Exit: close gradually when price rebounds into major resistance and model signals line up.
HYPE daily structure: an A-B-C correction now near key support
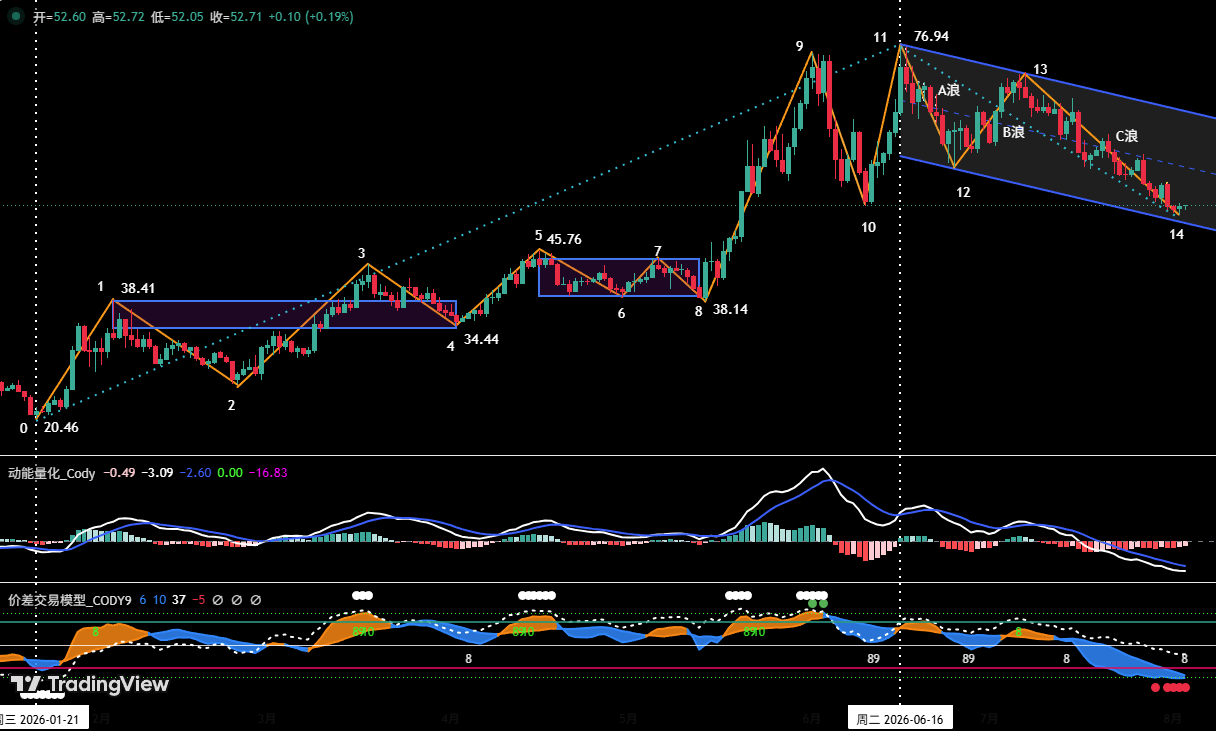
For HYPE, the report said the pullback that began at the June 16 high of $76.94 has developed into a clear A-B-C structure on the daily chart.
- A-wave decline: from about $76.94 on June 16 to about $58.50 on June 25, lasting 9 days and totaling a 23.97% drop.
- B-wave rebound: from about $58.50 on June 25 to about $72.97 on July 7, lasting 12 days with a rebound of 24.74%.
- C-wave decline: from about $72.97 on July 7 to the present, now running for 27 days and reaching a low of $51.11.
The article said the daily C-wave has now fallen into the key $50-$52 support area. After the extended decline, several technical indicators have entered oversold territory, and the report’s in-house spread-trading model has repeatedly flashed bottom warnings in red dots. On that basis, the article said the market has a technical need for a short-term repair move. It added that current levels are not suited to chasing shorts blindly and said traders should wait for a confirmed daily D-wave rebound signal.
HYPE outlook and short-term plan for the week
The core question for HYPE this week is still how price behaves around support in the $50-$52 range.
The report listed these resistance levels:

- First resistance: $58.5-$60
- Second resistance: $63.5-$66
- Third resistance: around $72.97
It listed these support levels:
- First support: $50-$52
- Second support: around $45
For short-term trading, the article said that if HYPE shows signs of stabilization in the $50-$52 area, investors may consider light long exposure, keep position size below 20%, and follow stop-loss discipline strictly.
BTC short-trade review: the report put profit at about 2.58%
The article also walked through a short BTC trade completed last week. It said the trade was based on signals from the spread-trading model and the momentum quant model, with total profit of about 2.58%.
The trade record was presented in Table 1, described in the source as a summary of Bitcoin short-term trading details using 1x leverage.
According to the review, the short entry was based on two factors. First, BTC showed signs of stalling near $65,700 and the candlestick pattern formed a local top. Second, the spread-trading model triggered a strong top warning, marked by a white dot and a green dot, after which the blue signal band in the chart broke below the green skyline and issued a downside signal. That signal also aligned with a correction signal from the momentum quant model. On that basis, the article said a 30% short position was opened at $64,700.
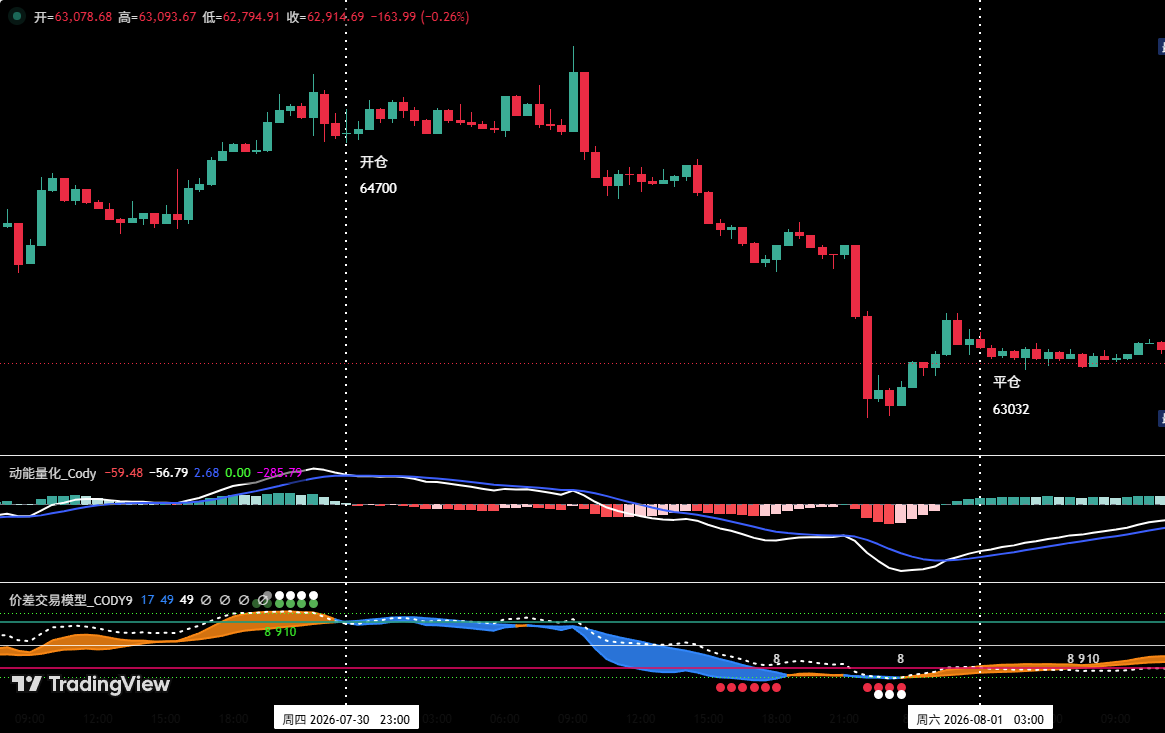
The exit logic also had two parts. First, BTC showed signs of stabilization above $62,000 and formed a local bottom pattern on the chart. Second, the spread-trading model repeatedly flashed bottom warnings, marked by a white dot and a red dot, and the orange-yellow signal band then broke above the purple-red horizon, aligning with a bottom resonance signal from the momentum quant model. Based on those conditions, the report said the position was fully closed near $63,032.
The result, according to the source, was a gain of about 2.58%.
Risk notice at the end of the article
The piece ended with four trading-discipline reminders:
- Set an initial stop-loss immediately after opening a position.
- When profit reaches 1%, move the stop-loss to the entry cost.
- When profit reaches 2%, move the stop-loss to the level that locks in 1% profit.
- After that, for every additional 1% in profit, move the stop-loss higher by 1% as well.
The author also said financial markets change quickly and that all views, analytical models, and trading strategies in the article come from personal technical analysis and are intended only as a personal trading log. The article said they do not constitute investment advice or an operational basis for decisions, and it warned that markets carry risk.