

A guest analysis published by Odaily says Bitcoin is still advancing in a daily c-wave rebound from the $62,268 low, with the market now approaching a key test at the $65,700 to $67,300 resistance zone. The report says this area will be central to validating the current structure. It also says HYPE has found support at the intersection of a long-term rising trendline, the lower boundary of a descending channel, and the $50 to $52 support band, where an early daily rebound signal has started to appear. Whether that move can hold and push toward the upper boundary of the channel remains unconfirmed.
The article also looks back at last week’s calls. It says the previous view was that Bitcoin’s short-term daily b-wave correction would most likely end above the $60,900 to $61,500 area, and that the market has so far moved in line with that expectation. On trading results, the analysis says one short-term BTC long using 1x leverage was completed last week for an estimated return of about 2.28%. For HYPE, the report says the earlier call for price to stop falling and stabilize in the $50 to $52 zone has also been validated by current trading.
Bitcoin daily structure: c-wave rebound remains in play
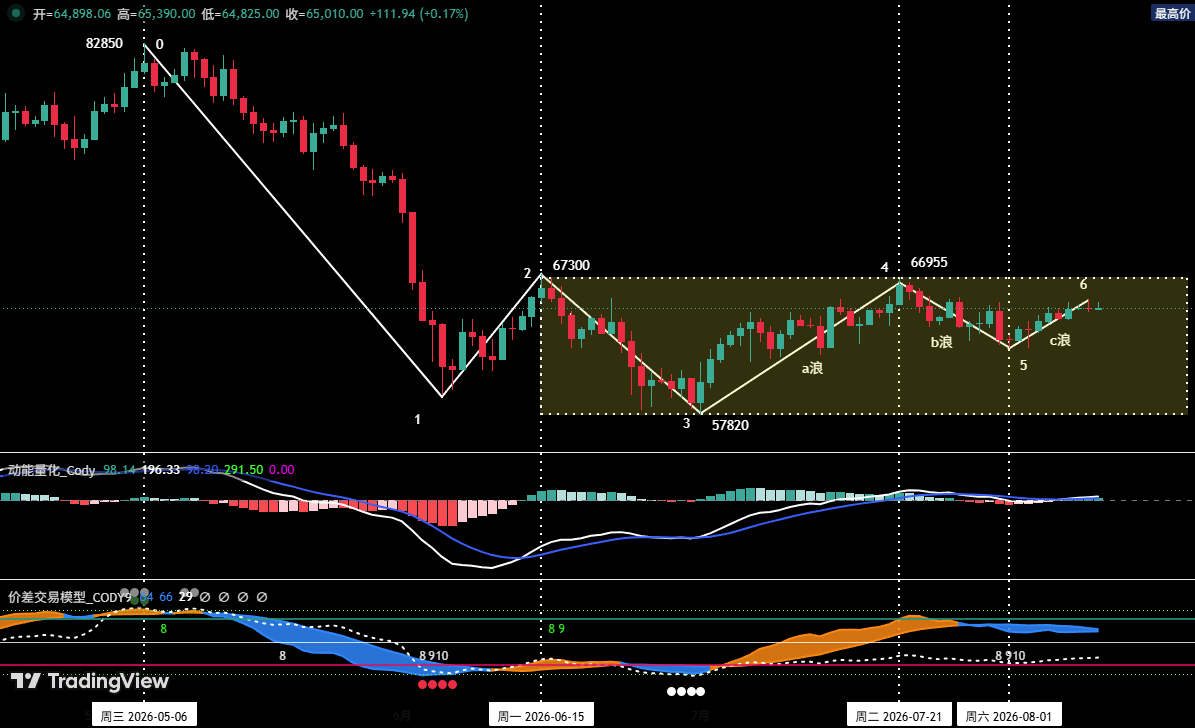
In the report’s daily chart framework, the correction that started from the May 6 high of $82,850 has developed into a six-leg structure labeled (0-1), (1-2), (2-3), (3-4), (4-5), and (5-6).
From the July 1 low onward, the move is broken into three parts:
- a-wave rebound: from July 1 to July 21, price rose from $57,820 to $66,955 over 21 trading days, a gain of 15.8%.
- b-wave correction: from July 21 to Aug. 1, price fell from $66,955 to $62,268 over 11 trading days, with a maximum drawdown of 7%.
- c-wave rebound: from Aug. 1 to the time of writing, starting at $62,268 and running for eight trading days.
Based on what the article describes as its self-built quantitative model, the daily b-wave correction ended at $62,268 and the c-wave rebound has formally begun. The first target is set at the $67,300 resistance area. If price breaks that zone effectively, the next area to watch is $69,500 to $71,000.
Four-hour structure: rebound high has reached around $65,474
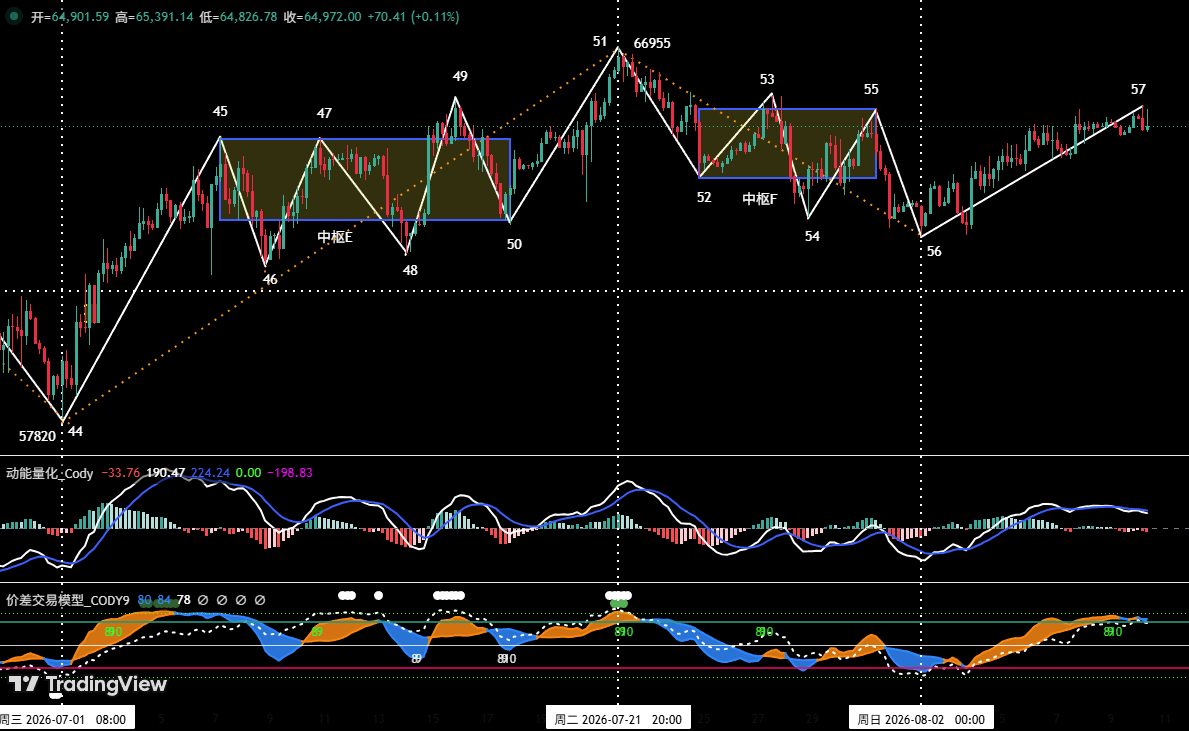
On the four-hour chart, the decline from $66,955 to $62,268, which the article classifies as the daily b-wave correction, is split into five legs from (51-52) to (55-56). It says legs (52-53), (53-54), and (54-55) overlap and form a center labeled F.
The rebound from $62,268, which is mapped as the daily c-wave advance, corresponds to the four-hour (56-57) up-leg. According to the article, that rebound had lasted 49 four-hour periods at the time of writing, with the high reaching around $65,474. The report says the structure remains intact from a time-and-space perspective and that rebound momentum is relatively strong.
BTC levels and trading plans for the week
The report frames this week’s main Bitcoin focus as the fight between bulls and bears in the $65,700 to $67,300 area.
Resistance levels
- First resistance zone: around $67,300
- Second resistance zone: $69,500 to $71,000
Support levels
- First support: $63,600 to $64,000
- Second support: $60,950 to $61,500
- Third support: near $57,820
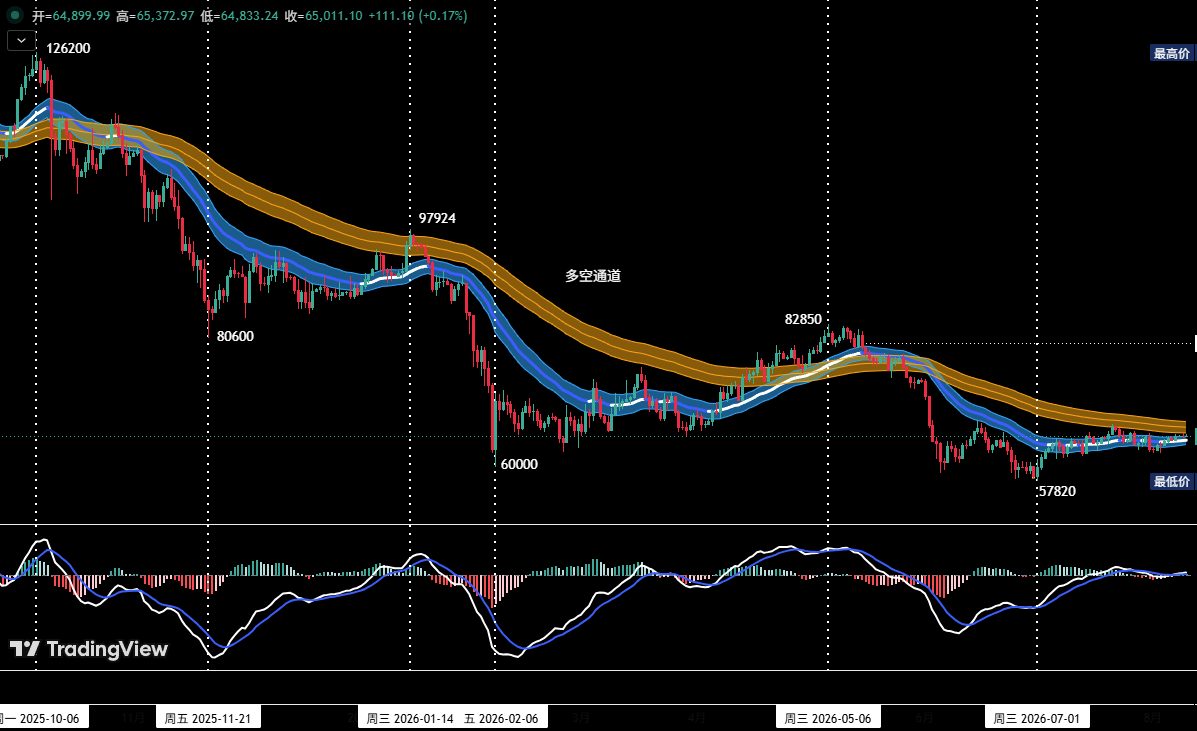
In its medium-term plan, the article says a position-monitoring model shows the price has already broken below a bull-bear channel, confirming a market structure led by bears. Under the plan set last week, if Bitcoin could hold above $63,600 and continue rebounding, medium-term short exposure would be reduced to below 20%. The article says positions have now already been cut to below 20% under that plan.
The next medium-term response, according to the report, would come if Bitcoin breaks above $67,300, then reaches the $69,500 to $71,000 zone and shows a clear stalling signal there, together with a matching quantitative model signal. In that case, medium-term short exposure could be raised to about 50%.
For short-term trading, the article proposes using 30% of capital with preset stop-loss levels and looking for spread opportunities based on support and resistance, using 30-minute or 60-minute timeframes.
It then lays out two specific short-term scenarios:
Plan A: test short positions in a strong resistance area
- Entry: if Bitcoin rebounds, clears the $67,300 resistance level effectively, and then shows a clear stalling signal in the $69,500 to $71,000 area with confirmation from the quantitative model, a short position of about 30% can be opened.
- Risk control: set an initial stop-loss level.
- Exit: if price pulls back to an important support zone and the model also gives a signal, positions can be closed gradually to take profit.
Plan B: try light longs in a strong support area
- Entry: if price surges and then pulls back to the $63,600 to $64,000 area, while showing signs of stabilization and a bottom signal from the model, a long position of about 15% can be opened.
- Risk control: set an initial stop-loss level.
- Exit: if price rebounds to an important resistance area and the model confirms, positions can be closed gradually.
HYPE: daily rebound signal emerges at a triple-support area
For HYPE, the article says the pullback from the June 16 high of $76.94 has been moving inside a clearly defined descending channel. The upper boundary links the highs of June 16 and July 7, while the lower boundary runs parallel to it and extends through the June 25 low.
At the same time, a long-term daily uptrend line has been in place since the daily advance began on Jan. 21. The report says that trendline connects the Jan. 21 low, was validated on Feb. 24, and extends through the May 14 low.
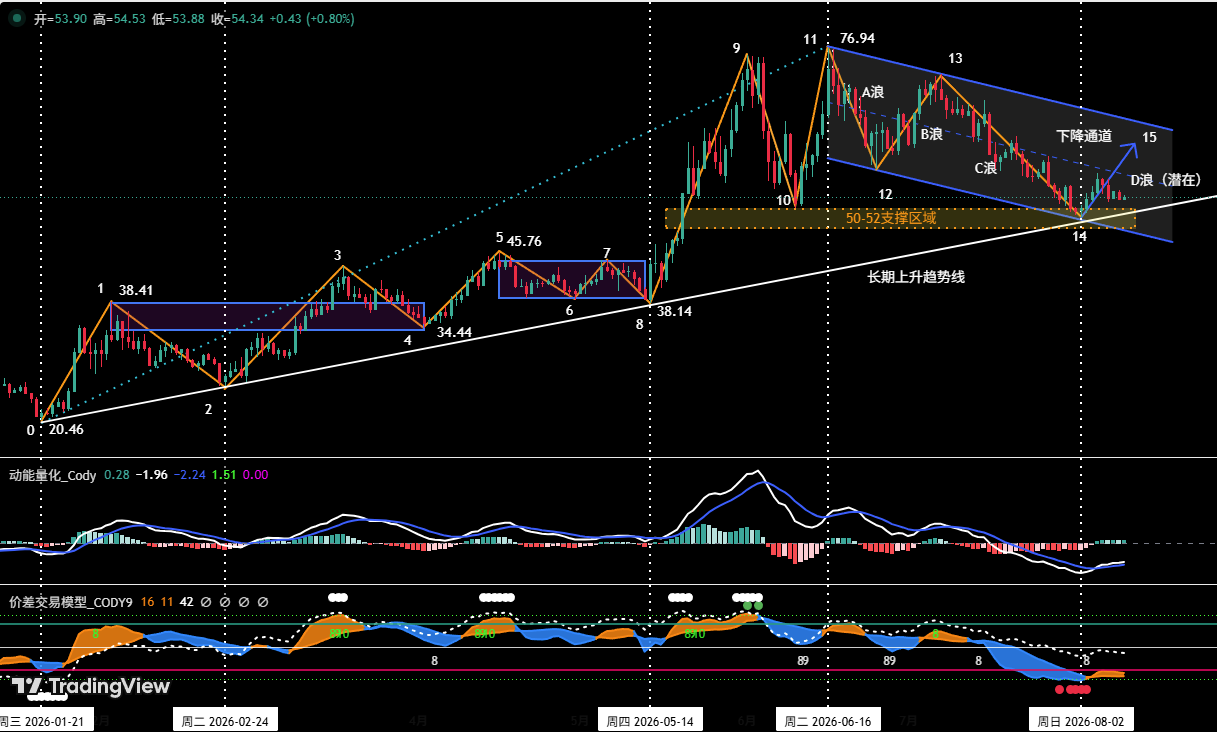
According to the analysis, HYPE pulled back on Aug. 2 to a triple technical support area where the long-term uptrend line, the lower boundary of the descending channel, and the key $50 to $52 support range meet. The article says that convergence increases the probability of a daily rebound from that area.
HYPE this week: watch the upper edge of the descending channel
The report says the main task this week is to track what happens when HYPE rebounds toward the upper boundary of the descending channel. Whether price can break that area effectively will define the character of the move, in the article’s view, as either a technical rebound or a trend reversal.
Resistance levels
- First resistance: $58.5 to $60
- Second resistance: near the upper boundary of the descending channel
- Third resistance: near $72.97
Support levels
- First support: $50 to $52
- Second support: near $45
For short-term trading, the article gives two situations:
- If a trader already opened long positions in the $50 to $52 area under last week’s plan, the report says stop-loss levels should be set and followed strictly while holding the position.
- If a trader is flat and price retests the $50 to $52 zone early in the week, then shows signs of stabilization, the article says a light long can be considered, again with strict stop-loss discipline.
Review of last week’s Bitcoin short-term long: about 2.28% gain
The article says one short-term Bitcoin long trade was completed last week based on signals from what it calls a spread-trading model and a momentum quant model. The leverage used was 1x, and the total profit was about 2.28%.
The entry logic had two parts. First, when Bitcoin fell to a level above $62,000, the market showed signs of stabilizing and the candlestick pattern formed what the article calls a bottom fractal. Second, the spread-trading model triggered a bottom warning signal, the signal band in the chart broke above the horizon, and the momentum quant model produced a synchronized bottom signal. Based on that group of signals, the article says a 30% long position was opened at $62,753.
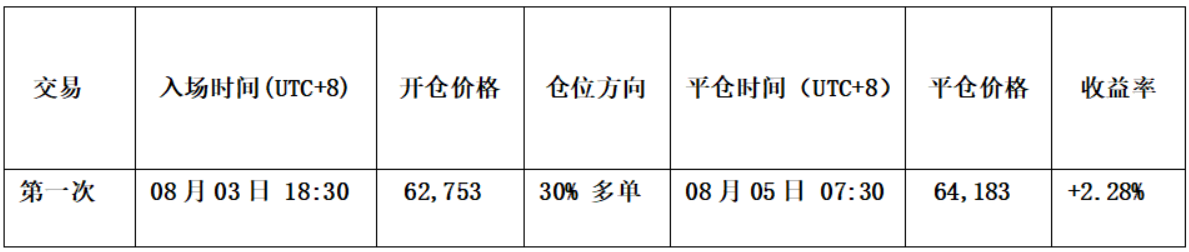
For the exit, the report says Bitcoin rose to around $65,000 and then showed signs of stalling, while the candlestick pattern formed a top fractal. The spread-trading model then issued consecutive top warning signals, the chart’s signal band broke below the skyline, and a top resonance signal appeared together with the momentum quant model. The article says the entire position was closed near $64,183.
Its summary of that trade is simple: the position ended with a profit of about 2.28%.
Risk-control notes listed in the article
The analysis closes with several risk rules:
- Set an initial stop-loss immediately after opening a position.
- When profit reaches 1%, move the stop-loss to the entry cost to protect principal.
- When profit reaches 2%, move the stop-loss to the level that locks in a 1% gain.
- After that, for every additional 1% gain, move the stop-loss up by 1% to protect and lock in profits dynamically.
The article also says financial markets change quickly and all market analysis and trading strategies need to be adjusted dynamically. It adds that all views, analytical models, and trading strategies in the piece come from personal technical analysis and are intended only as a personal trading log, not as investment advice or a basis for trading decisions.