

Bitcoin traded at $82,295, up 1.28% over the past 24 hours, after slipping below $80,000 on Thursday for the first time in more than a month.
Other major cryptocurrencies also moved higher. Ethereum gained 4.17% to $2,473.17, Solana rose 3.02%, and XRP added 2.03%.
Zcash was the strongest performer among the 15 largest coins, jumping 10.29% to $1,222.02. That pushed its market capitalization to $20.67 billion and nearly erased the almost 10% loss it posted on Thursday.
Market rebound after a weak week
The broader market was bouncing on the day after spending most of the week moving the other way.
According to CoinGlass data, Thursday’s drop triggered $948 million in liquidations, and 90.6% of them were longs. A liquidation is the forced closure of a leveraged trade after losses wipe out the collateral behind it. Because long positions are bets on rising prices, that kind of unwind can feed additional selling.
Key chart levels in focus
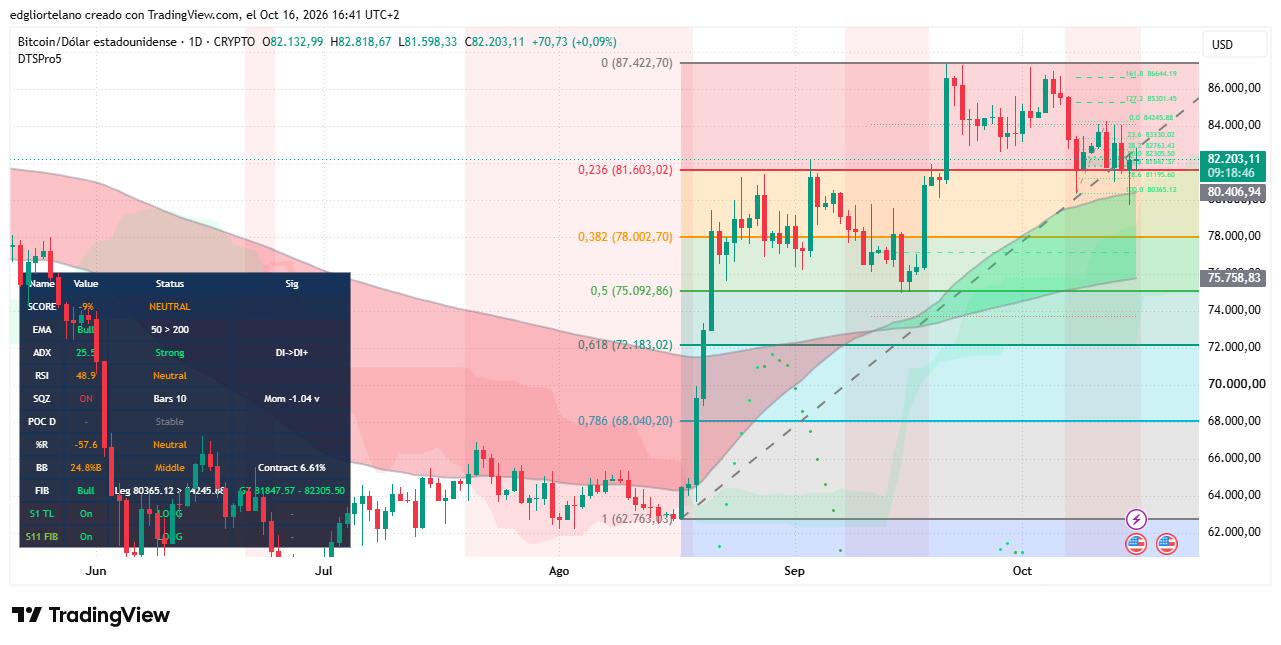
On the daily chart, Bitcoin is hugging an important resistance level at $81,603. Traders draw that area between a major low and high to estimate where buyers may step in during pullbacks. Thursday’s wick to $79,711 dipped below that level and also under the 50-day exponential moving average, or EMA, which now stands at $80,407.
The 200-day EMA is at $75,759, about 8% below the current price. With the 50-day EMA still above the 200-day EMA, the long-term trend remains bullish.
The Average Directional Index, or ADX, which measures trend strength rather than direction, reads 25.5. That is only slightly above the 25 line often used to confirm a trend, while sellers, measured by DI-, are still ahead of buyers, measured by DI+.
The Relative Strength Index, or RSI, is a momentum gauge that runs from 0 to 100, with 70 commonly seen as overbought and 30 as oversold. RSI is now at 48.9, a neutral reading that leans slightly toward sellers.
What Myriad traders are pricing in
On Myriad, the prediction market built by Decrypt parent company Dastan, traders are assigning 31% odds that Bitcoin reaches a high of $87,500 in October. That is down from 45% on Tuesday.
In a separate market on Myriad, traders now see a 43% chance that BTC falls to $77,500.
Three scenarios from the chart
Bullish case
The bullish setup requires buyers to defend $81,603 and push for a daily close above $84,246. If that happens, the next levels open up at $85,301, $86,644, and the $87,423 high. The move would ideally be confirmed by a rising ADX.
Sideways case
In a sideways scenario, Bitcoin stays between the swing low at $80,365 and $84,246.
Bearish case
The bearish setup starts with a daily close below $81,603. That would put $80,407 and $80,365 into focus first, followed by $78,003, then the $75,759 to $75,093 zone where the 200-day EMA meets the 50% retracement level.
The views and opinions expressed by the author are for informational purposes only and do not constitute financial, investment, or other advice.