

A guest analysis carried by Odaily says Bitcoin’s daily wave-a rebound from the July 1 low of $57,820 may have topped on July 21 after reaching $66,955, with the market now shifting into a wave-b correction. HYPE, meanwhile, is sitting near a key $60-$63.5 resistance band, where the next move remains unsettled.

The report reviews BTC and HYPE across multiple time frames, lays out this week’s trading plans, and checks last week’s market calls against what actually happened. It says the earlier view that Bitcoin would likely complete its first daily rebound leg near $67,300 was validated by market action. It also says the prior HYPE call — that an early-week bounce would amount to a pullback confirmation after a break below the $62-$63.5 support band — has tracked closely with the market so far.
Bitcoin structure points to a completed wave-a rebound
Daily chart: four-part correction since the May 6 high
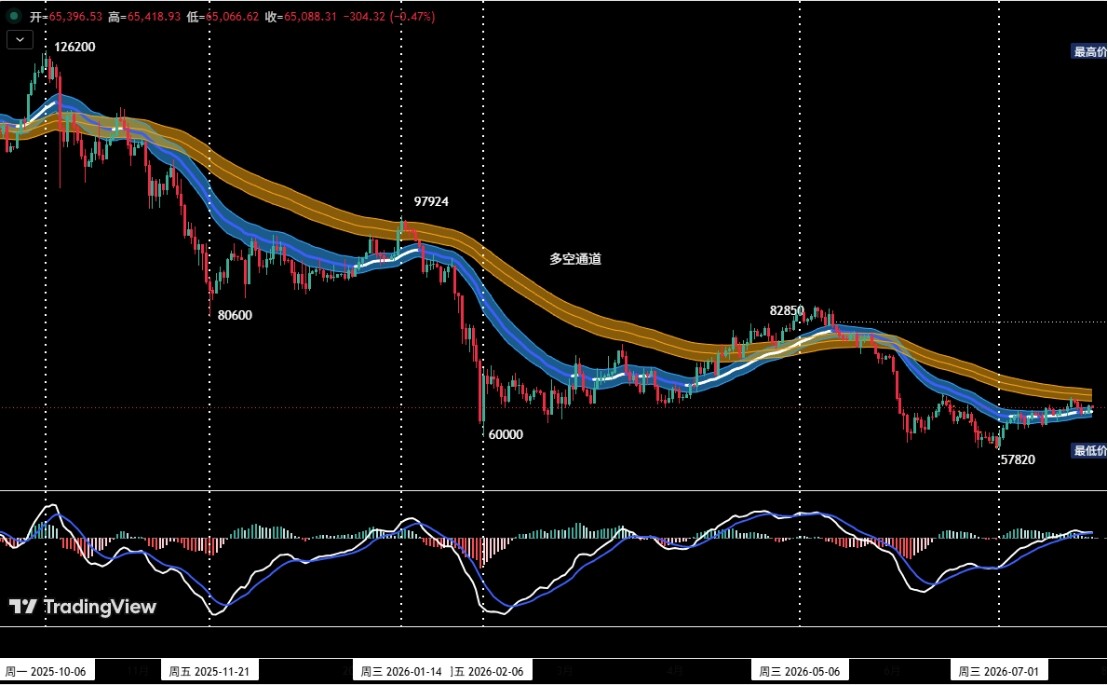
Using price action after May 6 as the basis, the analyst says Bitcoin has formed a four-leg corrective structure on the daily chart since the May 6 peak at $82,850, labeled as segments (0-1), (1-2), (2-3), and (3-4).
Within that framework, the first rebound leg from the July 1 low of $57,820 — described as wave a — may have ended on July 21 after price reached $66,955. That leaves the market, in the analyst’s view, in a wave-b adjustment.
The report adds one condition to the broader setup. If wave b completes without breaking below $57,820, Bitcoin could still have room for a later wave-c rebound that retests resistance near $67,300.
4-hour chart: weaker rebound momentum and a key retest near $65,700
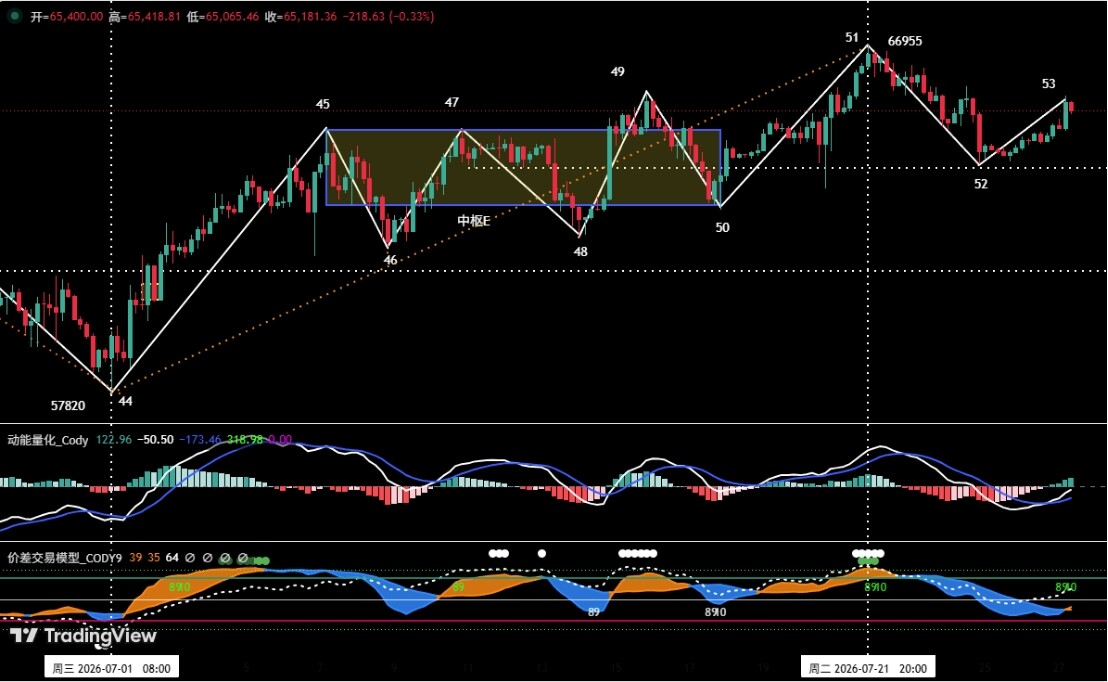
On the 4-hour chart, the rebound from point 44 on July 1, or about $57,820, through point 51 on July 21, or about $66,955, is divided into seven segments from (44-45) through (50-51).
The analyst says five overlapping segments — (45-46), (46-47), (47-48), (48-49), and (49-50) — form what the report calls a five-segment center, labeled center E. Comparing the entry leg into that center, (44-45), with the exit leg, (50-51), the report concludes that the exit rebound showed materially weaker momentum. That divergence is presented as a sign that the rebound from point 44 may already have ended at point 51.
Since point 51, the correction has already moved through two legs, (51-52) and (52-53). The current setup is described as a pullback confirmation after Bitcoin fell below $65,700.
Bitcoin levels for the week: $65,700 on the upside, $60,950-$61,500 on support
The report lists two main areas to watch this week:
- whether the market can handle a retest around $65,700, and
- how strong support proves to be if price drops into the $60,950-$61,500 zone.
Its key resistance and support levels are set out as follows:
- first resistance zone: $65,700-$67,300,
- second resistance zone: $69,500-$71,000,
- first support: around $63,700,
- second support: $60,950-$61,500,
- third support: around $57,820.
Positioning: medium-term short exposure raised to about 40%
In the medium-term plan, the analyst cites a position-monitoring model and says Bitcoin has already broken effectively below a bull-bear channel, confirming a structure now dominated by bears. Under that framework, and after a failed push near $67,000 coincided with a top signal from a proprietary quantitative model, medium-term short exposure was increased to around 40%.
For short-term trading, the report suggests using 30% position size, setting stop-loss levels, and trading price spreads around support and resistance using 30-minute or 60-minute charts.
It then lays out two scenario-based short-term plans.
Plan A: probe shorts into a strong resistance zone
- Entry: if Bitcoin rebounds into $65,700-$67,300, stalls, and the quantitative model also gives a top signal, a short position of around 30% can be opened.
- Risk control: place an initial stop-loss.
- Exit: if price corrects toward a key support area and the model confirms, positions can be reduced gradually to lock in gains.
Plan B: light long exposure near a strong support zone
- Entry: if Bitcoin pulls back but stays above the prior low at $57,820, then shows signs of stabilizing along with a model bottom signal, a long position of around 30% can be opened.
- Risk control: place an initial stop-loss.
- Exit: reduce the position gradually near major resistance if model signals align.
HYPE remains split between recovery and another leg lower
The HYPE section focuses on the 4-hour chart. The analyst says the move down from the July 7 high of $72.97 to the current area, marked from point 61 through point 71, can be divided into a 10-leg corrective structure.
Five overlapping segments — 62-63, 63-64, 64-65, 65-66, and 66-67 — are said to form a five-segment downward center. The market is now in the rebound leg marked (70-71), but the report says two paths remain open.
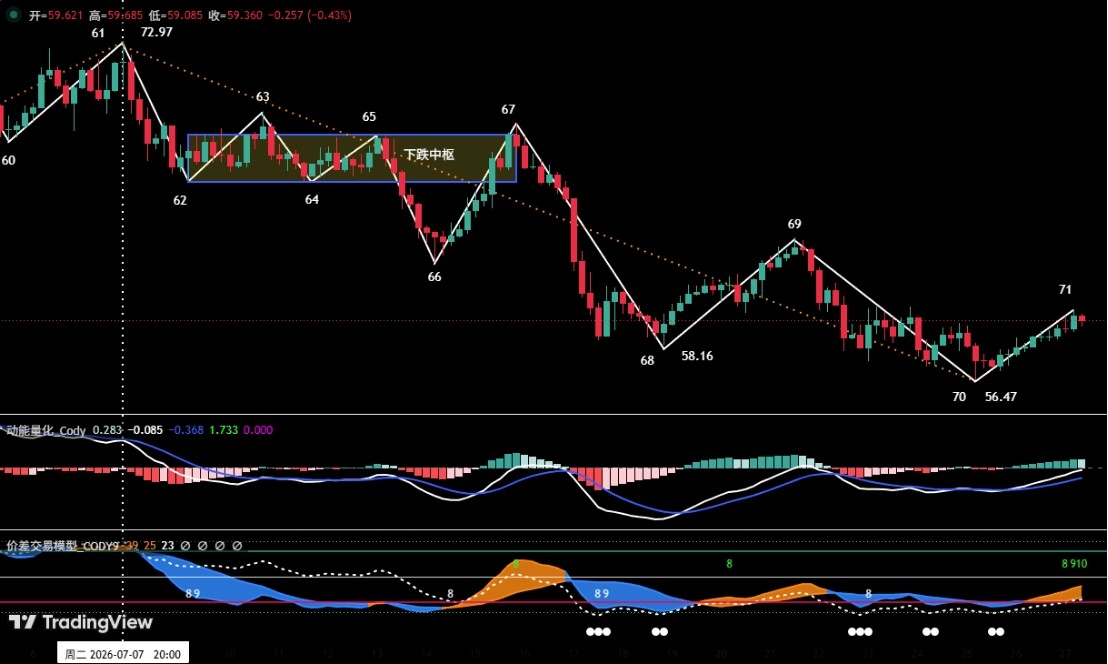
Under the first path, $56.47 marked the end of the correction. On that reading, the decline that began from $72.97 on July 7 was completed on July 24 at $56.47, and the current move is a technical recovery.
Under the second path, the market is still building a new downward center before resuming the broader downtrend, breaking below the prior low of $56.47, and searching for support lower down.
That makes two areas decisive in the near term: whether HYPE fails in the $60-$63.5 resistance band, and whether support near $56.47 holds. The outcome around those levels is presented as the key signal for which path the market is taking.
HYPE levels and short-term plan for the week
The report lists HYPE’s resistance levels as:
- first resistance: $60-$63.5,
- second resistance: $68-$69.5,
- third resistance: around $72.97.
Its support levels are:
- first support: around $56.47,
- second support: $52-$55.
The core focus for the week is unchanged: how price behaves against the $60-$63.5 resistance band and the support zone around $56.47.
For short-term trading, the analyst says that if HYPE rebounds into $60-$63.5 and then shows a clear corrective signal, traders may consider a light short position, keep exposure below 20%, and apply strict stop-loss discipline.
Review of last week’s Bitcoin short trade: about 1.70% gain
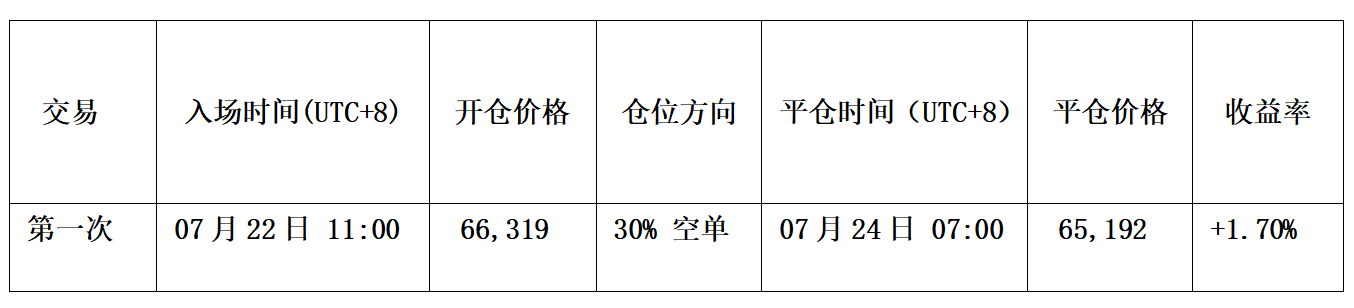
The article also reviews a short-term Bitcoin trade completed last week based on signals from the analyst’s self-built spread-trading model and momentum quantitative model. The report says the short trade, done with 1x leverage, generated an estimated gain of about 1.70%.
The entry case had two parts. First, Bitcoin showed signs of stalling near $67,000 and formed a top fractal on the candlestick chart. Second, the spread-trading model flashed a strong top warning signal, described as a white-dot and green-dot combination, after which the blue signal band on the chart broke below the green skyline, indicating downside. Those signals lined up with a correction signal from the momentum model.
On that basis, the analyst opened a 30% short position at $66,319.

The exit came after Bitcoin fell toward $64,500 and began showing signs of stabilization, with a bottom fractal appearing on the chart. At the same time, the spread-trading model triggered a series of bottom warnings, shown as red dots, and the orange-yellow signal band rose above the purple-red horizon line, aligning with a bottom resonance signal from the momentum model. The position was then fully closed near $65,192.
The result, according to the report, was a profit of about 1.70%.
Risk control notes
The article closes with a step-by-step stop-loss framework:
- set an initial stop-loss immediately after opening a trade,
- once profit reaches 1%, move the stop-loss to the entry price,
- once profit reaches 2%, move the stop-loss to the 1% profit level,
- after that, for every additional 1% gain in price, move the stop-loss up by 1% as well.
The analyst says all views, models, and trading plans in the piece reflect personal technical analysis and are kept as a personal trading log. The article states that it does not constitute investment advice or an operational basis for decision-making, and it warns that markets carry risk.