

SOL tracks a weak broader market
Solana has climbed the crypto market rankings over the past few years, but the bear market has left a mark, and the macro backdrop is offering little support to SOL right now.

According to Decrypt, Bitcoin remains pinned between roughly $62,000 support and $67,000 resistance after the early-August selloff, with price still below $65,000. Ethereum has also pulled back to the $1,825-$1,850 zone after being rejected at higher levels. With the two biggest crypto assets trading on a weak tape, the room for any altcoin rebound remains limited.
Against that backdrop, SOL was down 1.22% on the day at $75.06, giving the token a market capitalization of about $43 billion.
The report said Solana has returned to its 50-day average after pulling back from a spike near $90. Until any network catalyst actually goes live, the chart remains the main guide for traders, and that 50-day area is now the first support zone that matters for a recovery attempt.
Alpenglow and SGP-0003 are the main catalysts in view
One event traders are watching is the upcoming Alpenglow consensus upgrade. The overhaul is designed to reduce finality to 100-150 milliseconds. It has entered community validator testing and is targeted for mainnet activation in August, though Decrypt noted that the date is still a target, not a locked event.
The other development is a recent tokenomics proposal. Validators are close to advancing SGP-0003, which groups two supply-tightening changes for the Solana network.
- SIMD-0553 would introduce resource-based fees and increase daily SOL burns by more than 10x, from about 650 SOL, or roughly $48,000, to 7,500-9,000 SOL, worth as much as about $668,000.
- SIMD-0550 would double the annual disinflation rate to 30% and pull forward the 1.5% inflation floor from 2032 to 2029.
Supporters named in the report include Helius, Jupiter, Drift, and Solana Compass. Decrypt said a supply-side squeeze of that kind is the sort of catalyst that would not show up directly on the chart.
What the daily chart is showing
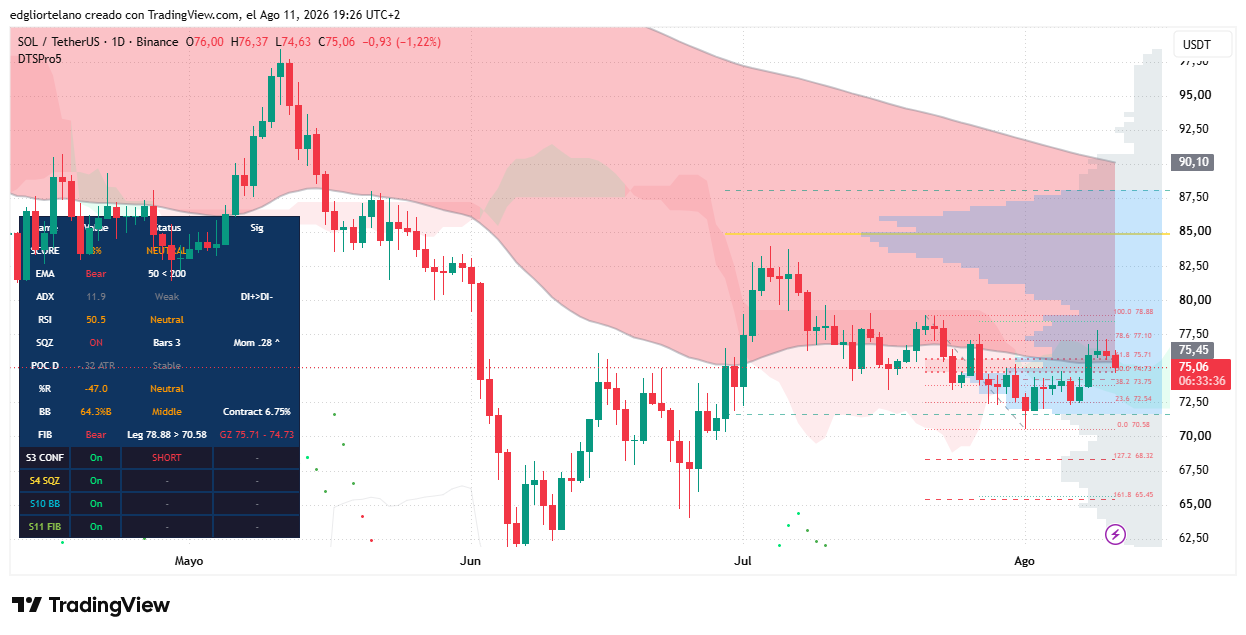
On the daily timeframe, SOL is trading at $75.06 after a 1.22% drop on the day. Following a late-August jump toward $90, the token has pulled back and is now holding just above the average price of the last 50 days, back in the support area that defines the current range.
Decrypt said Solana carved out a sharp downtrend from the mid-$90s in May to about $62 in early June. It then staged a V-shaped rally in August, peaking just below $85 before rolling over again. From that local high to $75.06, the decline works out to roughly 17%. The report highlighted that the pullback has been absorbed at the 50-day exponential moving average rather than breaking cleanly through it.
Exponential moving averages place more weight on recent closes, which helps smooth out daily noise. In that framework, the 50-day and 200-day EMAs give a clearer read on where the medium-term market actually transacted, instead of reflecting only the latest bout of panic or enthusiasm.
The report said that in a normal cycle shift, those changes tend to unfold slowly, with both EMAs gradually moving toward each other after a period of relative stability. That would be an early sign of stabilization for bulls. Even so, this rebound failed to hold above the 200-day EMA near $85, leaving the move looking more like a lower-high rejection at a major average than a true trend reset. A daily close back below the 50-day EMA would change the picture from support holding to support giving way.
Momentum and trend gauges remain muted
The Relative Strength Index, or RSI, stands at 50.5. RSI runs on a 0-100 scale, with readings above 70 typically viewed as overbought and readings below 30 seen as oversold. At 50.5, SOL is sitting almost exactly on the midpoint, which leaves momentum without a clear edge in either direction.
Squeeze Momentum has been active for three days and appears to lean toward a recovery. A squeeze points to contracted volatility and a move building under the surface. Still, the reading is only slightly positive, with +0.28 barely above zero.
The Average Directional Index, or ADX, is at 11.9. ADX measures trend strength rather than direction. Readings below 20 usually signal a directionless, choppy market where false breakouts and stop hunts are more common. The directional bias is slightly bullish, but with ADX this low, the signal carries limited weight.
Prediction market odds and the bull-bear setup
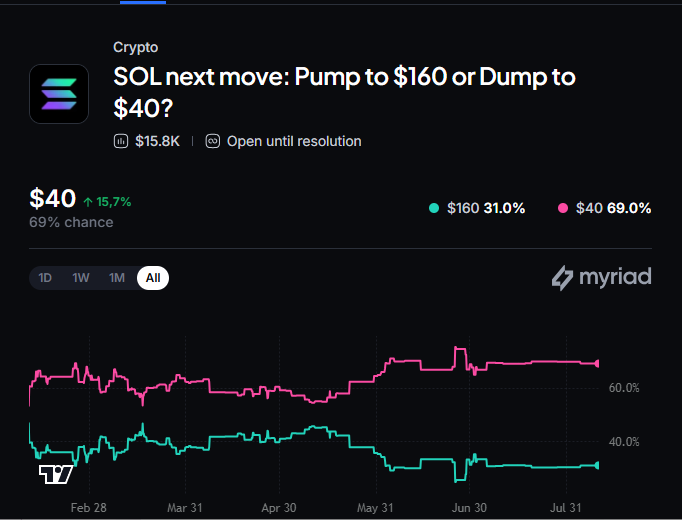
Decrypt also pointed to Myriad’s open SOL market as a way to frame the extremes. Traders there are pricing a drop to $40 at 69% and a rise to $160 at 31%, with the market remaining open until the coin reaches a target.
In the report’s reading, that 69% lean toward $40 amounts to a bet that the current hold at the 50-day EMA will eventually give way to a deeper leg lower. The chart itself does not support a run to $160 from current levels. Before that could come into view, SOL would need a daily close back above the 200-day EMA near $85, and the death cross still suggests the path of least resistance points lower.
Key levels for bulls and bears
Bull case
If SOL holds the 50-day EMA and the $74.73-$75.71 Fibonacci green zone, then reclaims $77.50, the resistance marked on the chart, the token could make another push toward the 200-day EMA near $85. Decrypt said a daily close back above $77.50 would confirm that the 50-day EMA held and reopen the August high.
Bear case
If SOL posts a daily close below $72, that would break the green zone and open the way to $70.58, followed by the early-July floor near $65.
Taking the full setup together, Decrypt said Solana is still holding its 50-day EMA, but the 200-day EMA overhead and the death cross underneath continue to frame the move as a bounce inside a downtrend rather than a confirmed turn.
The views and opinions expressed by the author are for informational purposes only and do not constitute financial, investment, or other advice.