
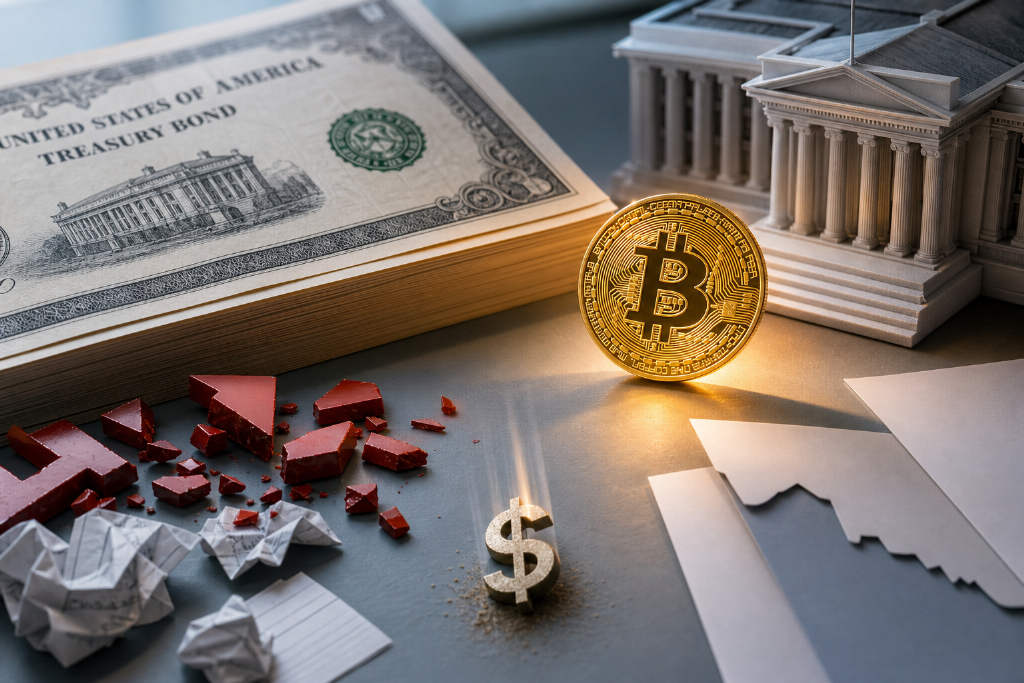
A ChainCatcher market analysis article argues that Bitcoin was not lacking reasons to stop falling, but a reason to move higher. In the author’s telling, the market supplied that catalyst less than two weeks later, and from a direction few had been betting on.
On Aug. 19 U.S. Eastern Time, Bitcoin rose 8.7% in a single day and climbed to around $69,700 intraday, its first approach to the $70,000 threshold since June. On the same day, roughly $1 billion worth of short positions were forcibly liquidated, while some estimates put the figure at $1.4 billion. The article describes the move as a classic short squeeze: traders who had borrowed and sold Bitcoin in expectation of lower prices were forced to buy it back as the market rose, pushing the price higher still.
The U.S. Treasury, not the Fed, became the trigger
The article says the spark did not come from the Federal Reserve. It came from the U.S. Treasury.
On Aug. 19, Treasury Secretary Bessent announced that the government would double the scale of its buybacks for long-dated Treasuries. Previously, the Treasury bought back up to $2 billion of older 10-year to 30-year bonds in each operation. Under the new arrangement, each operation will be at least $4 billion. The number of operations per quarter will also rise from two to four, with implementation set to begin on Sept. 9.
The article places that decision against a backdrop of 30-year Treasury yields reaching their highest level since 2007, leaving the U.S. government facing its most expensive long-term borrowing costs in 19 years. It also points to fears that tensions between the U.S. and Iran could escalate and to market doubts over the credibility of continued U.S. borrowing. In that setting, the Treasury chose to step in and buy back its own outstanding long-dated debt.
Because the Treasury cannot print money, the article says it plans to fund those purchases by issuing new short-term government debt and then using that cash to repurchase longer-dated bonds. In effect, it is borrowing short and buying long.
Three readings emerged on Wall Street
The move quickly split market commentary into three camps.
The first camp said the operation does not amount to quantitative easing. Analysts at TD Securities, as cited in the article, argued that the Treasury is not creating money. It is refinancing long-term debt with short-term debt, a switch that resembles a Treasury version of the Federal Reserve’s 2011 Operation Twist rather than QE.
A second camp disagreed and framed the program as "QE Lite." That view focuses less on whether the money is printed or borrowed and more on the result. In practical terms, the long end of the Treasury market now has a buyer that does not step away when prices are high. The article says that makes the program functionally similar to QE, while still preserving the appearance of Federal Reserve independence.
A third and sharper interpretation came from a veteran financial blog, according to the article. That argument treats the program as a circular exercise in issuing debt to buy debt, with its main real-world effect being communication: a warning to traders betting against long-dated Treasuries that the Treasury is watching.
The article argues that the academic debate matters less than the market’s response. Prices moved quickly after the announcement: long-dated Treasury yields fell, the dollar weakened, gold climbed, and Bitcoin rallied. In the author’s view, that combination showed the market had decided to treat the move as easing. The article’s stated position is clear: it sides with the functional-equivalence argument and calls the policy a disguised form of QE.
A deeper point: fiscal and monetary lines are blurring
The article says the importance of the move goes beyond one day of market action.
Normally, lowering borrowing costs is the central bank’s job. Here, the Treasury acted without waiting for the Fed. The author uses that to argue that the line between the agency that manages the government’s purse and the institution that controls the printing press is becoming less distinct. The article labels this dynamic "fiscal dominance," meaning government borrowing needs have become so large that monetary policy is forced to accommodate fiscal policy.
From a wider historical view, the piece says a government facing its highest borrowing costs in 19 years had a choice. It could borrow less and spend less, or it could step in and push rates lower so borrowing could continue. The article treats the second path as a break from fiscal discipline rather than a defense of it. It also draws a historical parallel to the post-World War II United States, when rates were held low for long periods and inflation gradually reduced the real value of debt, a textbook example of financial repression. In that kind of setting, the article says, attention returns to assets that cannot be printed.
It then links the issue to everyday concerns: mortgage rates, the purchasing power of the dollar, and whether the long-term case for assets such as gold and Bitcoin still holds.
The 8.7% jump does not settle the bottom debate
Even so, the article stops well short of calling the rally proof of a bottom. It says a meaningful share of the move came from forced short covering rather than fresh conviction buying. In the author’s wording, a short-squeeze rally can be bright like fireworks, but it does not necessarily last.
The piece notes that the most violent squeezes often happen after long declines, when bearish positioning has had time to build. In bear-market endgames, the first sharp rise can look dramatic and irrational, not because new buyers are rushing in, but because old shorts are scrambling to get out. One strong day, the author says, never tells the whole story. What matters is what comes after the squeeze burns out, and whether real demand starts to replace forced buying.
Spot volume is the metric the article watches most closely
The indicator the piece highlights is trading volume. It says Bitcoin spot-market volume by amount has fallen to its lowest level since 2019, calling that a seven-year trough.
In plain terms, the article interprets that as a market in which most of those who wanted to sell have already sold, while the next wave of buyers has not yet stepped in. That leaves a quiet market where few participants are eager to act. The author argues that major bottoming zones have often looked this way in the past: tops are noisy, bottoms are quiet.
The same picture appears in sentiment, according to the article. The last time Bitcoin traded around this area, the market was full of "it’s over" and liquidation talk. This time, even the old question of whether Bitcoin is dead has struggled to gain traction. The author says familiar bearish narratives, including claims that Bitcoin has no value or that quantum computing will break the thesis, have cycled through the market for years. What stands out now is that fewer people are even repeating them.
The "lowest since 2019" point carries another message in the article. The last time spot trading was this quiet was in 2019, before the prior major upswing began. The author does not say history must repeat, and explicitly notes the sample size is small. Still, the article says spot-volume troughs have appeared in places where the market was unwanted, not at the top of a cycle.
Institutions and researchers remain split
The article says the bearish side still dominates institutional research.
- VanEck said in an Aug. 19 report that eight of the 12 capitulation signals it tracks had been triggered, but described the market as being in a bottoming process rather than at a confirmed bottom.
- On-chain data firm Glassnode said 45 indicators were in capitulation, the longest stretch since the collapse of FTX in 2022. The article also cites Glassnode data showing long-term holders sold 356,000 BTC over the past 30 days.
- Digital-asset investment bank Galaxy forecast a fourth-quarter bottom in the $40,000 to $46,000 range, with $28,000 in a panic scenario.
- Seasonality-focused traders pointed out that Bitcoin fell in August in each of the past four years and kept targets in the $58,000 to $62,000 range for this year.
- Another group of cycle analysts placed the likely bottoming window in September to October.
The article adds that bears have one more concrete argument: spot volume remains weak while futures open interest has been rising, suggesting recent volatility has been driven mainly by leveraged short-term traders. At the same time, inflows into U.S. spot Bitcoin ETFs have been slowing, a sign that long-only capital has not returned in force.
On the other side, bullish voices grew louder after Aug. 19. Their case, as described in the article, is straightforward. The market has just tested the liquidity thesis in real time: the Treasury pushed yields lower, the dollar softened, risk assets responded, and Bitcoin has historically been one of the assets most sensitive to liquidity conditions. In that reading, the catalyst has arrived.
The piece sums up the current backdrop this way: one camp says not all capitulation signals have fired and one more drop may still be ahead; the other says the turn has already happened and those waiting for a deeper pullback may keep waiting. Both sides, the article says, have data behind them.
Three questions, not one, should frame the bottom call
The author argues that "Has Bitcoin bottomed?" is the wrong question on its own. Instead, the article breaks the issue into three smaller ones:
- Has selling pressure cleared, including the cohort that sold 356,000 BTC?
- Is this catalyst a real ignition point, or just a false move created by a squeeze?
- Is there still another risk event in the market that could trigger fresh downside?
The article says every major bottom in past cycles has required three conditions at once: sellers stop pressing, a new reason to buy emerges, and no new shock scares participants out again. Miss one of those and the bottom case is incomplete.
The author says personal answers to those three questions differ from the mainstream institutional script, but the full reasoning and final view were placed behind a paywall. The free section closes with one practical tool: watch price and volume together. A quiet decline on shrinking volume, the article says, suggests a lack of buyers but not necessarily panic. A break below prior lows on heavy volume is different; that points to aggressive selling regardless of price. The article says that framework is useful not just for Bitcoin, but for equities, gold, and any asset with public volume data.
A disclaimer at the end states that the article is a compilation of research views for reference only and does not constitute investment advice or an offer to sell securities or solicit subscriptions.