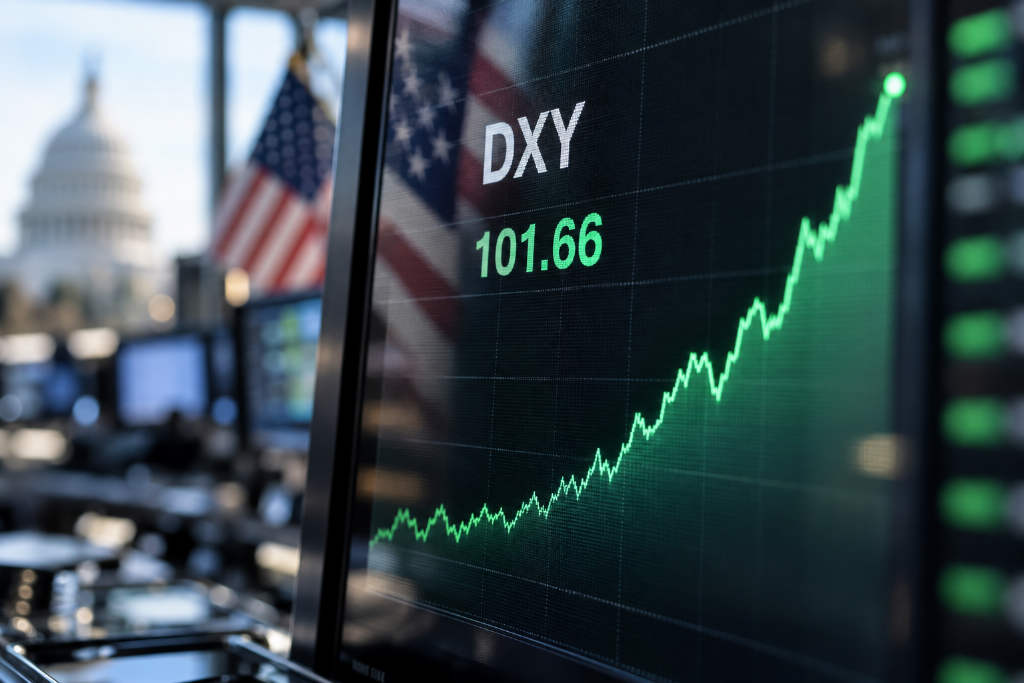
Dollar Index2026-10-01 08:24:00Dollar Index DXY briefly rises to 101.81, highest since May last yearOdaily reported that the U.S. Dollar Index, or DXY, briefly climbed to 101.81, marking its highest level since May of last year. The source did not provide additional details on how long the move lasted, what drove it, or how the index traded afterward. This is a short market update based strictly on the information provided in the original newsflash.50
DXY2026-10-01 06:20:41Dollar Index DXY Breaks Above July High, Touches 101.66According to market data cited by ChainCatcher from Gate, the U.S. Dollar Index, or DXY, moved above its previous July high and briefly reached 101.66. The reading marked the index’s highest level since late June. The update was published by ChainCatcher under the market analysis category. No additional market context or follow-up data was provided in the source item.20
DXY2026-10-01 04:32:04Dollar Index DXY Rises to a Two-Month High of 101.62The U.S. Dollar Index, or DXY, has climbed to 101.62, its highest level in two months, according to data cited by Odaily and sourced from Gate. The news was published as a 7x24 market update. The original brief did not provide additional details on the move, including the pace of gains, broader market drivers, or reactions across crypto and traditional assets. No further data points or commentary were included in the source item.20
Bitcoin2026-09-30 13:17:38Data shows Bitcoin’s 90-day link to the dollar index explains only 17% of daily movesThe U.S. Dollar Index (DXY) has rebounded to a two-month high, a move often treated as a headwind for dollar-priced assets such as Bitcoin and gold. But the BlockTempo report argues the relationship is much weaker than the market often assumes. Citing TradingView data, it says Bitcoin’s 90-day daily return correlation with DXY stood at -0.41, which translates to an R² of just 0.17. In practical terms, that means the dollar index accounts for only 17% of Bitcoin’s day-to-day return variation, while the other 83% comes from other drivers. The report also says the stronger-looking 30-day negative correlation is heavily influenced by two sessions, Aug. 19 and Sept. 3, when Bitcoin rose more than 5% while the dollar fell. Removing those outliers drops the 30-day correlation to -0.19. Looking further back, from January 2020 to the present, the average 90-day correlation was only -0.14 and even turned positive several times, reaching +0.22 in November 2024. The article adds that Bitcoin is now holding in the $83,000-$84,000 range after peaking at $87,400 on Sept. 21, while traders are also watching upcoming October nonfarm payroll data.60
Federal Reser2026-09-19 03:02:49Crypto Rallies After Fed Rate Hike as Bitcoin Draws Comparisons to Early 2022Crypto prices moved higher after the Federal Reserve raised rates by 25 basis points on Wednesday, a move that would normally weigh on risk assets. Bitcoin gained nearly 1% over the past 24 hours, while Zcash surged more than 23% to a new high. BlockTempo said the market response has revived comparisons with the early phase of the 2022 hiking cycle, when Bitcoin was also sitting about 40% below its prior peak before staging a brief rebound. The report noted that Bitcoin is now roughly 40% below the $126,000 high it set in October, a setup that resembles March 2022, when the Fed began tightening and Bitcoin was also down about 40% from its November 2021 top. Back then, Bitcoin rose 18% in the 12 days after the hike, then went on to fall 50% over the following months. At the same time, spot Bitcoin ETFs saw $746 million in outflows across Tuesday and Wednesday, while the U.S. dollar index climbed back above 100 and stayed above its 200-day moving average. Treasury yields eased, offering some support. With futures markets pricing in another 75 basis points of hikes over the next six months, the report said traders are now watching whether this rebound can hold through month-end or whether the pattern seen in 2022 will start to repeat.290
US Dollar Ind2026-09-18 18:50:42Dollar Index Rises About 1.1% This Week as Fed Rate-Hike Signal Lifts GreenbackThe U.S. dollar is on track for its best weekly performance in three months, according to market data cited by Gate and reported by ChainCatcher. The move came after the Federal Reserve signaled that it could raise interest rates further, giving the dollar fresh support. Gate data showed the U.S. Dollar Index, or DXY, has gained about 1.1% this week. The index also moved slightly above its 200-day moving average, a technical level closely watched by market participants. JPMorgan and Standard Chartered were cited as saying that additional Federal Reserve rate hikes have removed the biggest obstacle to further dollar strength. The report did not provide any additional price targets or timeline beyond the current weekly move.350
Federal Reser2026-09-18 12:46:07Citi says hawkish Fed has strengthened the dollar’s near-term case, with DXY seen at 101.15The Federal Reserve’s September policy meeting delivered a more hawkish message than many in the market had expected, and Citi Research says that shift has given the U.S. dollar its strongest near-term support. The bank said the outcome has turned the October meeting into a live one, with markets now pricing in roughly 13 basis points of additional tightening. On Citi’s reading, the Dollar Index has confirmed a double-bottom pattern and now points to 101.15. Citi also argues that the current macro mix of higher yields and pressure on equities has historically been one of the most supportive settings for the dollar. In that framework, the bank sees downside pressure on the euro, Swiss franc, Swedish krona and New Zealand dollar, and says EUR/USD could revisit the 1.13 area. At the same time, the report does not present the dollar view as one-way. Citi highlighted geopolitical tensions, the approach of the U.S. midterm elections, widening Brent spot backwardation, and volatility around Fed decision days as factors that could quickly alter market direction. The bank also flagged PCE methodology changes and the risk that much of the FOMC outcome has already been priced in.440
Bitcoin2026-09-18 05:30:21Nine Years of Data Reframe Bitcoin’s Macro Pricing: ETF Era Brought Slower Transmission and a Bigger Stablecoin RoleA long-form analysis published by Foresight revisits how Bitcoin is priced against macro forces using data from Jan. 2017 to Sept. 15, 2026, covering 2,438 trading days and 62 Federal Open Market Committee meetings. The core argument is not that BTC has broken away from the Federal Reserve, but that the transmission mechanism has changed. In the study, same-day reactions to tighter Fed signals look weak in daily data, yet the effect builds over the following days and weeks, especially after the approval of spot Bitcoin ETFs on Jan. 11, 2024. The article says BTC’s annualized volatility fell from 75.1% before ETF approval to 48.5% after, while U.S. equities gained more influence in short-term price discovery. Even so, Bitcoin did not simply become another Nasdaq trade: post-ETF, a single-factor Nasdaq 100 regression explains only 3.5% of BTC volatility. The piece also argues that crypto-native liquidity now matters more than many simple macro narratives suggest. While ln(BTC) and ln(M2) show no cointegration in the sample, ln(BTC) and ln(total stablecoin market cap) do, with an Engle-Granger test statistic of -4.160 and a p-value of 0.0042. Stablecoins, however, are presented as a slow-moving valuation anchor rather than a short-term trading signal. The broader conclusion is that Bitcoin behaves differently across regimes: as a macro risk asset after tighter Fed shocks, as a high-beta amplifier during panic, as a more independent crypto-native asset when stablecoin growth is strong, and at times as an early risk signal because it trades 24/7.580