EMA

Bitcoin
2026-08-19 02:07:52

Bitcoin Holds Around $64,500 Ahead of White House Crypto Meeting as Spot ETF Flows Turn Positive

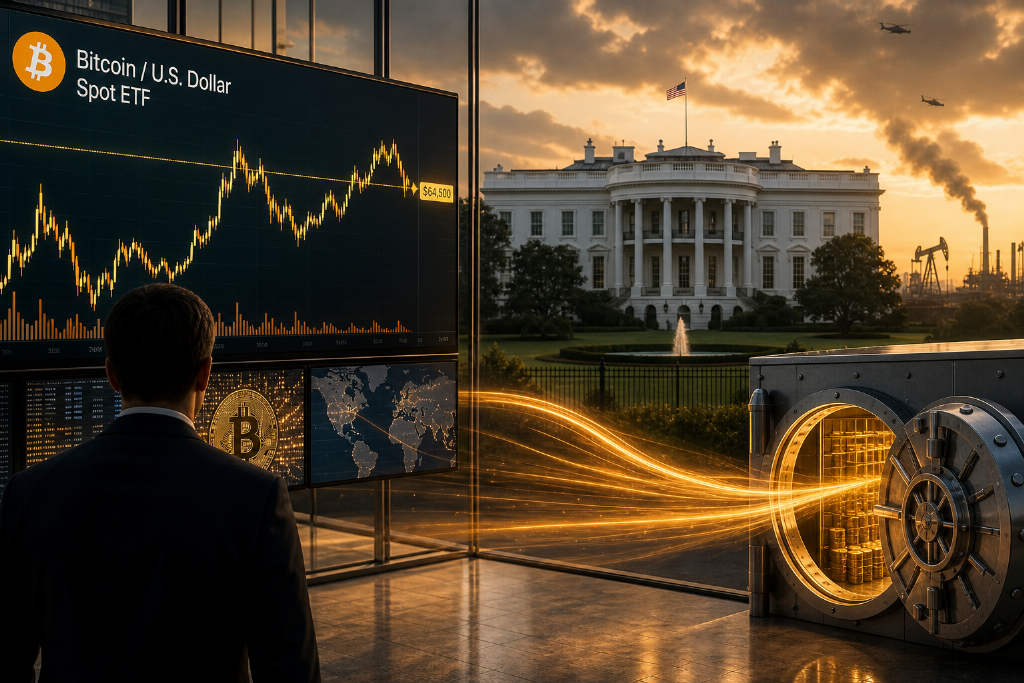
Bitcoin traded around $64,500 on the morning of Aug. 19 after climbing from below $64,000 over the previous 24 hours, even as macro and geopolitical headlines stayed tense. The immediate focus for traders is a White House crypto policy meeting scheduled for 2:30 p.m. Eastern on Aug. 19, where Donald Trump, SEC Chair Atkins and CFTC Chair Selig are set to appear. Against that backdrop, U.S. spot Bitcoin ETFs posted a net inflow of $297.56 million on Aug. 18, snapping a three-day streak of outflows, while spot Ether ETFs added another $30.85 million. The source article argues that markets are currently pricing the policy event more heavily than the breakdown in the U.S.-Iran 60-day negotiation window. Trump said there are no current talks and no new talks scheduled with Iran, while Iranian officials described a shift toward a "full offensive" posture and said the Strait of Hormuz would remain closed until conditions tied to a June interim deal are met. Oil reacted sharply, with Brent settling at $91.02 a barrel and WTI at $84.94, both the highest closes since July 24. At the same time, the report points to improving Bitcoin technicals, including a move above the 50-day and 200-day EMAs, a MACD golden cross, and a Fear and Greed Index rebound to 41. The key near-term level highlighted in the piece is $65,000, with the White House meeting seen as the main catalyst for the next directional move.

690
Bitcoin Holds Around $64,500 Ahead of White House Crypto Meeting as Spot ETF Flows Turn Positive
Pump.fun
2026-08-18 12:37:02

PUMP posts first golden cross as Pump.fun revenue climbs to a seven-month high

Decrypt’s Morning Minute said Pump.fun’s PUMP token is showing its first golden cross since launch, with the 50-day EMA moving above the 200-day EMA after a prolonged downturn. The token fell to $0.001491 in July, traded as high as $0.003 intraday on Monday, and later changed hands near $0.002733. The report tied the move to improving business performance rather than price action alone. According to DefiLlama data cited in the piece, Pump.fun generated $11.52 million in revenue over the past seven days, ranking fourth among all crypto protocols behind Tether, Circle, and Canton. The newsletter also said annualized revenue stands at $458 million against a $1.09 billion market cap, while August 10 to 16 fees reached $10.74 million, up 7% week over week. Pump said Tuesday’s $1.73 million marked its strongest single revenue day since January 30. The article also highlighted Pump.fun’s buyback-and-burn structure, recent product changes including Callout Rewards and lower trading fees, plus broader market, macro, ETF, memecoin, token, and NFT developments covered in the daily roundup.

880
PUMP posts first golden cross as Pump.fun revenue climbs to a seven-month high
Xinhuo Resear
2026-08-18 07:14:10

Xinhuo Research Institute says policy calendar and AI capital shift are key variables for Bitcoin

Xinhuo Research Institute said Bitcoin came under pressure last week as several negative signals hit at once, leaving the market waiting for a clearer catalyst. The group pointed to the U.S. Securities and Exchange Commission’s cancellation of a planned crypto rulemaking meeting, the postponement of a tokenization-related "innovation exemption" topic without a new date, and roughly $390 million in outflows from spot Bitcoin ETFs after two straight weeks of net inflows. It also cited a persistent negative premium in the Coinbase Bitcoin Price Index and a drop in the Fear and Greed Index to around 34. The institute said that catalyst may arrive this week. It highlighted an expected White House meeting with crypto and prediction-market industry executives on Aug. 19, possible participation by senior officials from the SEC and Commodity Futures Trading Commission, and the CFTC’s first Innovation Advisory Committee meeting on Aug. 20. Discussion tied to the CLARITY Act may also continue in September. Xinhuo said these events are likely to send positive policy signals and could help repair market confidence at the margin if constructive comments emerge. On the macro and industry side, the report said cooling U.S. inflation and softer retail data have sharply reduced expectations for a September rate hike, with the probability falling to about 33%, while FedWatch shows Dec. 9 as the earliest possible date for a first hike this year. It also said capital moving into AI infrastructure is tightening overall crypto market liquidity.

430
Xinhuo Research Institute says policy calendar and AI capital shift are key variables for Bitcoin
gold
2026-08-13 08:22:06

Gold Falls 26% From $5,300 Peak as 0xKyle Says Central Banks Have Started Buying Again

BlockTempo, citing trader 0xKyle, published a detailed note arguing that gold may have put in a base after a 26% drop from its $5,300 high. The core claim is that central banks resumed buying after a quiet first quarter, while price action has turned constructive at the same time. In the write-up, 0xKyle says gold has reclaimed its 50-day moving average and moved back above its 200-day EMA, while also breaking a simple downtrend line. He also points to higher-timeframe RSI readings that have hovered near oversold levels seen before earlier upswings. The article frames the setup as an asymmetric trade, with investor attention now concentrated on semiconductor and momentum stocks rather than gold. It also ties the longer-term bullish case to reserve diversification after the freezing of Russian reserves and to concerns around U.S. debt. At the same time, the author does not dismiss near-term downside. He says his 20/3 Bollinger Band model has flashed a sell signal, leaving room for a pullback before any larger move higher. The note highlights $4,341 to $4,191 as a buy-on-dip zone and places trade invalidation near $4,170 on a closing basis.

820
Gold Falls 26% From $5,300 Peak as 0xKyle Says Central Banks Have Started Buying Again
Gold
2026-08-13 08:00:09

Gold rebounds after a 26% pullback as the article points to renewed central bank buying

MarsBit published a translated market analysis by 0xKyle arguing that gold has spent months building a bottom before breaking higher, with renewed central bank buying emerging as a key part of the setup. The piece says gold peaked at $5,300 in February 2026 and then fell 26%, a move the author links mainly to changes in Chinese liquidity, the Iran war, and a pause in central bank purchases. It adds that buying appears to have resumed after a quiet first quarter, while speculative fever has cooled as attention shifted toward semiconductor and momentum stocks. The article combines that macro view with a technical case. It says gold has reclaimed its 50-day moving average, broken a simple downtrend line, moved back above the 200-day EMA, and seen the 10 EMA cross above the 21 EMA. The author also highlights weekly RSI readings near oversold levels over several weeks and cites Macro Tourist’s observation that 1-year 25-delta call skew in gold is at its lowest level since before the pandemic. For trade levels, the piece identifies $4,341 to $4,191, around the daily 50 EMA, as a possible area for limit buy orders, while placing the broad invalidation level near $4,170 on a closing basis.

700
Gold rebounds after a 26% pullback as the article points to renewed central bank buying
Gold
2026-08-13 08:03:25

Gold rebounds after a 26% drawdown as central bank buying returns, article argues

A TechFlowPost article translated from author 0xKyle argues that gold has set up an asymmetric opportunity after a months-long pullback and renewed upside break. The piece says the metal peaked at $5,300 in February 2026 and then fell 26%, with traders spending months trying to identify a bottom. In the author’s view, the more important shift is that central banks have moved back into net buying after a quiet first quarter, while speculative excess has largely been flushed out. The article ties the correction to several factors, including Chinese liquidity conditions, the Iran war and a pause in central bank purchases. It also points to a March 2 peak in a chart tracking the year-over-year change in the People’s Bank of China’s net liquidity injections into China’s money market, smoothed by a 50-day moving average. Although daily reverse repos have recently picked up, the author says the clearer signal is that official-sector buying has resumed. On the technical side, the piece says gold has reclaimed its 50-day moving average, broken a descending trendline, moved back above the 200-day EMA and seen the 10-day EMA cross above the 21-day EMA. At the same time, the author warns that a (20/3) Bollinger Band setup has flashed a sell signal, suggesting a short-term pullback could come first. The zone between $4,341 and $4,191 is presented as an area to watch, with roughly $4,170 marked as the trade invalidation level.

590
Gold rebounds after a 26% drawdown as central bank buying returns, article argues
Solana
2026-08-11 20:46:04

Solana Holds Near Its 50-Day Average as Upgrade Hopes and Supply Proposal Shape the Next Move

Solana is trading at $75.06, down 1.22% on the day, as the token sits just above its 50-day exponential moving average after retreating from a late-August spike near $90. Decrypt said the broader market backdrop remains soft, with Bitcoin stuck between roughly $62,000 support and $67,000 resistance and Ethereum pulling back to the $1,825-$1,850 area after failing to hold higher levels. That weakness in the two largest crypto assets is limiting how far any rebound in SOL can run. Two potential catalysts are in focus. The first is Solana’s planned Alpenglow consensus upgrade, which is intended to reduce finality to 100-150 milliseconds. It has entered community validator testing and is targeted for mainnet activation in August, though the date is still a target rather than a fixed event. The second is SGP-0003, a tokenomics proposal that combines SIMD-0553 and SIMD-0550 to tighten supply. According to the report, the changes could lift daily SOL burns from about 650 SOL to 7,500-9,000 SOL and bring forward the 1.5% inflation floor from 2032 to 2029. On the chart, RSI sits at 50.5 and ADX at 11.9, pointing to neutral momentum and weak trend strength. Decrypt framed the setup as a bounce within a downtrend, not a confirmed reversal, with $77.50, $85, $72, $70.58, and roughly $65 acting as key levels.

1120
Solana Holds Near Its 50-Day Average as Upgrade Hopes and Supply Proposal Shape the Next Move
Policy Regula
2026-08-11 10:25:10

New Huo Research: ETF inflows surge while Bitcoin sentiment stays in fear territory

New Huo Research said the crypto market showed an unusual split over the past week: capital kept flowing in, but sentiment remained weak. U.S. spot Bitcoin exchange-traded funds took in $853 million, the biggest weekly net inflow since mid-April, with BlackRock’s IBIT accounting for more than 80% of that total. Spot Ether ETFs added another $245 million, pushing combined weekly crypto ETF inflows above $1.1 billion. Even so, the Fear and Greed Index stayed at 31 to 32, and Coinbase’s Bitcoin discount extended to 82 days, the longest run on record for that indicator. The report also pointed to several catalysts shaping the market. U.S. July nonfarm payrolls unexpectedly showed a decline of 23,000 jobs versus expectations for an increase of 80,000, while the unemployment rate edged down to 4.2% because of labor force exits. On Polymarket, the probability of a 25-basis-point rate hike in September was put at 36%. New Huo Research said traders are now focused on the July CPI report due on Aug. 12, the last key macro print before the Sept. 16 FOMC meeting. It also flagged the delayed Senate vote on the CLARITY Act, a Coldcard firmware exploit tied to the theft of 1,500 to 2,000 BTC, and Strategy’s sale of 1,638 BTC as factors influencing the current market setup.

1050
New Huo Research: ETF inflows surge while Bitcoin sentiment stays in fear territory