Bitcoin2026-09-22 09:22:30PlanB says BTC is above all major realized price levels and could set a new high this cyclePlanB said in a post on X that Bitcoin is trading at about $87,000 and has moved above all major realized price levels he tracks. He listed the aggregate realized price at roughly $53,000, the 155-day realized price at about $72,000, and the 2-year realized price at around $86,000. Based on those levels, he said the odds of BTC falling below $53,000 in the current cycle are now low. He also argued that the view that Bitcoin would revisit the aggregate realized price, as it did in prior bear markets, has lost what he described as its last relatively clear condition for holding. In the same post, PlanB said price action in 2025 and 2026 fits the pattern of a historically milder bull-bear cycle. He added that he expects Bitcoin to print a new all-time high during the current halving cycle, which he defined as running from 2024 to 2028.510
Bitcoin2026-08-13 04:06:52Bitcoin Faces Two-Month Resistance at Short-Term Holder Realized Price, Trader WarnsIn a post on X, trader Murphy (@Murphychen888) said the realized price for bitcoin's short-term holders — defined as coins held for less than three months — is currently around $67,900. Since June 20, bitcoin's bounce near that level has been repeatedly suppressed, with the resistance now persisting for nearly two months. The slope of the cost curve has also flattened to near zero, suggesting that the turnover of related coins is steadily declining. Murphy noted that similar patterns appeared in late bear markets in 2018 and 2022, when BTC was capped below the three-month realized price for roughly three months before the BCH hash war and the FTX collapse led to sharp price swings. He believes the prolonged suppression under this cost line may reflect a structural weak balance in the market — any external force could break it.1300
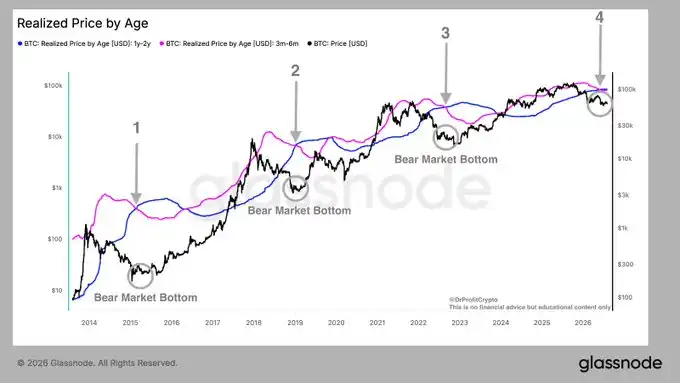
Bitcoin2026-08-12 08:44:07Bitcoin Historical Indicator Flashes Bottom Signal, Trader Doctor Profit Reveals Accumulation TradesDoctor Profit, a well-known trader, says a historical Bitcoin indicator is signaling that the bottom has either formed or is very close. He points to the same pattern seen in 2015, 2019 and 2022, when bear-market bottoms began as the realized price of 3-to-6-month holders fell below the realized price of 1-to-2-year holders. That cross suggests newer buyers are capitulating at a loss, transferring coins to long-term holders. The indicator is now appearing for the fourth time, with BTC trading below the average cost of both holder groups. However, history shows the signal is rarely followed by an immediate reversal; Bitcoin has typically needed several months of sideways movement to complete the bottom. Doctor Profit sees the current phase as both bear-market bottom formation and a long-term accumulation window. He said he has been buying BTC in the $54,000-$64,000 range over the past few weeks and continues to build his position in 5% increments.1570
bitcoin2026-08-12 08:41:57Trader Doctor Profit: Bitcoin's Historic Bottom Signal Flashes Again, Months of Consolidation May FollowVeteran trader Doctor Profit says a historically reliable bitcoin bottom indicator has flashed for the fourth time, with the current setup mirroring the 2015, 2019 and 2022 bear market floors. The signal is triggered when the realized price of 3-to-6-month holders crosses below that of 1-to-2-year holders, suggesting newer buyers are capitulating and selling at a loss while supply shifts to longer-term hands. Bitcoin is now trading below the average cost basis of both cohorts. Still, the signal has rarely produced an immediate reversal: BTC has typically spent several more months grinding sideways before completing a base, a stretch Doctor Profit views as a long-term accumulation window. He said he has been buying BTC in tranches between $54,000 and $64,000 over the past few weeks, adding 5% of his position at a time.1770
Bitcoin2026-08-09 14:55:53Bitcoin Faces $67K and $72K Cost-Basis Walls, CryptoQuant Analyst WarnsBitcoin's recovery could stall at two cost-basis resistance levels, warns CryptoQuant analyst ShayanMarkets. Using realized price UTXO age band data, he found that holders who bought between one and three months ago carry an average cost of $67,000, while those who bought three to six months ago have an average cost of $72,000. Both exceed the current spot price near $65,000, implying that most recent buyers are currently at a loss. If the rally extends, these investors may sell as price approaches their entry points, creating selling pressure at the $67,000 level first. A second wall stands at $72,000, tied to the older cohort. The analyst argues that a decisive move above both realized price levels would show the market absorbing the overhang from recent purchasers, strengthening the case for sustained upside. Until then, resistance above remains significant. The comments come amid bitcoin trading around $65,000, with short-term holders in a state of unrealized loss. The analysis highlights the importance of on-chain cost distribution in assessing market dynamics.1730
Ethereum2026-08-06 09:25:05alicharts: ETH's MVRV 0.8 Support Points to $2,300 Run, $3,000 ResistanceCrypto analyst alicharts points to Ethereum's near-six-year price history as evidence that ETH typically finds support at the MVRV 0.8 level, then pushes higher toward its realized price of roughly $2,300. The current signal mirrors four previous MVRV momentum golden crosses from prior cycles, which were followed by gains between 50% and 166%, according to the analyst. Beyond the support setup, alicharts flags $3,000 as a key resistance zone, noting that more than 10 million ETH have historical transaction records around that price level. The call was carried by ChainCatcher's market analysis desk on August 6, 2026. Within the six-year sample the analyst cites, each prior golden cross preceded a double-digit rally, and the MVRV 0.8 retest served as the consistent setup for those moves. The $3,000 zone, by contrast, sits where a heavy concentration of on-chain transaction history has been recorded, marking it as the level the analyst expects to cap upside.1900
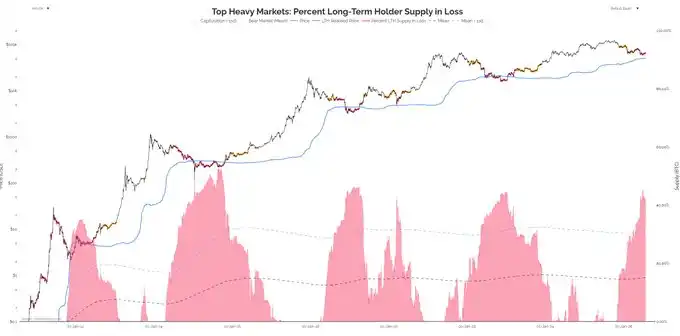
Bitcoin2026-07-26 01:07:02Trader Killa says Bitcoin long-term holder supply in loss has moved above FTX-collapse levelsCrypto trader Killa said the current amount of Bitcoin supply held by long-term holders at a loss has risen above the level seen during the FTX collapse and is now close to conditions seen in the 2018 bear market. In his view, that matters because historical cycle signals have not always behaved as expected. He noted that in the previous Bitcoin bull cycle, about 80% of cycle-top indicators were never triggered, which suggests bottom indicators may also fail to appear in a textbook way this time. Killa also pointed to Bitcoin’s realized price, which he said is currently around $50,000. In past cycles, market price has tested the long-term holder realized price, so a return to that area cannot be ruled out. Still, he said that should not be taken as a firm call that Bitcoin must revisit the level. His broader point was that traders should avoid relying mechanically on historical indicators when trying to define a market bottom. Even so, he said the degree of loss in the market now is already comparable to the FTX event period and the 2018 bear market.1420
Bitcoin2026-07-24 01:35:16PlanB Warns Bitcoin Could Fall Below the $53,000 Realized PricePlanB said Bitcoin has historically bottomed below its realized price in every bear market, placing focus on the current $53,000 level. His latest post triggered sharp debate over whether BTC is heading for a new low.510